Market Overview
| Study Period | 2020 - 2031 |
|---|---|
| Forecast Data Period | 2026 - 2031 |
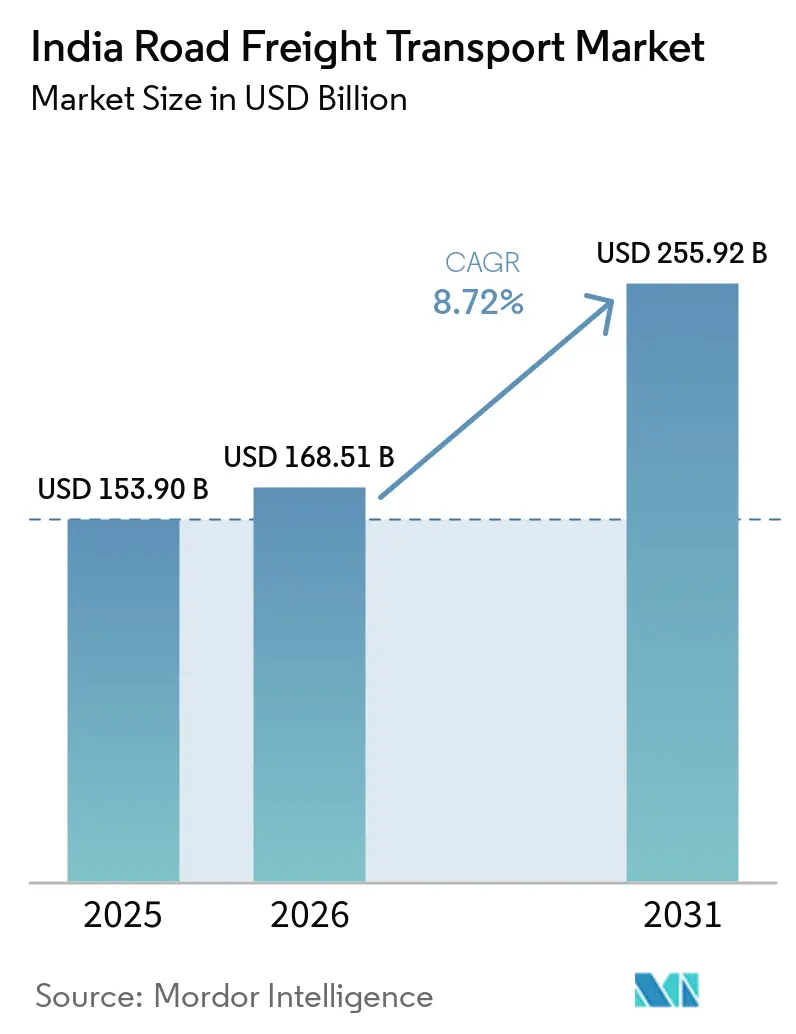
| Base Year Market Size (2025) | USD 153.90 Billion |
| Market Size (2026) | USD 168.51 Billion |
| Market Size (2031) | USD 255.92 Billion |
| Growth Rate (2026 - 2031) | 8.72% CAGR |
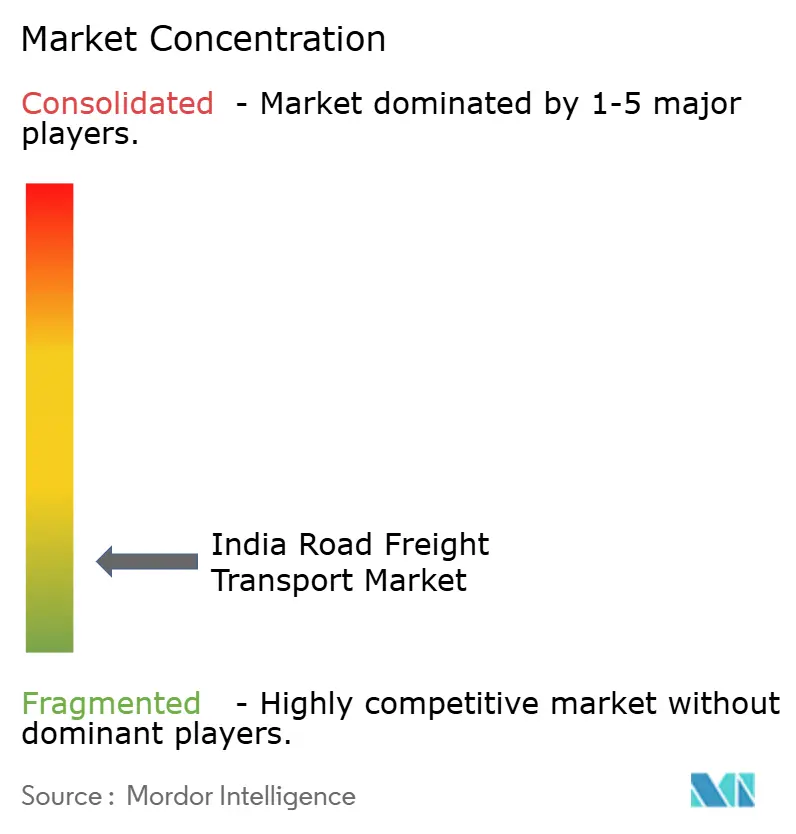
| Market Concentration | Low |
Major Players *Disclaimer: Major Players sorted in no particular order Image © Mordor Intelligence. Reuse requires attribution under CC BY 4.0. | |
India Road Freight Transport Market Analysis by Mordor Intelligence
The India Road Freight Transport Market size is projected to be USD 153.90 billion in 2025, USD 168.51 billion in 2026, and reach USD 255.92 billion by 2031, growing at a CAGR of 8.72% from 2026 to 2031.
Expansion aligns with India’s shift toward consumption-driven growth, supported by public capital formation in highways and logistics, a manufacturing rebound under Make in India, and an e-commerce buildout into Tier-2 and Tier-3 cities that demands denser road-based distribution nodes. Full-truck-load continues to anchor long-haul trunk routes, while less-than-truckload gains share as quick-commerce, SME shipments, and multi-stop routes scale through digital platforms that lower empty miles and improve asset turns. Manufacturing momentum has strengthened network intensity, with gross value added rising 7.72% in Q1 and 9.13% in Q2 of FY 2025-26, alongside a 7.8% industrial production uptick in December 2025, which has tightened service-level expectations and shifted demand toward specialized configurations in automotive, electronics, and pharmaceuticals. Warehousing footprints expanded in 2025 to 610 million square feet across major and emerging markets as 3PLs and e-commerce firms consolidated regional fulfillment to shorten lead times and reduce stockouts in non-metro demand centers.
Key Report Takeaways
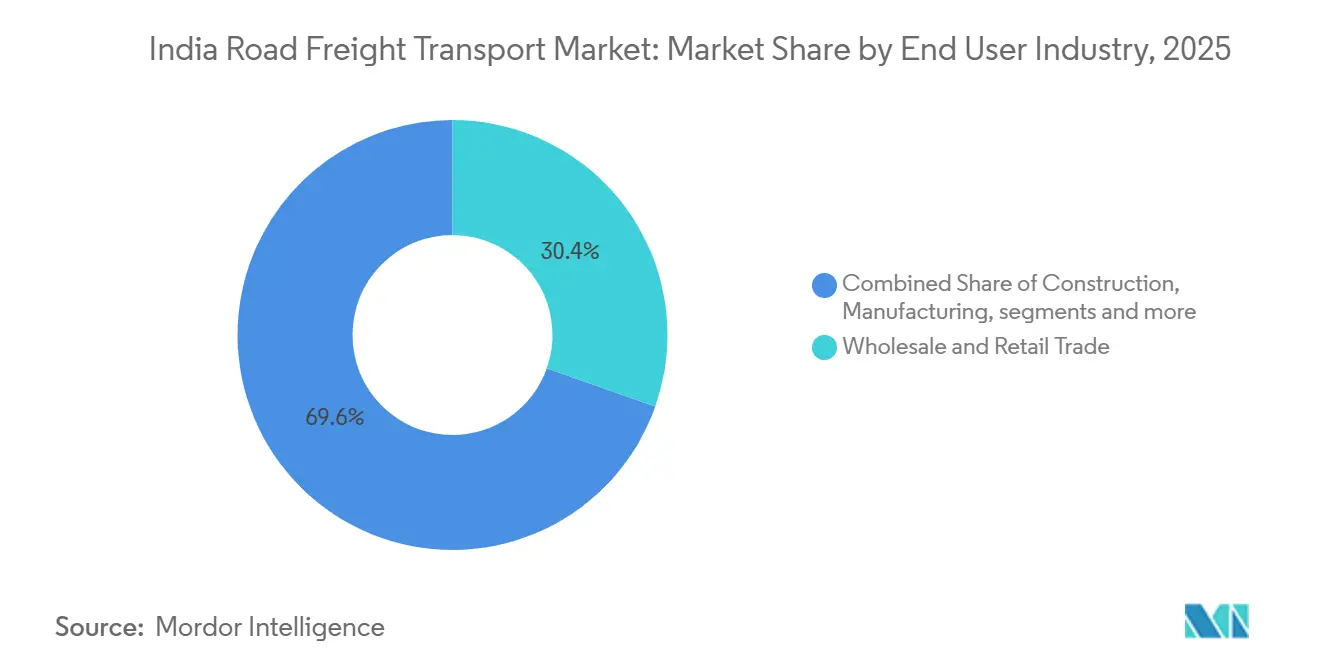
- By end-user industry, wholesale and retail trade led the India road freight transport market, with 30.45% of the market share in 2025. Manufacturing is forecast to expand at a 10.32% CAGR to 2031.
- By destination, domestic movements held 63.15% of the India road freight transport market share in 2025. Cross-border freight is projected to grow at a 9.21% CAGR between 2026-2031.
- India's road freight transport market size, for Less-than-truckload, is expected to grow at a 10.21% CAGR through 2026-2031.
- In containerized shipments, non-containerized shipments accounted for 86.43% of the share in 2025. Containerized freight is set to grow at a 9.12% CAGR through 2031.
- By goods configuration, solid goods accounted for 73.21% in 2025. Fluid goods are projected to grow at a 9.52% CAGR through 2026-2031.
Note: Market size and forecast figures in this report are generated using Mordor Intelligence’s proprietary estimation framework, updated with the latest available data and insights as of 2026.
India Road Freight Transport Market Trends and Insights
Drivers Impact Analysis*
| Driver | (~) % Impact on CAGR Forecast | Geographic Relevance | Impact Timeline |
|---|---|---|---|
| Manufacturing Push Under Make in India | +1.8% | National, concentrated in Gujarat, Maharashtra, Tamil Nadu, Haryana | Medium term (2-4 years) |
| Rising FMCG Distribution into Rural & Semi-Urban Markets | +1.5% | National, with accelerated penetration in Uttar Pradesh, Bihar, Madhya Pradesh, Odisha | Short term (≤ 2 years) |
| Growth in Construction & Infrastructure Material Movement | +1.3% | National, infrastructure-dense clusters including NCR, Mumbai Metropolitan Region, Bengaluru | Medium term (2-4 years) |
| Warehousing Expansion Across Tier-2 and Tier-3 Cities | +1.2% | Emerging markets: Chandigarh-Rajpura, Lucknow, Nagpur, Coimbatore, Indore, Jaipur | Medium term (2-4 years) |
| Dedicated Freight Corridors Supporting Multimodal Integration | +1.0% | Western and Eastern corridors, planned North-South and East-West extensions | Long term (≥ 4 years) |
| Growth of Quick Commerce & Hyperlocal Delivery Models | +1.0% | Metropolitan centers and Tier-1 cities | Short term (≤ 2 years) |
| Source: Mordor Intelligence | |||


Manufacturing Push Under Make in India Initiative
Production-linked incentives across priority sectors and the National Manufacturing Mission’s target to raise manufacturing’s GDP share are reshaping freight flows toward specialized, higher-value movements that require just-in-time, quality-controlled handling.[1]Press Information Bureau, “Union Budget FY 2026-27: Manufacturing Sector Driving India’s Next Growth Phase,” Press Information Bureau, pib.gov.in Manufacturing gross value added rose 9.13% in Q2 FY 2025-26, and industrial production gained 7.8% in December 2025, signaling strong factory utilization that translates into steady lane density across automotive, electronics, and machinery clusters. A Container Manufacturing Scheme of INR 10,000 crore is in place to localize components and build a domestic ecosystem, a measure that supports container availability and speeds turnaround for intermodal transfers in core export corridors (USD 1.2 billion). Programmatic infrastructure planning under PM GatiShakti has mapped over 1,600 data layers across ministries to reduce bottlenecks, align road-rail-port interfaces, and shrink lead times for manufacturing-linked freight. India’s improvement in the Global Innovation Index and ongoing PLI disbursements are reinforcing a pivot toward export-calibrated production, which requires consistent, on-time performance from the India road freight transport market. Together, these elements sustain enterprise demand for organized, tech-enabled operators that can guarantee service levels as factory output scales across industrial belts.
Rising FMCG Distribution into Rural & Semi-Urban Markets
Rural consumption has outpaced urban consumption on recent growth metrics, with premium FMCG penetration in rural households now exceeding 40% of national volumes, which motivates distributed warehousing and short-haul replenishment cycles in Tier-2 and Tier-3 markets. Digital commerce pilots linking FMCG firms with ONDC improved delivery time and fill rates, reducing waste and improving vehicle productivity on thin but high-frequency lanes that matter for rural kirana coverage. Warehousing absorption has expanded in secondary cities as operators push inventory closer to demand, with 3PLs and e-commerce responsible for the bulk of take-up in 2025. As FMCG spends scale, flexible storage, cross-dock nodes, and two-wheeler or light commercial fleets intensify route density, which supports growth in the India road freight transport market, where multi-stop deliveries and fast turns shape utilization economics. Sector estimates for FMCG expansion to USD 220 billion in 2025 highlight the value of responsive distribution in emerging catchments where stock visibility and fill rates drive shelf availability. The implication is a continued build-out of short-haul legs and regional nodes, which depend on reliable ambient and temperature-controlled capacity in non-metro markets.
Growth in Construction & Infrastructure Material Movement
Transport infrastructure and public capex have supported steady movement of cement, steel, aggregates, and heavy equipment, which feed long-haul and regional bulk lanes that are core to operator revenue mix. A pipeline of national highway projects and multimodal logistics parks is improving axle-load norms and access geometry, thereby reducing unit transport costs and improving the reliability of delivery of building materials for time-bound projects. Corridor-grade expressways are halving logistics time on key routes as sections open, reinforcing long-haul consistency that benefits full-truck-load operators on high-density corridors in western and northern India. Planned multimodal logistics parks integrate rail sidings, road access, and on-site storage to streamline the first and last mile, thereby tightening cycle times and supporting container-compatible shipments where feasible. As construction shifts toward modular and prefabricated models, schedule precision rises and shipment sizes become more frequent but smaller, which lifts demand for reliable slotting and higher service discipline in the India road freight transport market. These changes reinforce the need for telematics, route planning, and preventive maintenance to hit tighter windows on project sites.
Dedicated Freight Corridors Supporting Multimodal Integration
Commissioning across the Western and Eastern Dedicated Freight Corridors has enabled double-stack container trains to operate at higher axle loads and cruising speeds, shifting trunk-haul economics and raising the role of road in time-sensitive first- and last-mile deliveries. The Trucks-on-Trains initiative has completed more than 1,955 trips, carrying over 1 million tonnes and generating cumulative revenue of over INR 131 crore, cutting end-to-end rail-leg time and displacing dozens of truck trips per rake on saturated corridors (USD 15.7 million).[2]Ministry of Railways, “Trucks-on-Trains: A Strategic Modal Shift,” Press Information Bureau, pib.gov.in Operators can synchronize pickup and drop windows with scheduled intermodal moves to exploit rail’s cost advantage while retaining road’s service agility for shippers with stringent delivery promises. Budget announcements for new corridors and additional waterways will increase modal options for bulk commodities, which, in turn, will free up road capacity, where flexibility and time-definite delivery matter most. As nodes connect and dwell times fall, containerized road-rail moves are likely to increase, supporting sustained growth in the India road freight transport market. In parallel, road fleets will adapt their footprints to align with rail schedules and port cutoffs, reducing idle time and increasing asset productivity on both long-haul and feeder legs.
Restraints Impact Analysis*
| Restraint | (~) % Impact on CAGR Forecast | Geographic Relevance | Impact Timeline |
|---|---|---|---|
| Chronic Driver Shortage Across Long-Haul Routes | -1.8% | National, especially northern and eastern states | Short term (≤ 2 years) |
| Highly Fragmented Small Fleet Operator Base | -1.3% | National, concentrated in rural and semi-urban areas | Long term (≥ 4 years) |
| Diesel Price Volatility Impacting Margins | -0.9% | National, acute for small fleets and long-haul legs | Short term (≤ 2 years) |
| Urban Congestion & First/Last-Mile Inefficiencies | -0.8% | Metropolitan centers and Tier-1 cities | Medium term (2-4 years) |
| Source: Mordor Intelligence | |||
Chronic Driver Shortage Across Long-Haul Routes
India faces a shortage of around 2.2 million skilled drivers, with only 55 to 60 drivers available for every 100 trucks, which depresses fleet utilization and creates service variability on long-haul routes. Attrition is high due to health risks, extended time away from home, and variable earnings, which raise hiring and training costs while reducing shippers' predictable capacity. Government programs have added training centers and certifications, but remain below the scale needed to close the gap, and operators report higher wage inflation during peak seasons as they scramble to fill headcount. Safety concerns and fatigue remain material contributors to accidents, underscoring the need for structured rest facilities and more stable schedules on key corridors. Digital scheduling, route optimization, and telematics tools are helping to reduce chaos and cut empty kilometers, yet the structural undersupply of trained drivers continues to cap the pace of growth in the India road freight transport market. The result is a premium for reliable capacity on long-haul lanes coupled with slow penetration of advanced safety systems in small-fleet segments.
Diesel Price Volatility Impacting Margins
Fuel accounts for more than 40% of road transport operating costs, making operators highly sensitive to diesel price cycles and to any delays in freight rate pass-through.[3]National Council of Applied Economic Research for DPIIT, “Assessment of Logistics Cost in India,” DPIIT, master-dpiit.digifootprint.gov.in High import dependence for crude amplifies domestic volatility, and small fleets without contractual escalation clauses absorb shocks that compress margins on long-haul and brokered freight. An INR. 5 per liter increase in diesel prices can significantly raise per-trip costs on 500-kilometer runs, and rate revisions often lag by weeks, generating temporary profit squeezes even for efficient operators. Exclusions from GST deny input tax credits, keeping fuel taxes as sunk costs that cannot be offset elsewhere in the value chain. Operators are responding with tighter monitoring of idling, preventive maintenance, and route planning, yet volatility remains a standing risk to cash flows in the India road freight transport market. Any policy steps that stabilize fuel taxation or enable hedging access for SMEs would directly improve sector resilience and service reliability.
*Our forecasts treat driver/restraint impacts as directional, not additive. The impact forecasts reflect baseline growth, mix effects, and variable interactions.
Segment Analysis
By End User Industry: Manufacturing Momentum Reshapes Freight Profiles
Wholesale and retail trade held 30.45% of the India road freight transport market in 2025, supported by FMCG distribution, organized retail expansion, and e-commerce penetration beyond Tier-1 metros. Manufacturing is the fastest-growing end user, set to expand at a 10.32% CAGR through 2031 as PLI incentives and the National Manufacturing Mission lift capacity additions in automotive, electronics, and pharmaceuticals. In Q2 FY 2025-26, manufacturing gross value increased 9.13%, while December 2025 data showed notable gains in motor vehicles and electronics that require secure, time-sensitive transport and specialized handling for parts and finished goods. Construction remains a vital volume base for bulk solid materials and heavy equipment, with corridor-grade highways improving payload economics and reducing time variance on major routes. Agricultural and allied sectors benefit from improved rural roads, which expand market access for perishables and inputs, though seasonality and fragmentation still favor small-fleet operators in these niches.
As manufacturing expands, the India road freight transport market will see continued demand for organized operators with cross-dock capabilities, temperature control, and compliance-ready documentation that multinational shippers require. Oil and gas, mining, and extractive sectors drive tanker and tipper movements that are more asset-intensive and require strict adherence to safety standards, which confer pricing power to well-capitalized fleets. Pharmaceutical cold chains demand precise temperature logging and secure custody, while electronics and automotive components require low-damage handling and on-time delivery, each of which raises the premium for technology-backed operators. With distributed consumption and factory clusters rising together, lane-mix complexity will increase, tightening planning cycles and elevating the value of visibility in the India road freight transport industry.


By Destination: Domestic Networks Expand, Cross-Border Gains Traction
Domestic movements accounted for 63.15% of the India road freight transport market in 2025 as consumption deepened, warehousing scaled up in emerging cities, and expressways strengthened trunk connectivity for long-haul. The e-way bill and GST harmonization reduced checkpoint delays and lifted predictability on interstate moves, which improved fleet turns on major corridors. Growing e-commerce participation from Tier-2 and Tier-3 cities has accelerated demand for last-mile and short-haul deliveries, placing a premium on micro-fulfillment and intra-city route optimization. Cross-border road freight is gaining momentum on the back of diversified manufacturing and regional trade with neighboring markets and is expected to outpace domestic growth on a percentage basis in the medium term.
Ports and rail corridors are integrating with roads to strengthen export-import legs, with the commissioning of Dedicated Freight Corridors, shrinking rail transit on trunk routes, and pushing roads to dominate the first and last mile for time-bound consignments. Road remains the primary connect between factory clusters and gateways such as JNPT and Chennai, while regional distribution is migrating toward decentralized hubs closer to demand. As containerized flows increase, road operators with container yards and reefer capability will capture more value in final-mile handoffs, which supports broader growth in the India road freight transport market. With continued reforms and capital programs, domestic and cross-border segments will reinforce each other, with road capacity expansion tracking trade and consumption cycles.
By Truckload Specification: Digital Platforms and Dual-Mode Strategies
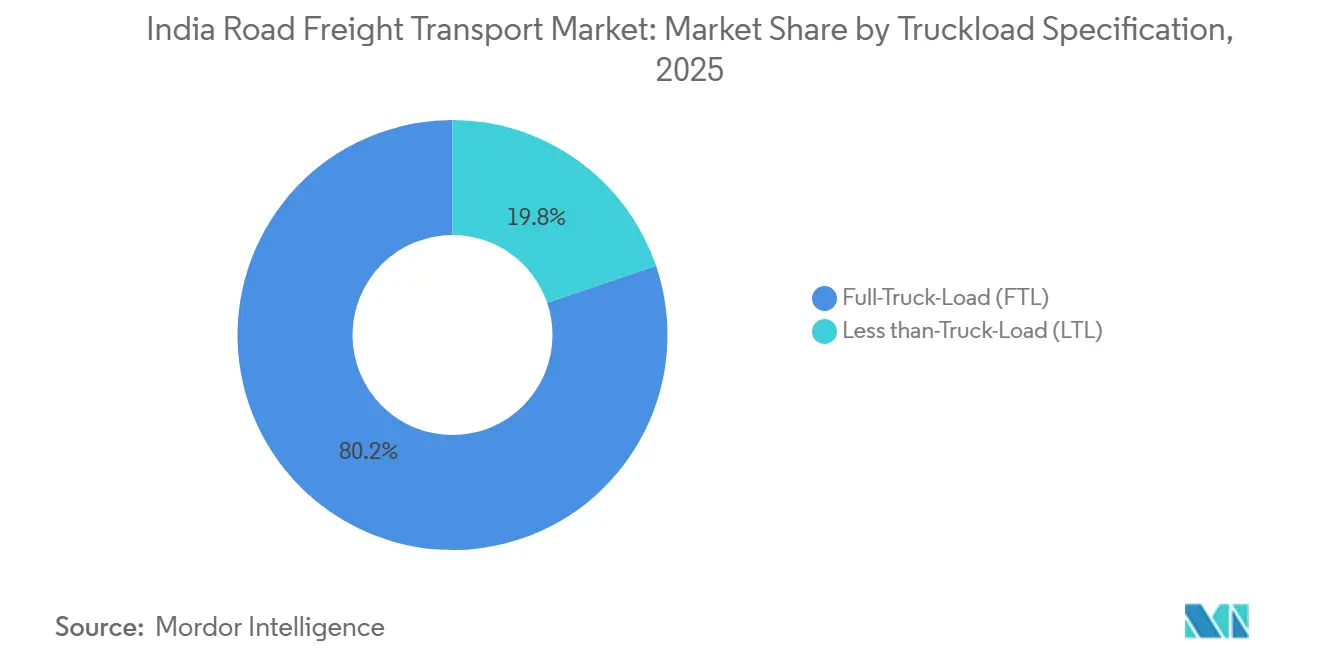
Full-truckload accounted for 80.21% of the India road freight transport market in 2025, reflecting the priority that large shippers place on dedicated capacity and direct routing on long-haul lanes. Organized FTL operators combine owned fleets, strategic transshipment hubs, and route optimization to sustain utilization and reduce empty return kilometers, which stabilizes yields in a cost-sensitive environment. Less-than-truckload, at 19.79% share in 2025, is set to grow at a 10.21% CAGR through 2031 as SMEs scale shipments, inventory disperses across secondary cities, and quick-commerce requires multi-stop routes with granular visibility. Leading PTL carriers have reported strong tonnage and revenue growth with investments in sortation, conveyorization, and cloud WMS that compress handling times and improve service consistency.
Digital freight platforms reduce empty miles by nearly 30% on busy lanes through AI-based matching and automated proof-of-delivery, a move that is especially valuable for smaller consignments, where manual steps previously caused leakage and disputes. These improvements improve PTL reliability and enable contract wins with enterprise shippers that demand scan-based visibility and predictable cutoffs. Over time, FTL will remain the backbone of long-haul while LTL captures share in short-haul and regional moves, which together sustain balanced growth in the India road freight transport market. Operators that integrate both offerings with unified visibility and billing are positioned to win more wallet share from key accounts.
By Containerization: Bulk Non-Containerized Moves Yield Ground to Intermodal Containers
Non-containerized shipments captured 86.43% of the market in 2025, led by construction materials, metals, coal, and agricultural commodities that move on open-body trucks, tippers, and tankers. As modular construction and schedule precision increase, shipment profiles are shifting toward more frequent, smaller loads, creating space for growing container use in select legs. Containerized shipments, which accounted for 13.57% in 2025, are forecast to grow at a 9.12% CAGR to 2031, supported by double-stack train capability, axle-load upgrades, and rail cost advantages on commissioned DFC sections that road operators can leverage for intermodal runs. Policy measures to localize container manufacturing strengthen availability and lifecycle economics in export-linked corridors (USD 1.2 billion).
As standardized containers spread, electronics, pharmaceuticals, and automotive components benefit from tamper resistance, improved tracking, and simpler customs processes that support reliability-sensitive supply chains. Thermal control capabilities inside containers open lanes for pharmaceuticals and perishables, where demand is growing at the fastest clip in the temperature-controlled segment. Bulk commodities will continue to prefer non-containerized formats due to cost structures and established practices, but intermodal adoption will rise as corridors stabilize schedules and reduce handoff friction in the India road freight transport market. Organized operators that invest in yards, reefer containers, and dock infrastructure will be best placed for this shift.
By Distance: Short Haul Captures Metropolitan Urgency
Long-haul operations accounted for 75.64% of the India road freight transport market in 2025, spanning the Golden Quadrilateral and newer expressways where sleeper-cabin heavy-duty trucks move inter-state volumes reliably. National highway construction has scaled over recent years, and the network reached 1,46,342 kilometers in FY 2025, improving corridor speeds, axle-load flexibility, and maintenance quality on trunk routes. Electronic tolling has minimized cash queues, increased throughput, and improved predictability, supporting better planning for linehaul dispatch and arrival. Short-haul, at 24.36% share in 2025, is set to grow at a 9.21% CAGR by 2031, led by quick commerce, last-mile e-commerce, and intra-city manufacturing chains in major metros and their suburban rings.
Hyperlocal delivery density and dark-store buildouts are compressing delivery windows, which increases the need for route optimization, frequent dispatch cycles, and lighter vehicles with tight turnarounds. Urban congestion remains a challenge, but investments in micro-fulfillment, digital proof of delivery, and IoT tracking are improving consistency for short-haul legs. As multimodal capacity rises on trunk corridors, roads will intensify their feeder roles, supporting steady gains for short-haul as metropolitan demand scales in the India road freight transport market. Operators that can synchronize linehaul arrivals with quick cross-docks onto last-mile runs will gain utilization and service advantages.
By Goods Configuration: Solid Goods Backbone Faces Fluid Goods Specialization
Solid goods accounted for 73.21% of the India road freight transport market in 2025, spanning automotive parts, packaged FMCG, textiles, construction materials, and electronics in both closed-body and container formats. Manufacturing growth in late 2025 sustained outbound and inbound flows for vehicle assembly, electronics, and equipment lines, which reinforced stable long-haul lanes to ports and major distribution centers. FMCG expansion into rural channels increased ambient freight intensity and replenishment frequency, creating a structural tailwind for multi-stop operations in regional clusters. Construction freight remains an anchor for non-containerized flows, with corridor improvements supporting heavier axle loads and less wear-related downtime.
Fluid goods held 26.79% in 2025 and are projected to grow at a 9.52% CAGR to 2031, led by petrochemicals, edible oils, and liquid fertilizers that require tankers with specialized fittings and safety certifications. Refinery and mining projects introduce seasonality and surges that test available tanker capacity during peak cycles, supporting higher rates for compliant fleets. Operators are upgrading to Bharat Stage VI-compliant tankers, adding telematics and leak detection for hazardous movements, and tightening route compliance to mitigate risk. As safety standards and client expectations rise, specialized fluid hauling will command premiums and contribute to balanced growth in the India road freight transport market.
By Temperature Control: Cold Chain Infrastructure Gaps Limit Growth
Non-temperature-controlled shipments accounted for 94.09% of the India road freight transport market in 2025, covering automotive, construction, textiles, and ambient FMCG, which dominate volume on national corridors. Ambient lanes favor lower capex and simpler operating models, which remain attractive to small-fleet owners, who constitute the majority of capacity. Temperature-controlled freight, at 5.91% in 2025, is the fastest-growing at a 9.72% CAGR through 2031, driven by pharmaceutical mandates, perishable exports, frozen food retail, and premium FMCG in rural markets. Post-pandemic, reefer fleets have adopted IoT-based temperature monitoring and redundancy to ensure compliance with 2-to-8-degree temperature ranges for high-value consignments.
Investments continue in cold storage and reefer capacity, including additional space in strategic locations to serve pharma, dairy, and perishables, enhancing coverage and reducing spoilage. The growth of premium FMCG in rural areas increases demand for last-mile refrigeration in non-metro areas where grid reliability is inconsistent, underscoring the importance of route planning and reliable power backup. While capex intensity deters many small fleet owners, organized operators that can scale reefer assets and demonstrate compliance will capture a growing share of high-value lanes in the India road freight transport market. Over time, technology-enabled temperature logging and route optimization should further reduce wastage and improve load factors for cold-chain shipments.
Geography Analysis
Western and southern corridors led overall volumes in 2025, as the highway network reached 1,46,342 kilometers, with 10,660 kilometers constructed during the year, reinforcing long-haul reliability and asset productivity on key routes. Dedicated Freight Corridor commissioning on the western axis reduced rail transit times on trunk lines, enabling road operators to specialize in the first and last mile, where on-time performance and flexibility matter most. Warehousing footprints reached 610 million square feet in 2025, with Tier-1 metros accounting for the majority and Tier-2-plus cities capturing meaningful net absorption, aligning inventory with rising demand outside core metros. Southern India is on a fast-growth trajectory through 2031, with technology, e-commerce, automotive, electronics, and pharmaceuticals forming multi-node ecosystems that rely on temperature-controlled and ambient capacity tied to ports and airports.
Northern India anchors FMCG and agricultural movements but faces driver shortages and congestion in the National Capital Region, which pushes up first- and last-mile costs and compresses delivery windows. Eastern India benefits from dedicated rail capacity and road investments, yet still grapples with inconsistent state-level maintenance that adds wear and transit variance for operators. North-eastern states remain underserved by organized logistics due to terrain and seasonal disruptions, though funding programs continue to improve access for agricultural and allied sectors where specialized handling can unlock export potential. As multimodal options expand and data platforms integrate, freight operators gain lane-level insights into restrictions, accident-prone areas, and congestion, enhancing planning and safety across regional networks.
Policy direction aims to deepen corridor connectivity and add new rail and waterway options, which should reduce congestion on trunk roads and allow the road to further intensify its comparative advantage in flexibility and time-definite delivery. Tier-2 and Tier-3 cities such as Indore, Jaipur, Lucknow, Coimbatore, and Nagpur are becoming logistics destinations as operators seek lower costs and closer proximity to consumers, which helps shorten lead times and reduce stockouts as e-commerce and 3PL absorption rise. With the India road freight transport market overlapping these growth corridors, regional capacity will continue to rebalance toward nodes where warehousing stock is scaling, and road-rail interfaces are improving. Over the forecast window, the interplay between western gateway corridors and southern factory clusters will remain central to lane planning and contract design.
Competitive Landscape
The India road freight transport market remains fragmented by fleet ownership. VRL Logistics reported higher profitability in FY 2024-25, supported by freight rate rationalization, bulk fuel procurement, and strategic property acquisitions that lower recurring rent, signaling the benefits of vertical integration and operating leverage. Delhivery’s December 2025 quarter saw net profit growth of 58.4% year on year and revenue expansion, with its Part Truck Load business crossing the 500,000 metric tonne mark for the first time, which underscores scaling network density and process stability. Digital freight marketplaces continue to cut empty miles with AI matching and integrated payments, although brokerage networks and small-fleet preferences slow platform penetration at scale.
Strategic moves have focused on capacity, automation, and multimodal alignment. Allcargo Logistics secured National Company Law Tribunal approval in 2025 to demerge its international business and streamline domestic operations, improving strategic focus and capital allocation for its road-express and contract logistics units. Major OEMs launched next-generation trucks across diesel and electric platforms in early 2026, adding advanced safety and driver-assist features that can mitigate safety risks and improve fuel efficiency for fleet owners who upgrade. Cold-chain players have expanded warehousing and reefer assets at strategic nodes to serve pharmaceuticals, dairy, and perishables, reflecting the fastest-growing sub-segment within temperature-controlled freight.
Investments in telematics, preventive maintenance, and ERP-led visibility are now table stakes for bidding large enterprise contracts, and organized players are building dashboards to track carbon intensity as ESG requirements extend into supplier networks. The interplay of long-haul FTL and regional LTL within a single network is a differentiator for contract wins, especially when clients need scan-based visibility across touchpoints. Battery-electric trucks and innovative logistics modalities are emerging in pilots, including heavy-duty use cases and early intermodal handoffs, pointing to future lanes where operating costs and emissions can be lowered as policy and infrastructure mature. In this context, the Indian road freight transport market should reward operators that align fleet modernization with disciplined pricing, controlled working capital, and technology-enabled service differentiation.
India Road Freight Transport Industry Leaders
A.P. Moller-Maersk
Allcargo Logistics (including Gati Express)
CJ Darcl Logistics Limited
Delhivery Ltd.
DHL Group
- *Disclaimer: Major Players sorted in no particular order

Recent Industry Developments
- February 2026: Delhivery reported a 58.4% year-on-year rise in net profit to INR 39.6 crore and an 18% revenue increase to Rs. 2,804 crore for the December 2025 quarter, while its Part Truck Load business surpassed 500,000 metric tons with 23% volume growth.
- January 2026: Tata Motors launched 17 next-generation trucks across the 7- to 55-ton range, including expanded electric options under the Tata Trucks brand. EV and updates to Prima, Signa, and Ultra platforms with adaptive safety features.
- December 2025: Transport Corporation of India added 1.5 lakh square feet of cold-chain capacity at Taj Nagar, Gurugram, strengthening temperature-controlled infrastructure for pharma, dairy, and perishables.
- October 2025: BillionE and Hindalco deployed 10 heavy-duty electric trucks along a 160-kilometer industrial corridor in Gujarat, with plans to add 5 more within 3 months.


India Road Freight Transport Market Report Scope
Agriculture, Fishing, and Forestry, Construction, Manufacturing, Oil and Gas, Mining and Quarrying, Wholesale and Retail Trade, Others are covered as segments by End User Industry. Domestic, International are covered as segments by Destination. Full-Truck-Load (FTL), Less than-Truck-Load (LTL) are covered as segments by Truckload Specification. Containerized, Non-Containerized are covered as segments by Containerization. Long Haul, Short Haul are covered as segments by Distance. Fluid Goods, Solid Goods are covered as segments by Goods Configuration. Non-Temperature Controlled, Temperature Controlled are covered as segments by Temperature Control.
End User Industry
| Agriculture, Fishing, and Forestry |
| Construction |
| Manufacturing |
| Oil and Gas, Mining and Quarrying |
| Wholesale and Retail Trade |
| Others |
Destination
| Domestic |
| International |
Truckload Specification
| Full-Truck-Load (FTL) |
| Less than-Truck-Load (LTL) |
Containerization
| Containerized |
| Non-Containerized |
Distance
| Long Haul |
| Short Haul |
Goods Configuration
| Fluid Goods |
| Solid Goods |
Temperature Control
| Non-Temperature Controlled |
| Temperature Controlled |
| End User Industry | Agriculture, Fishing, and Forestry |
| Construction | |
| Manufacturing | |
| Oil and Gas, Mining and Quarrying | |
| Wholesale and Retail Trade | |
| Others | |
| Destination | Domestic |
| International | |
| Truckload Specification | Full-Truck-Load (FTL) |
| Less than-Truck-Load (LTL) | |
| Containerization | Containerized |
| Non-Containerized | |
| Distance | Long Haul |
| Short Haul | |
| Goods Configuration | Fluid Goods |
| Solid Goods | |
| Temperature Control | Non-Temperature Controlled |
| Temperature Controlled |


Market Definition
- Agriculture, Fishing, and Forestry (AFF) - This end user industry segment captures the external (outsourced) logistics expenditure incurred by the AFF industry players on road freight transport service. The end user players considered are the establishments primarily engaged in growing crops, raising animals, harvesting timber, harvesting fish & other animals from their natural habitats and providing related support activities. Herein, across the value chain, Logistics Service Providers (LSPs) play a crucial role in acquisition, storage, handling, transportation, and distribution activities for the optimal & continuous flow of inputs (seeds, pesticides, fertilizers, equipment, and water) from manufacturers or suppliers to the producers and smooth flow of output (produce, agro-goods) to distributors/ consumers. This includes both termperature controlled and non-temperature controlled logistics, as and when required according to the shelf life of goods being transported or stored.
- Construction - This end user industry segment captures the external (outsourced) logistics expenditure incurred by the construction industry players, on road freight transport service. The end user players considered are the establishments primarily engaged in constructing, repairing and renovating residential & commercial buildings, infrastructure, engineering works, subdividing and developing land. Logistics Service Providers (LSPs) play a crucial role in increasing profitability of construction projects by maintaing the inventory of raw materials & equipment, time-critical supplies and by providing other value added services for effective project management.
- Containerized Road Freight Transport - The segment captures the external (outsourced) logistics expenditure incurred by the road freight transport service end users on Full-Truck-Load (FTL) services. FTL road freight transport is characterized as a full single load not combined with other shipments. It comprises of shipments (i) devoted to the goods of a single shipper (ii) taken directly from a point of origin to one or more destination points (iii) comprising of bulk mail truck transportation (iv) comprising of both Container (Full Container Load, FCL)/Non-Container trucking services (v)comprsing of goods requiring temperature controlled or non-temperature controlled transportation services (vi) comprising of bulk liquid tankering (vii) invoving trucking of waste (viii) hazardous material trucking. Related value added services (VAS) of sorting, consolidation, deconslidation are included in the other services segment of freight and logistics market.
- Export Trends and Import Trends - Overall logistics performance of an economy is positively and significantly (statistically) correlated to its trade performance (exports and imports). Hence, in this industry trend, total value of trade, major commodities/ commodity groups and the major trade partners, for the studied geography (country or region as per the scope of report) have been analysed alongside the impact of major trade/logistics infrastructure investments & regulatory environment.
- Fluid Goods - The segment captures the external (outsourced) logistics expenditure incurred by the road freight transport service end users for the transport of bulk liquids, that are often used in extraction, manufacturing, food processing, agriculture industries among others. It includes transportation of liquids like (i) Chemicals/ hazardous goods (for instance acids) (ii) Water (potable as well as waste) (iii) Oil and gas (upstream as well as downstream like gasoline, fuel, crude oil, or propane), (iv) Food grade bulk liquids (like milk, or juice), (v) Rubber, (vi) Agrichemical products, among others. These goods are generally transported through tanker trucking.
- Fuel Price - Fuel price spikes can cause delays and diruption for logistics service providers (LSPs), while drops in the same can result in higher short-term profitability and increased market rivalry to offer consumers with the best deals. Hence, the fuel price variations have been studied over the review period and presented along with the causes as well as market impacts.
- Full-Truck-Load (FTL) Road Freight Transport - The segment captures the external (outsourced) logistics expenditure incurred by the road freight transport service end users on Full-Truck-Load (FTL) services. FTL road freight transport is characterized as a full single load not combined with other shipments. It comprises of shipments (i) devoted to the goods of a single shipper (ii) taken directly from a point of origin to one or more destination points (iii) comprising of bulk mail truck transportation (iv) comprising of both Container (Full Container Load, FCL)/Non-Container trucking services (v)comprsing of goods requiring temperature controlled or non-temperature controlled transportation services (vi) comprising of bulk liquid tankering (vii) invoving trucking of waste (viii) hazardous material trucking. Related value added services (VAS) of sorting, consolidation, deconslidation are included in the other services segment of freight and logistics market.
- GDP Distribution by Economic Activity - Nominal Gross Domestic Product and distribution of the same, across major economic sectors in the geography studied (country or region as per scope of the report) have been studied and presented in this industry trend. As GDP is positively related to the profitability and growth of logistics industry, this data has been used in adjunction to the input-output tables/ supply-use tables for analyzing the potential major contributing sectors towards the logistics demand.
- GDP Growth by Economic Activity - Growth of Nominal Gross Domestic Product across major economic sectors, for the geography studied (country or region as per scope of the report) have been presented in this industry trend. This data has been utilized for assessing the growth of logistics demand from all the market end users (economic sectors considered here).
- Inflation - Variations in both Wholesale Price Inflation (YoY change in producer price index) and Consumer Price Inflation have been presented in this industry trend. This data has been used to assess the inflationary environment as it plays a vital role in smooth functioning of the supply chain, directly impacting the logistics operational cost components e.g., pricing of tyres, driver wages & benefits, energy/fuel prices, maintenace costs, toll charges, warehousing rents, custom brokerage, forwarding rates, courier rates etc. hence impacting the overall freight and logistics market.
- Key Industry Trends - The report section named "Key Industry Trends" include all the key variables/parameters studied to better analyze the market size estimates and forecasts. All the trends have been presented in the form of data points (time series or latest available data points) along with analysis of the paramter in the form of concise market relevant commentary, for the geography studied (country or region as per the scope of report).
- Key Strategic Moves - The action taken by a company to differentiate from its competitor or used as a general strategy is referred to as a key strategic move (KSM). This includes (1) Agreements (2) Expansions (3) Financial Restructuring (4) Mergers and Acquisitions (5) Partnerships, and (6) Product Innovations. Key players (Logistics Service Providers, LSPs) in the market have been shortlisted, their KSM have been studied and presented in this section.
- Less than-Truck-Load (LTL) Road Freight Transport - The segment captures the external (outsourced) logistics expenditure incurred by the road freight transport service end users on Less than-Truck-Load (LTL) services. LTL road freight transport is characterized as multiple shipments combined onto a single truck for multiple deliveries within a network. It comprises of establishments (i) primarily engaged in general and specialized freight trucking of less than complete truck-loads, (ii) characterized by the use of terminals to consolidate shipments, generally from several shippers, into a single truck for haulage between a load assembly terminal and a disassembly terminal, where the load is sorted and shipments are re-routed for delivery (iv) Less than-Container-Load (LCL) shipping/ Groupage Shipping in case of trucking services. The activities in scope include (i) local pick-up, (ii) line-haul, and (iii) local delivery. Related value added services (VAS) of sorting, consolidation, deconslidation are included in the other services segment of freight and logistics market.
- Logistics Performance - Logistics Performance and Logistics Costs are the backbone of trade, and influences trade costs, making countries compete globally. Logistics performance is influenced by market wide adopted supply chain management strategies, government services, investments & policies, fuel/ energy costs, inflationary environment etc. Hence, in this industry trend, the logistics performance of the geography studied (country/ region as per the scope of report) has been analysed and presented over the review period.
- Major Truck Suppliers - Market share of truck brands is influenced by factors like geographical preferences, portfolio of truck types, truck prices, local production, truck repair & maintenance service peneteration, customer support, technological innovations (like electric vehicles, digitalization, autonomous trucks), fuel efficiency, financing options, annual maintenance costs, availability of substitutes, marketing startegies etc. Hence, the distribution (share % for base year of the study) of truck sales volume for leading truck brands and commentary on current market scenario & market anticipation over the forecast period have been presented in this industry trend.
- Manufacturing - This end user industry segment captures the external (outsourced) logistics expenditure incurred by the Manufacturing industry players, on road freight transport service. The end user players considered are the establishments primarily engaged in the chemical, mechanical or physical transformation of materials or substances into new products. Logistics Service Providers (LSPs) play a crucial role in maintaining a smooth flow of raw materials across the supply chain, enabling timely delivery of finished goods to distributors or end customers and storing & supplying the raw materials to clients for just-in-time manufacturing.
- Modal Share - Freight Modal Share is influenced by factors like modal productivity, government regulations, containerization, distance of shipment, temperature control requirements, type of goods, international trade, terrain, speed of delivery, shipment weight, bulk shipments, etc. Also, modal share by tonnage (tons) and modal share by freight turnover (ton-km) differ as per average distance of shipments, weight of major commodity groups transported in the economy and number of trips. This industry trend represents the distribution of freight transported by mode of transport (tons as well as ton-km), for the study base year.
- Oil and Gas, Mining and Quarrying - This end user industry segment captures the external (outsourced) logistics expenditure incurred by the extraction industry players, on road freight transport service. The end user players considered are the establishments that extract naturally occurring mineral solids, such as coal and ores; liquid minerals, such as crude petroleum; and gases, such as natural gas. Logistics Service Providers (LSPs) covers entire phases from upstream to downstream and plays a crucial role in the transportation of machinery, drilling equipments, extracted minerals, crude oil & natural gas and refined/ processed products from one place to another.
- Other End Users - Other end user segment captures the external (outsourced) logistics expenditure incurred by the financial services (BFSI), real estate, educational services, healthcare, and professional services (administrative, waste management, legal, architectural, engineering, design, consulting, scientific R&D), on road freight transport service. Logistics Service Providers (LSPs) plays a crucial role in the reliable movement of supplies and documents to/from these industries such as transporting any equipment or resources required, shipping confidential documents and files, movement of medical goods & supplies (surgical supplies and instruments, including gloves, masks, syringes, equipment) to name a few.
- Producer Price Inflation - It indicates inflation from viewpoint of the producers viz. the average selling price received for their output over a period of time. Annual change (YoY) of producer price index is reported as wholesale price inflation in the "Inflation" industry trend. As WPI captures dynamic price movements in most comprehensive way, it is widely used by governments, banks, industry, business circles and is deemed important in formulation of trade, fiscal and other economic policies. The data has been used in adjunction to consumer price inflation for better understanding the inflationary environment.
- Road Freight Pricing Trends - Freight pricing by mode of transport (USD/tonkm), over the review period, has been presented in this industry trend. The data has been used in assessing the inflationary environment, impact on trade, freight turnover (tonkm), road freight transport market demand and hence the road freight transport market size.
- Road Freight Tonnage Trends - Freight tonnage (weight of goods in tons) handled by mode of transport, over the review period, has been presented in this industry trend. The data has been used as one of the parameters apart from average distance per shipment (km), freight volume (tonkm), and freight pricing (USD/tonkm) to assess the freight transport market size.
- Road Freight Transport - Hiring a road freight transport logistics service provider (LSP) or haulier (outsourced logistics), for the transport of commodities constitutes road freight transport market. The scope of study includes (i) road transport of goods reported by hauliers registered in the reporting countries (ii) transport of raw materials or manufactured goods (solids as well as fluids) (iii) transport using commerical motor vehicles (rigid trucks or tractor-trailers, (iv) Full-Truck-Load (FTL) or Less than-Truck-Load (LTL) transport (v) containerized or non-containerized transport (vi) temperature controlled or non-temperature controlled trasnport, (vii) short haul or long haul (Over-the-road, OTR) transport, (viii) used office or household goods transport (movers and packers), (ix) other specialized cargo transport (dangerous goods, oversized cargo) and (x) outsourced first mile/ middle mile/last mile delivery shipments undertaken by road freight transport players. The scope does not include (i) transport undertaken by hauliers registered in other countries (ii) last mile meal delivery market (iii) grocery delivery market (iv) transportation via road network undertaken/ reported by Courier, Express, and Parcel (CEP) players.
- Road Length - As infrastructure plays a vital role in an economy's logistics performance, variables like length of roads, distribution of road length by surface category (paved v/s unpaved), distribution of road length by road classification (expressways v/s highways v/s other roads), have been analysed and presented in this industry trend.
- Segmental Revenue - Segmental Revenue has been triangulated or computed and presented for all the major players in the market. It refers to the road freight transport market specific revenue earned by the company, over the base year of study, in the geography studied (country or region as per the scope of report). It is computed through the study and analysis of major parameters like financials, service portfolio, employee strength, fleet size, investments, number of countries present in, major economies of concern, etc. that have been reported by the company in its annual reports, webpage. For companies having scarce financial disclosures, paid databases like D&B Hoovers, Dow Jones Factiva have been resorted to and verified through industry/expert interactions.
- Short Haul Road Freight Transport - The segment captures the external (outsourced) logistics expenditure incurred by the road freight transport service end users on local trucking (less than 100 miles). It includes the road transport of goods (i) within a single administrative area and its hinterland, (ii) by smaller trucks and pickup trucks (iii) via containerized as well as dry bulk services (iv) intermodal from ports, container terminals or airports, and (v) outsourced first mile/ last mile delivery shipments undertaken by road freight transport players.
- Transport and Storage Sector GDP - Value and growth of Transport and Storage Sector GDP has a direct relation to the freight and logistics market size, and hence road freight transport market size. Therefore, this variable has been studied and presented over the review period, in value terms (USD) and as share % of total GDP, in this industry trend. The data has been supported by concise and relevant commentary around the investments, developments, and current market scenario.
- Trends in E-Commerce Industry - Enhanced internet connectivity and boom in smartphone penetration, coupled with increasing disposable incomes, has led to a phenomenal growth in the e-commerce market globally. Online shoppers require fast and efficient delivery of their orders leading to an increase in the demand for logistics services especially e-commerce fulfilment services. Hence, the Gross Merchandise Value (GMV), historial and projected growth, breakup of major commodity groups in e-commerce industry for the studied geography (country or region as per scope of the report) have been analysed and presented in this industry trend.
- Trends in Manufacturing Industry - Manufacturing industry involves the transformation of raw materials into finished products, while logistics industry ensures the efficient flow of raw materials to the factory, and the transport of manufactured products to the distributors & consumers. Demand-Supply of both industries are highly cross-linked and critical for a seamless supply chain. Hence, the Gross Value Added (GVA), breakup of GVA into major manufacturing sectors, and growth of manufacturing industry over the review period have been analysed and presented, in this industry trend.
- Trucking Fleet Size By Type - Market share of truck types is influenced by factors like geographical preferences, major end user industries, truck prices, local production, truck repair & maintenance service peneteration, customer support, technological disruptions (like electric vehicles, digitalization, autonomous trucks) etc. Hence, the distribution (share % for base year of study) of truck parc volume by type of truck, market disruptors, truck manufacturing investments, truck specifications, truck use & import regulations, and market anticipation over the forecast period have been presented in this industry trend.
- Trucking Operational Costs - The prime reasons for measuring/ benchmarking logistics performance of any trucking company are to reduce operational costs and increase profitability. On the other hand, measuring operational costs helps to identify whether and where to make operational changes to control expenses and identify areas for improved performance. Hence, in this industry trend, trucking operational costs and the variables involved viz. driver wages & benefits, fuel prices, repairs & maintenance costs, tyre costs etc. have been studied over the base year of study, and presented for the geography studied (country or region as per the scope of report).
- Wholesale and Retail Trade - This end user industry segment captures the external (outsourced) logistics expenditure incurred by the wholesalers and retailers, on road freight transport service. The end user players considered are the establishments primarily engaged in wholesaling or retailing merchandise, generally without transformation, and rendering services incidental to the sale of merchandise. Logistics Service Providers (LSPs) plays a crucial role in the reliable movement of supplies to and finished products from production houses to the distributors and finally to the end customer covering activites like material sourcing, transportation, order fulfillment, warehousing & storage, demand forecasting, inventory management etc.
| Keyword | Definition |
|---|---|
| Cabotage | Road transport by a motor vehicle registered in a country performed on the national territory of another country. |
| Cross Docking | Cross docking is a logistics procedure where products from a supplier or manufacturing plant are distributed directly to a customer or retail chain with marginal to no handling or storage time. Cross docking takes place in a distribution docking terminal; usually consisting of trucks and dock doors on two (inbound and outbound) sides with minimal storage space. The name ‘cross docking’ explains the process of receiving products through an inbound dock and then transferring them across the dock to the outbound transportation dock. |
| Cross Trade | International road transport between two different countries performed by a road motor vehicle registered in a third country. A third country is a country other than the country of loading/embarkation and than the country of unloading/disembarkation. |
| Dangerous Goods | The classes of dangerous goods carried by Road are those defined by the fifteenth revised edition of the UN Recommendations on the Transport of Dangerous Goods, United Nations, Geneva 2007. They include Class 1: Explosives; Class 2: Gases; Class 3: Flammable Liquids; Class 4: Flammable solids- substances liable to spontaneous combustion; substances which, on contact with water, emit flammable gases; Class 5: Oxidizing substances and organic peroxides; Class 6: Toxic and infectious substances; Class 7: Radioactive material and Class 8: Corrosive substances, Class 9: Miscellaneous dangerous substances and articles. |
| Direct Shipment | Direct shipment is a method of delivering goods from the supplier or the product owner to the customer directly. In most cases, the customer orders the goods from the product owner. This delivery scheme reduces transportation and storage costs, but requires additional planning and administration. |
| Drayage | A drayage is a form of trucking service that connects the different modes of shipping (intermodal), such as ocean freight or air freight. It’s a short-haul trip that transports goods from one place to another, usually before or after its long-haul shipping process. Drayage trucks move cargo to and from various destinations, such as container ships, storage lots, order fulfillment warehouses, and rail yards. Typically, drayage only transports goods in short distances and operates only in one metropolitan area. It also requires only one trucker in a single shift. But despite this, but it plays an important role in long-haul shipping because it gets the goods to the cargo and vice versa. It makes intermodal transport much more efficient and enables the seamless transfer of goods to the end customer. |
| Dry van | A dry van is a type of semi-trailer that's fully enclosed to protect shipments from outside elements. Designed to carry palletized, boxed or loose freight, dry vans aren't temperature-controlled (unlike refrigerated “reefer” units) and can't carry oversized shipments (unlike flatbed trailers). |
| Final Demand | Final demand includes all types of commodities (goods as well as services) consumed as final use and might include personal consumption, or consumption by government, by businesses as capital investment, and as exports. includes all types of commodities (goods as well as services) consumed as final use and might include personal consumption, or consumption by government, by businesses as capital investment, and as exports. |
| Flatbed Truck | A flatbed truck is a type of truck with rigid design. It has a back body that is flatly shaped for easy loading and unloading of goods. The flatbed truck is mostly used to transport heavy, oversized, wide and indelicate goods such as machinery, building supplies or equipment. Due to the truck open body, the goods transported with it must not be vulnerable to rain. By functionality, the flatbed truck is comparable to a flatbed trailer. |
| Inbound Logistics | Inbound logistics is the way materials and other goods are brought into a company. This process includes the steps to order, receive, store, transport and manage incoming supplies. Inbound logistics focuses on the supply part of the supply-demand equation. |
| Intermediate Demand | Intermediate demand includes goods, services, and maintenance and repair construction sold to businesses, excluding capital investment. |
| International Loaded | Place of loading of goods in reporting country (i.e., country in which the vehicle performing the transport is registered) and place of unloading in a different country. |
| International Unloaded | Place of unloading of goods in reporting country (i.e., country in which the vehicle performing the transport is registered) and place of loading in a different country. |
| OOG cargo | Out of Gauge (OOG) cargo is any cargo that can not be loaded into six-sided shipping containers simply because it is too large. The term is a very loose classification of all cargo with dimensions beyond the maximum 40HC container dimensions. That is a length beyond 12.05 meters – a width beyond 2.33 meters – or a height beyond 2.59 meters. |
| Pallets | Raised platform, intended to facilitate the lifting and stacking of goods. |
| Part load | A part load describes goods which only fills a truck partially. In essence, the quantity of the shipment is bigger than the Less Than Truckload (LTL) shipment. Also, the shipment cannot fully occupy a truck i.e. its capacity is much lower than a Full Truckload (FTL) shipment. |
| Paved Road | Road surfaced with crushed stone (macadam) with hydrocarbon binder or bituminized agents, with concrete or with cobblestone. |
| Reverse Logistics | Reverse logistics comprises of the sector of supply chains that process anything returning inwards through the supply chain or traveling ‘backward’ through the supply chain. |
| Road Freight Transport Service | Hiring a trucking agency for transport of commodities (raw materials or manufactured goods including both solids and liquids) form the origin to a destination within the country (domestic) or cross-border (international) constitutes road freight transport market. The service might be Full-Truck-Load or Less than-Truck-Load, containerized or non-containerized, temperature controlled or non temperature controlled, short haul or long haul. |
| Tautliner vehicle | Tautliner and curtainsider are used as generic names for curtain sided trucks/trailers. The curtains are permanently fixed to a runner at the top and detachable rails/poles at front and rear, allowing the curtains to be drawn open and forklifts used all along the sides for easy and efficient loading and unloading. When closed for travel, vertical load restraint straps are attached to a rope rail beneath the truck bed, connecting the truck bed and curtain along both sides. Winches at either end of the curtain tension it, hence the 'Tautliner' name. This stops the curtain from flapping or drumming in the wind and can also help retain light loads from slipping sideways. |
| Transport for hire or reward | The carriage for remuneration of goods. |
| Unpaved Road | Road with a stabilized base not surfaced with crushed stone, hydrocarbon binder or bituminized agents, concrete or cobblestone. |


Research Methodology
Mordor Intelligence follows a four-step methodology in all our reports.
- Step-1: Identify Key Variables: In order to build a robust forecasting methodology, the variables and factors identified in Step-1 are tested against available historical market numbers. Through an iterative process, the variables required for market forecast are set and the model is built on the basis of these variables.
- Step-2: Build a Market Model: Market-size estimations for the forecast years are in nominal terms. Inflation is considered to be a part of the pricing, and the average selling price (ASP) is varying throughout the forecast period for each country
- Step-3: Validate and Finalize: In this important step, all market numbers, variables and analyst calls are validated through an extensive network of primary research experts from the market studied. The respondents are selected across levels and functions to generate a holistic picture of the market studied.
- Step-4: Research Outputs: Syndicated Reports, Custom Consulting Assignments, Databases & Subscription Platforms


