India Biocontrol Agents Market Size and Share
Market Overview
| Study Period | 2018 - 2031 |
|---|---|
| Forecast Data Period | 2026 - 2031 |
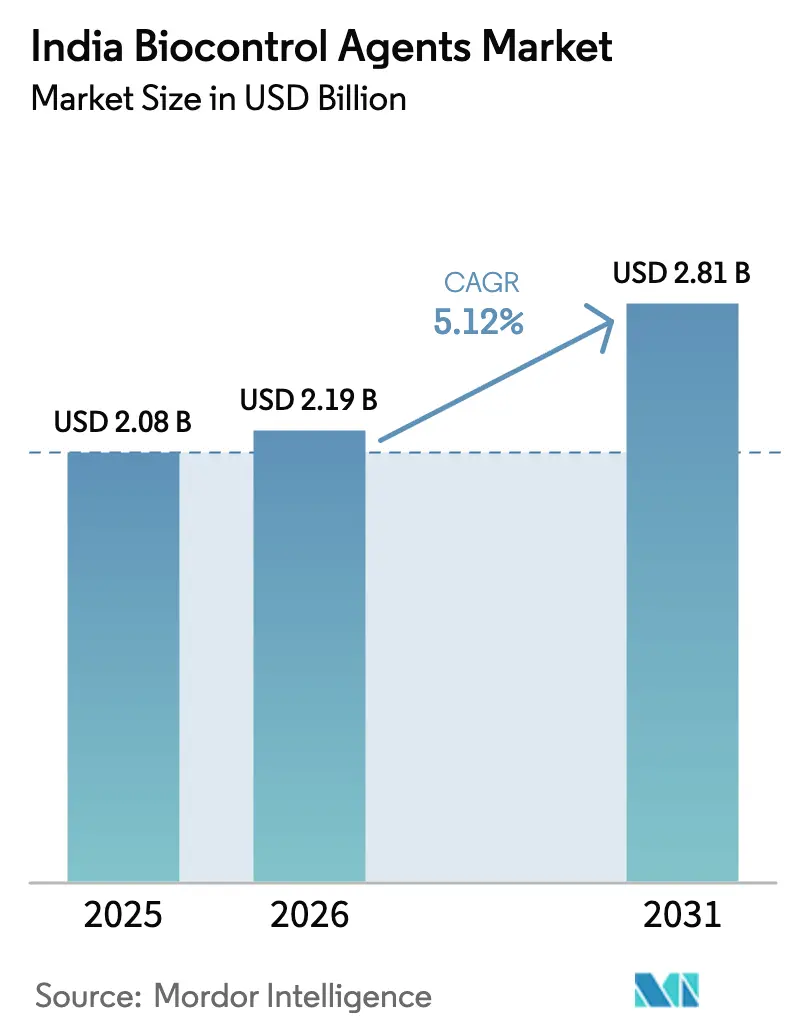
| Base Year Market Size (2025) | USD 2.08 Billion |
| Market Size (2026) | USD 2.19 Billion |
| Market Size (2031) | USD 2.81 Billion |
| Growth Rate (2026 - 2031) | 5.12% CAGR |
| Market Concentration | Low |
Major Players *Disclaimer: Major Players sorted in no particular order Image © Mordor Intelligence. Reuse requires attribution under CC BY 4.0. | |
India Biocontrol Agents Market Analysis by Mordor Intelligence
The India biocontrol agents market size is expected to grow from USD 2.08 billion in 2025 to USD 2.19 billion in 2026 and is forecast to reach USD 2.81 billion by 2031 at 5.12% CAGR over 2026-2031. India’s BioE3 Policy 2024 allocates substantial biotechnology funding, while the National Programme for Organic Production streamlines residue-free export certification, together boosting near-term demand for biological crop protection. The government’s target of increasing organic exports in the coming years channels capital into biocontrol research and extension, and the rising resistance of pests to synthetic products shifts farmer purchasing toward macrolides and microbials. The rapid scale-up of drone-compatible formulations reduces labor costs by up to 50%, enhancing value perceptions among large growers. Meanwhile, carbon-credit monetization for biologically protected farms creates a fresh income layer that reinforces adoption, and fragmented competition opens consolidation opportunities for players that combine R&D strength with state-level distribution reach.
Key Report Takeaways
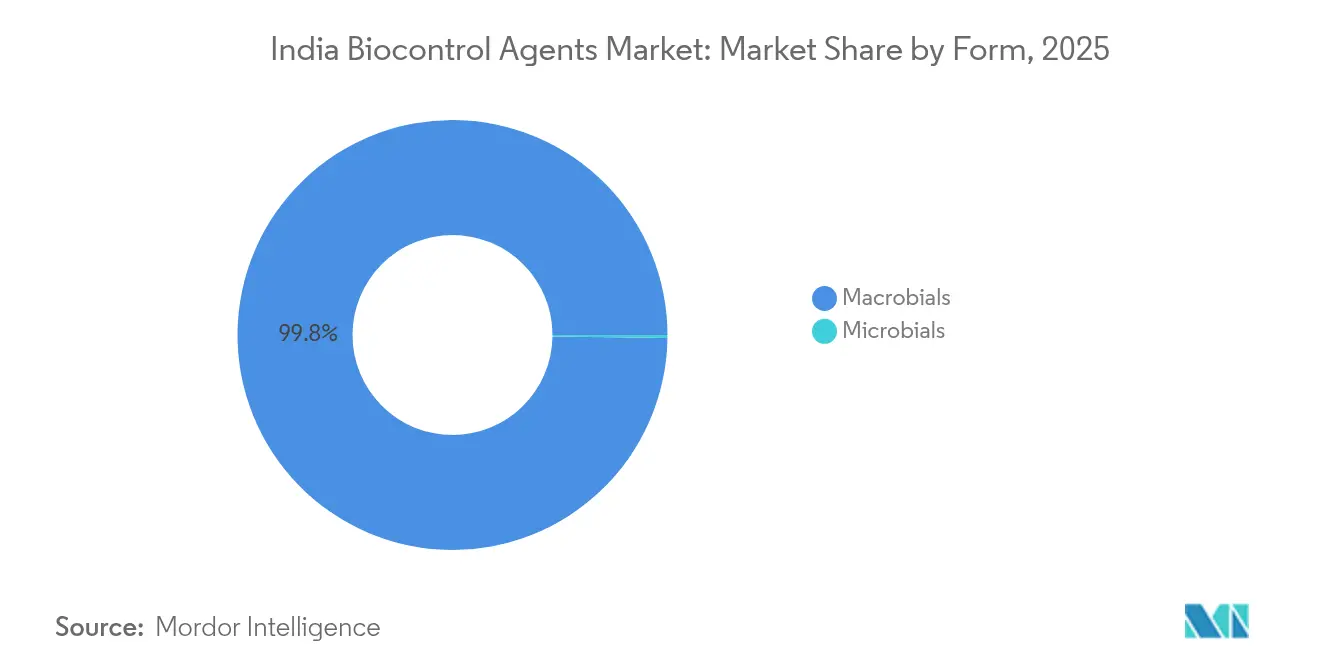
- By form, macrobials commanded 99.78% of India biocontrol agents market share in 2025 and are growing in line with the overall 5.12% CAGR to 2031.
- By crop type, row crops accounted for 87.65% of India biocontrol agents market size in 2025, while the same segment is advancing at a 5.19% CAGR through 2031.
Note: Market size and forecast figures in this report are generated using Mordor Intelligence’s proprietary estimation framework, updated with the latest available data and insights as of 2026.
India Biocontrol Agents Market Trends and Insights
Drivers Impact Analysis*
| Driver | ( ~ ) % Impact on CAGR Forecast | Geographic Relevance | Impact Timeline |
|---|---|---|---|
| Government push for residue-free crop exports | +1.2% | National, with early gains in Maharashtra, Gujarat, Karnataka | Medium term (2-4 years) |
| Rising farmer adoption of organic certification programs | +0.8% | National, concentrated in horticultural belts | Long term (≥ 4 years) |
| Price premiums for chemical-free horticultural produce | +0.7% | National, premium markets in urban centers | Short term (≤ 2 years) |
| Growing resistance to synthetic pesticides in cash crops | +0.9% | Cotton belt states, sugarcane regions | Medium term (2-4 years) |
| Emergence of drone-compatible biocontrol formulations | +0.6% | Progressive farming states, large farm holdings | Medium term (2-4 years) |
| Carbon-credit monetization for biologically protected farms | +0.4% | National, early adoption in corporate farming | Long term (≥ 4 years) |
| Source: Mordor Intelligence | |||
Government Push for Residue-Free Crop Exports
India’s export competitiveness rests on meeting strict maximum residue limits set by major importers, especially the European Union’s Farm-to-Fork strategy that aims for 50% pesticide reduction by 2030.[1]Source: APEDA, “Organic Export Procedures,” apeda.gov.in The revised National Programme for Organic Production simplifies export documentation and mandates biocontrol use for high-value crops destined for premium markets. Producers benefit from Production Linked Incentive rebates of 4%-6% linked to organic export volumes, prompting rapid uptake of macrobials for cotton, grape, and spice shipments. State clusters in Maharashtra and Gujarat record 25%-40% higher farm-gate prices for residue-free crops, reinforcing positive farmer economics. The India biocontrol agents market gains additional momentum because exporters face immediate losses if chemical residues exceed allowable limits. As export clusters demonstrate reliable demand, agribusinesses sign forward contracts that guarantee biological input procurement for the next five seasons.
Rising Farmer Adoption of Organic Certification Programs
The National Mission for Sustainable Agriculture advances cluster-based organic certification that lowers individual farmer fees and integrates technical support.[2]Source: Ministry of Agriculture and Farmers Welfare, “Integrated Pest Management Guidelines,” agricoop.nic.in Paramparagat Krishi Vikas Yojana provides INR 50,000 (USD 600) per hectare over three years to fund the transition toward biological crop protection, driving steady consumption of microbial and macrobial formulations. Farmer Producer Organizations aggregate thousands of small holders, making bulk purchases of India biocontrol agents market products and negotiating uniform application protocols. Demonstration plots established by Regional Councils of Agricultural Research report 20%-30% yield improvements in organic tomato fields after two seasons.
Price Premiums for Chemical-Free Horticultural Produce
Urban consumers pay 30%-50% more for certified organic fruits and vegetables, and e-commerce platforms note 40%-60% annual growth in organic segments. Supermarket chains and quick-commerce apps feature dedicated organic aisles, helping growers recoup higher input costs of biocontrol. Corporate buyers such as ITC Limited and Godrej Consumer mandate organic sourcing for new product lines, effectively guaranteeing offtake for FPOs using macrobials. The India biocontrol agents market, therefore, rides strong retail branding that highlights “chemical-free” provenance, sustaining higher wholesale prices even during gluts. Direct farm-to-consumer models shrink supply-chain time, offsetting the shorter shelf life of biological produce. As premium margins stabilize, more horticulture growers shift away from synthetic pesticides to qualify for certification-driven price rewards.
Growing Resistance to Synthetic Pesticides in Cash Crops
Multiple insecticide classes have lost efficacy against bollworm in cotton across Maharashtra, Gujarat, and Telangana, forcing a switch to biological solutions.[3]Source: Central Institute for Cotton Research, “Pest Resistance Studies,” cicr.org.in The Central Institute for Cotton Research confirms that 70% of surveyed fields exhibit significant resistance, and yield declines reach 25% despite heavier chemical application. Entomopathogenic nematodes and parasitoids provide alternative modes of action and have demonstrated 60% mortality rates against resistant populations, spurring involuntary adoption. Sugarcane borer control through nematodes reduces chemical costs by 20% and drives faster payback for growers supplying feedstock to ethanol plants. State agriculture departments now include biological protocols in official integrated pest management (IPM) guides, adding an institutional layer to demand.
Restraints Impact Analysis*
| Restraint | (~) % Impact on CAGR Forecast | Geographic Relevance | Impact Timeline |
|---|---|---|---|
| Shorter shelf-life versus chemicals | -0.8% | National, acute in remote areas | Short term (≤ 2 years) |
| Fragmented last-mile cold-chain logistics | -0.6% | Rural areas, tier-2/3 cities | Medium term (2-4 years) |
| Limited field efficacy data for Indian climatic zones | -0.5% | Regional variations across agro-climatic zones | Medium term (2-4 years) |
| Regulatory delays for novel microbial strains | -0.7% | National, affecting innovation pipeline | Long term (≥ 4 years) |
| Source: Mordor Intelligence | |||
Shorter Shelf Life Versus Chemicals
Most microbial products remain viable for only 6-18 months, compared with 2-3 years for conventional pesticides, complicating inventory management in India’s fragmented agri-retail network. Distributors face higher working capital and faster stock rotation, while rural power outages of 8-12 hours daily harm microbial viability. Alginate encapsulation extends longevity to 12-24 months but raises production cost by 15%-20%. Adoption remains limited to high-value crops where the premium can absorb higher prices. For monsoon-season storage, losses of 10%-15% persist, constraining near-term growth of the India biocontrol agents market.
Fragmented Last-Mile Cold-Chain Logistics
Cold storage covers less than 4% of agricultural produce, leaving most retail outlets without refrigerated space. Over 100,000 micro-distributors cannot justify dedicated reefers, and cooperative solutions are patchy. Government grants under the Pradhan Mantri Kisan Sampada Yojana focus mainly on food processing rather than input supply, slowing logistic upgrades. Monsoon floods and poor rural roads cause transport delays that expose macrobials to heat stress, lowering field performance. Manufacturers, therefore, concentrate sales in peri-urban belts, leaving remote growers underserved and slowing national penetration.
*Our forecasts treat driver/restraint impacts as directional, not additive. The impact forecasts reflect baseline growth, mix effects, and variable interactions.
Segment Analysis
By Form: Macrobials Maintain Dominance while Microbials Accelerate
Macrobials accounted for 99.78% of India biocontrol agents market size in 2025 due to the established field performance of entomopathogenic nematodes and parasitoids, and they are forecast to grow in tandem with the overall 5.12% CAGR to 2031. Entomopathogenic nematodes such as Heterorhabditis indica deliver up to 70% efficacy in cotton bollworm control, creating strong repeat demand across the Deccan Plateau. Parasitoids, including Trichogramma species, see rapid uptake in horticulture where growers need precision targeting to protect beneficial insects. Predators like Amblyseius swirskii gain traction inside polyhouses, although higher costs limit broad-acreage adoption.
The microbials niche remains small yet shows the fastest expansion inside the India biocontrol agents market, lifted by R&D on Bacillus thuringiensis, Pseudomonas fluorescens, and Trichoderma species. Drone-compatible wettable granules reduce labor barriers, and encapsulation extends shelf life, making sub-12-month viability less of an issue. CIBRC (Central Insecticides Board and Registration Committee) mandates ensure standardized potency that builds dealer trust and paves the way for microbials to capture incremental share. As multinationals partner with Indian start-ups, fermentation capacity investments rise, signaling a stronger future supply.


By Crop Type: Row Crops Lead but Horticulture Races Ahead
Row crops held 87.65% of India biocontrol agents market share in 2025, anchored by cotton and sugarcane, where resistance crises drive forced adoption. In cotton, macrobials cut bollworm damage by up to 65% when combined with pheromone traps, saving farmers USD 45 per hectare in chemical bills. Sugarcane growers targeting the national ethanol program adopt nematode treatments that trim borer incidence and raise cane weight, supporting a 5.19% CAGR through 2031 for the segment.
Horticultural crops post the highest incremental growth in the India biocontrol agents market as residue-free grapes, mangoes, and vegetables secure export and domestic premiums. Grape exporters in Maharashtra deploy parasitoids and Bt sprays to satisfy European maximum residue limits, and mango producers swap broad-spectrum chemicals for Chrysoperla releases that curb mealybugs while preserving pollinators. Urban consumers pay higher retail prices, which offset the cost of biological inputs, creating a clear economic case and widening geographic penetration beyond traditional horticulture belts.

Geography Analysis
Maharashtra leads the India biocontrol agents market by value because its large cotton, grape, and vegetable acreage overlaps with rigorous export compliance programs. The Agricultural Technology Management Agency operates hundreds of demo farms that validate macrobial efficacy, giving local distributors compelling evidence and shortening the sales cycle. Gujarat follows closely as cotton-centric districts like Rajkot adopt IPM protocols mandated by the state agriculture department, while arid conditions demand nematodes that tolerate intermittent irrigation.
Karnataka’s diversified portfolio covering coffee, spices, and horticulture adds multi-crop pull for microbial and macrobial solutions. Robust biotechnology clusters in Bengaluru house formulation laboratories that speed innovation. Northern states such as Punjab and Haryana use biologicals selectively in basmati rice and greenhouse vegetables destined for New Delhi’s premium retail chains. Adoption scales patiently due to entrenched chemical habits. Eastern states, including West Bengal, begin trials in rice and shrimp aquaculture, but infrastructural gaps slow broad deployment.
Southern India acts as the research and manufacturing hub for the India biocontrol agents market. Tamil Nadu Agricultural University and local start-ups co-develop region-specific strains, and proximity to ports simplifies raw-material import and finished-product export. Andhra Pradesh’s horticulture expansion, especially in chillies and mangoes, taps drone spraying services that cut labor costs and enhance macrobial coverage. Coordination with CIBRC’s Chennai office speeds regulatory interactions, providing a marginal timeline edge over northern applicants.
Competitive Landscape
The India biocontrol agents market is highly fragmented, with the top five companies collectively controlling a very low percentage of total sales, leaving ample headroom for consolidation. Local companies, including T Stanes and Company Limited, Sonkul Agro Industries, and KN Bio Sciences India Pvt Ltd, differentiate through region-specific product lines and extensive dealer training. Koppert Biological Systems and BASF SE leverage their global portfolios, but the need for cold-chain integrity limits their deep rural penetration.
Strategic play increasingly centers on vertical integration and technology. T Stanes invests in in-house fermentation and field advisory platforms, while UPL Ltd pilots drone application services bundled with microbial sales. Start-ups backed by public incubators at the Center for Cellular and Molecular Platforms focus on encapsulation tech that addresses shelf-life constraints. Patent filings for novel strains increased by 40% in 2024, indicating a rise in IP intensity. Players who are able to clear CIBRC hurdles the fastest and secure drone-compatible registrations gain an early mover advantage.
Partnership activity intensifies. Godrej Agrovet and Provivi Inc. co-develop pheromone-based cotton solutions that slash chemical use by up to 80%. Crystal Crop Protection offers hybrid chemical-biological packs to ease growers through the transition phase. These moves signal that established pesticide firms view biologicals as core to long-run portfolios, encouraging further M&A and joint ventures.
India Biocontrol Agents Industry Leaders
Koppert B.V.
T. Stanes and Company Limited
Samriddhi Crops India Pvt Ltd.
Andermatt Group AG
Sonkul Agro Industries
- *Disclaimer: Major Players sorted in no particular order


Recent Industry Developments
- July 2025: PAU (Punjab Agricultural University) introduced Trichoderma asperellum 2% WP to manage foot rot in basmati rice caused by Fusarium moniliforme. This biocontrol agent enhances crop health and minimizes mycotoxin risks, promoting sustainable rice farming in Punjab.
- February 2025: PI Industries Ltd. and C-CAMP (Centre for Cellular and Molecular Platforms) announced a collaboration in 2025 to accelerate innovation in biocontrol technologies. The partnership aims to develop and commercialize biological alternatives to synthetic pesticides, supporting sustainable agriculture and expanding India’s biocontrol product pipeline.
- November 2024: In 2024, Provivi partnered with Godrej Agrovet to introduce pheromone-based biocontrol solutions for Indian farmers. These environmentally friendly products are designed to manage pests such as the Yellow Stem Borer and Fall Armyworm in rice and corn cultivation.


India Biocontrol Agents Market Report Scope
Macrobials, Microbials are covered as segments by Form. Cash Crops, Horticultural Crops, Row Crops are covered as segments by Crop Type.| Macrobials | By Organism | Entamopathogenic Nematodes |
| Parasitoids | ||
| Predators | ||
| Microbials | By Organism | Bacterial Biocontrol Agents |
| Fungal Biocontrol Agents | ||
| Other Microbials |
| Cash Crops |
| Horticultural Crops |
| Row Crops |
| Form | Macrobials | By Organism | Entamopathogenic Nematodes |
| Parasitoids | |||
| Predators | |||
| Microbials | By Organism | Bacterial Biocontrol Agents | |
| Fungal Biocontrol Agents | |||
| Other Microbials | |||
| Crop Type | Cash Crops | ||
| Horticultural Crops | |||
| Row Crops | |||


Market Definition
- AVERAGE DOSAGE RATE - The average application rate is the average volume of biocontrol agents applied per hectare of farmland in the respective region/country.
- CROP TYPE - Crop type includes Row crops (Cereals, Pulses, Oilseeds), Horticultural Crops (Fruits and vegetables) and Cash Crops (Plantation Crops, Fibre Crops and Other Industrial Crops)
- FUNCTION - The Crop Protection function of agirucultural biological include products that prevent or control various biotic and abiotic stress.
- TYPE - Biocontrol agents are the natural predators and parasitoids used to control various pests. Biocontrol agents include both microbials (Microorganisms) and macrobials (Insects).
| Keyword | Definition |
|---|---|
| Cash Crops | Cash crops are non-consumable crops sold as a whole or part of the crop to manufacture end-products to make a profit. |
| Integrated Pest Management (IPM) | IPM is an environment-friendly and sustainable approach to control pests in various crops. It involves a combination of methods, including biological controls, cultural practices, and selective use of pesticides. |
| Bacterial biocontrol agents | Bacteria used to control pests and diseases in crops. They work by producing toxins harmful to the target pests or competing with them for nutrients and space in the growing environment. Some examples of commonly used bacterial biocontrol agents include Bacillus thuringiensis (Bt), Pseudomonas fluorescens, and Streptomyces spp. |
| Plant Protection Product (PPP) | A plant protection product is a formulation applied to crops to protect from pests, such as weeds, diseases, or insects. They contain one or more active substances with other co-formulants such as solvents, carriers, inert material, wetting agents or adjuvants formulated to give optimum product efficacy. |
| Pathogen | A pathogen is an organism causing disease to its host, with the severity of the disease symptoms. |
| Parasitoids | Parasitoids are insects that lay their eggs on or within the host insect, with their larvae feeding on the host insect. In agriculture, parasitoids can be used as a form of biological pest control, as they help to control pest damage to crops and decrease the need for chemical pesticides. |
| Entomopathogenic Nematodes (EPN) | Entomopathogenic nematodes are parasitic roundworms that infect and kill pests by releasing bacteria from their gut. Entomopathogenic nematodes are a form of biocontrol agents used in agriculture. |
| Vesicular-arbuscular mycorrhiza (VAM) | VAM fungi are mycorrhizal species of fungus. They live in the roots of different higher-order plants. They develop a symbiotic relationship with the plants in the roots of these plants. |
| Fungal biocontrol agents | Fungal biocontrol agents are the beneficial fungi that control plant pests and diseases. They are an alternative to chemical pesticides. They infect and kill the pests or compete with pathogenic fungi for nutrients and space. |
| Biofertilizers | Biofertilizers contain beneficial microorganisms that enhance soil fertility and promote plant growth. |
| Biopesticides | Biopesticides are natural/bio-based compounds used to manage agricultural pests using specific biological effects. |
| Predators | Predators in agriculture are the organisms that feed on pests and help control pest damage to the crops. Some common predator species used in agriculture include ladybugs, lacewings, and predatory mites. |
| Biocontrol agents | Biocontrol agents are living organisms used to control pests and diseases in agriculture. They are alternatives to chemical pesticides and are known for their lesser impact on the environment and human health. |
| Organic Fertilizers | Organic fertilizer is composed of animal or vegetable matter used alone or in combination with one or more non-synthetically derived elements or compounds used for soil fertility and plant growth. |
| Protein hydrolysates (PHs) | Protein hydrolysate-based biostimulants contain free amino acids, oligopeptides, and polypeptides produced by enzymatic or chemical hydrolysis of proteins, primarily from vegetal or animal sources. |
| Biostimulants/Plant Growth Regulators (PGR) | Biostimulants/Plant Growth Regulators (PGR) are substances derived from natural resources to enhance plant growth and health by stimulating plant processes (metabolism). |
| Soil Amendments | Soil Amendments are substances applied to soil that improve soil health, such as soil fertility and soil structure. |
| Seaweed Extract | Seaweed extracts are rich in micro and macronutrients, proteins, polysaccharides, polyphenols, phytohormones, and osmolytes. These substances boost seed germination and crop establishment, total plant growth and productivity. |
| Compounds related to biocontrol and/or promoting growth (CRBPG) | Compounds related to biocontrol or promoting growth (CRBPG) are the ability of a bacteria to produce compounds for phytopathogen biocontrol and plant growth promotion. |
| Symbiotic Nitrogen-Fixing Bacteria | Symbiotic nitrogen-fixing bacteria such as Rhizobium obtain food and shelter from the host, and in return, they help by providing fixed nitrogen to the plants. |
| Nitrogen Fixation | Nitrogen fixation is a chemical process in soil which converts molecular nitrogen into ammonia or related nitrogenous compounds. |
| ARS (Agricultural Research Service) | ARS is the U.S. Department of Agriculture's chief scientific in-house research agency. It aims to find solutions to agricultural problems faced by the farmers in the country. |
| Phytosanitary Regulations | Phytosanitary regulations imposed by the respective government bodies check or prohibit the importation and marketing of certain insects, plant species, or products of these plants to prevent the introduction or spread of new plant pests or pathogens. |
| Ectomycorrhizae (ECM) | Ectomycorrhiza (ECM) is a symbiotic interaction of fungi with the feeder roots of higher plants in which both the plant and the fungi benefit through the association for survival. |


Research Methodology
Mordor Intelligence follows a four-step methodology in all our reports.
- Step-1: Identify Key Variables: In order to build a robust forecasting methodology, the variables and factors identified in Step-1 are tested against available historical market numbers. Through an iterative process, the variables required for market forecast are set and the model is built on the basis of these variables.
- Step-2: Build a Market Model: Market-size estimations for the forecast years are in nominal terms. Inflation is not a part of the pricing, and the average selling price (ASP) is kept constant throughout the forecast period.
- Step-3: Validate and Finalize: In this important step, all market numbers, variables and analyst calls are validated through an extensive network of primary research experts from the market studied. The respondents are selected across levels and functions to generate a holistic picture of the market studied.
- Step-4: Research Outputs: Syndicated Reports, Custom Consulting Assignments, Databases & Subscription Platforms.


