
Magnetite Nanoparticles Market Size and Share
Market Overview
| Study Period | 2020 - 2031 |
|---|---|
| Market Size (2026) | USD 94.46 Billion |
| Market Size (2031) | USD 149.44 Billion |
| Growth Rate (2026 - 2031) | 9.62 % |
| Fastest Growing Market | Asia-Pacific |
| Largest Market | Asia Pacific |
| Market Concentration | Medium |
Major Players *Disclaimer: Major Players sorted in no particular order Image © Mordor Intelligence. Reuse requires attribution under CC BY 4.0. | |
Magnetite Nanoparticles Market Analysis by Mordor Intelligence
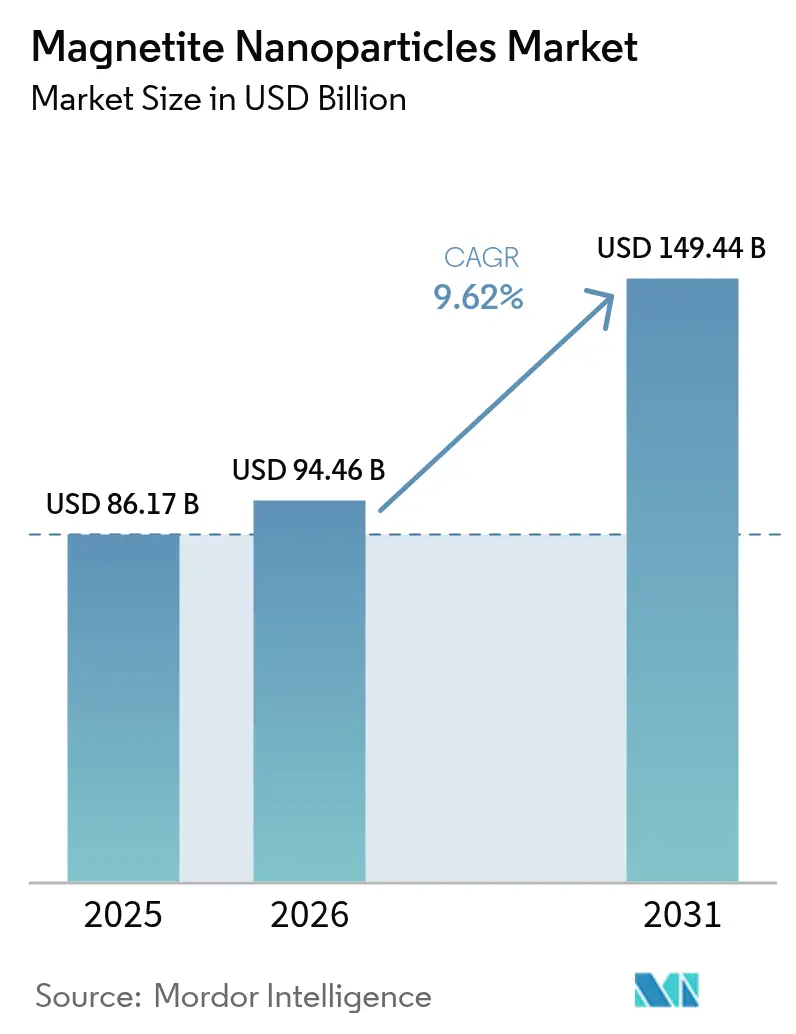
The Magnetite Nanoparticles Market size was valued at USD 86.17 billion in 2025 and estimated to grow from USD 94.46 billion in 2026 to reach USD 149.44 billion by 2031, at a CAGR of 9.62% during the forecast period (2026-2031). The shift from basic magnetic powders to engineered nanomaterials underpins this momentum as researchers exploit superparamagnetism for precision in biomedical, environmental, and energy use cases. Intensifying investment in nanotechnology, rising regulatory pressure for greener processes, and a widening application base across healthcare imaging, wastewater treatment, and green hydrogen catalysis further reinforce demand. Asia-Pacific’s manufacturing capacity accelerates scale economies, while continual improvements in synthesis control expand addressable opportunities in data storage, additive-manufacturing composites, and targeted therapeutics. Together these elements position the magnetite nanoparticles market for steady double-digit growth over the forecast horizon.
Key Report Takeaways
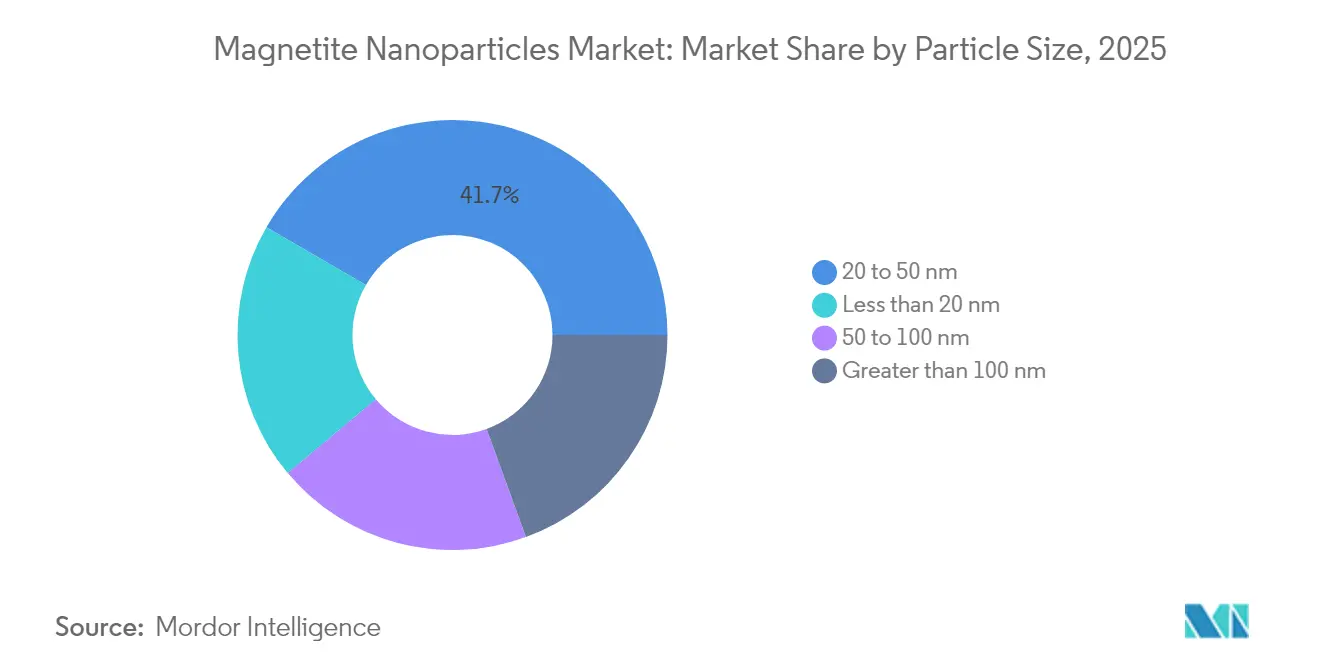
- By particle size, the 20-50 nm category commanded 41.65% of the magnetite nanoparticles market share in 2025, whereas sub-20 nm particles are set to expand at a 12.61% CAGR to 2031.
- By synthesis method, co-precipitation captured 46.78% share in 2025, yet sol-gel techniques lead growth at 11.98% CAGR.
- By surface coating, polymer variants held 32.41% share in 2025, while gold-coated grades post the fastest 13.02% CAGR.
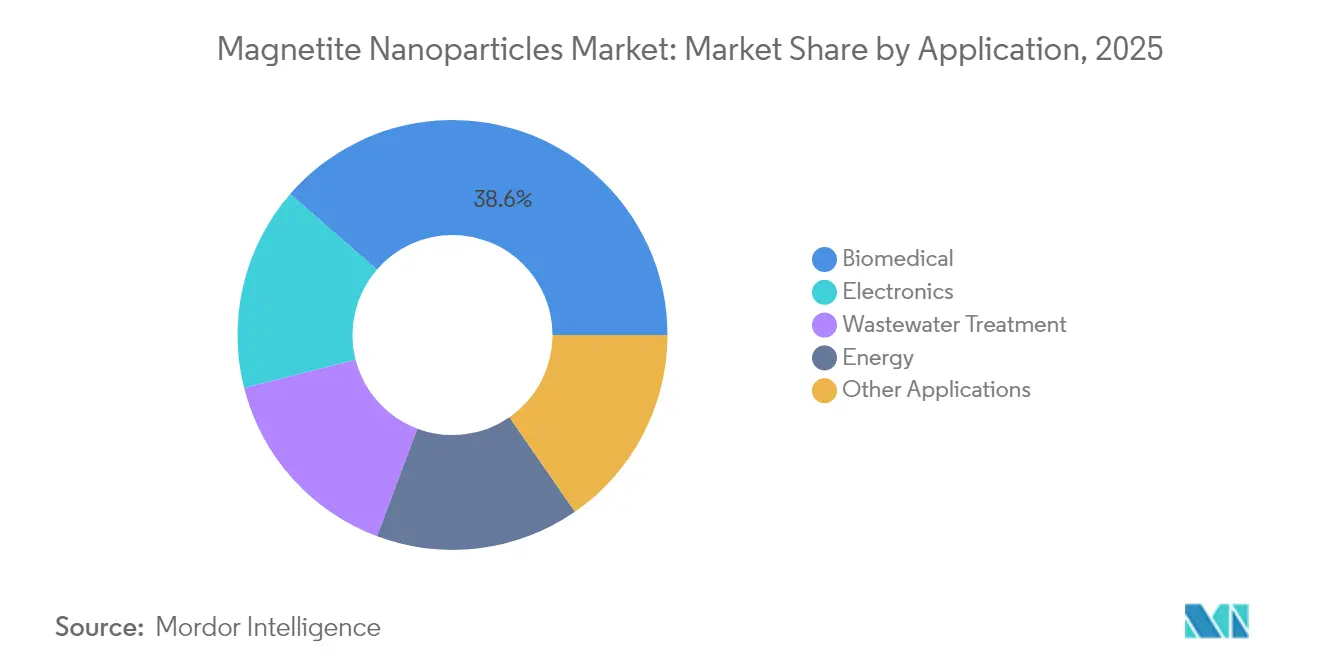
- By application, biomedical solutions led with 38.62% revenue share in 2025; energy applications are projected to grow at a 12.18% CAGR through 2031.
- By geography, Asia-Pacific accounted for 44.35% of the magnetite nanoparticles market size in 2025 and retains the highest 11.75% CAGR to 2031.
Note: Market size and forecast figures in this report are generated using Mordor Intelligence’s proprietary estimation framework, updated with the latest available data and insights as of 2026.
Market Trends and Insights
Drivers Impact Analysis of Magnetite Nanoparticles Market*
| Driver | (~) % Impact on CAGR Forecast | Geographic Relevance | Impact Timeline |
|---|---|---|---|
| Rising demand from electronics industry | +2.1% | Asia-Pacific core, spill-over to North America | Medium term (2-4 years) |
| Growing use in wastewater treatment | +1.8% | Global, with early gains in Europe and North America | Short term (≤ 2 years) |
| Expansion of biomedical applications | +2.4% | North America & EU, expanding to Asia-Pacific | Long term (≥ 4 years) |
| Adoption in additive-manufacturing composites | +1.2% | North America & EU manufacturing hubs | Medium term (2-4 years) |
| Catalytic role in green-ammonia and hydrogen value chains | +1.9% | Global, with concentration in industrial regions | Long term (≥ 4 years) |
| Source: Mordor Intelligence | |||
Rising Demand from Electronics Industry
Superparamagnetism at the nanoscale grants reversible magnetization without energy loss, a trait prized for high-density data storage devices[1]. Magnetite-based inks now enable flexible sensors and soft-robotic actuators that respond to modest magnetic fields, meeting miniaturization goals in consumer electronics. Tunable particle size and surface chemistry allow designers to replace some rare-earth magnets, aligning with sustainability imperatives. Laboratory studies show precisely engineered domains boosting switching speed, a prerequisite for neuromorphic chips. As fabrication lines in Asia widen production, unit costs decline, unlocking broader adoption in next-generation electronics.
Growing Use in Wastewater Treatment
Stringent discharge rules spur utilities to deploy magnetite nanoparticle adsorbents that remove heavy metals, dyes, and microplastics at ≥90% efficiency while enabling magnetic separation and catalyst re-use[2]. Functionalized surfaces now target pharmaceutical residues, helping plants comply with emerging micropollutant limits. Cities favor the technology’s circular profile because recovered particles can be regenerated multiple times, lowering sludge volumes. Industrial players integrate magnetite composites with biochar to elevate adsorption capacity in dye-rich textile effluent. European pilot plants validate operational savings relative to activated carbon, catalyzing a pipeline of municipal upgrades.
Expansion of Biomedical Applications
In oncology, externally guided magnetite nanoparticles deliver chemotherapeutics directly to tumors, cutting systemic exposure. Magnetic hyperthermia trials show complete tumor ablation in murine models at 63% photothermal conversion efficiency. Surface ligands now ferry particles across the blood-brain barrier, presenting new options for glioblastoma and Parkinson therapies. Regulatory familiarity is strengthening, evidenced by a growing pipeline of Investigational New Drug applications in the United States. Premium pricing and clear clinical benefit sustain the biomedical segment’s outsized revenue contribution to the magnetite nanoparticles market.
Adoption in Additive-Manufacturing Composites
Embedding magnetite nanoparticles into 3D-printing resins yields lightweight lattices with electromagnetic shielding and thermal management features. Aerospace suppliers leverage gradient printing to tailor magnetic properties along part geometries, reducing component count. In automotive electronics housings, magnetite enhances heat dissipation without expensive metal inserts. Programmable composites permit post-print tuning: a brief field exposure can re-orient particle chains, altering stiffness or conductivity. As industrial printers add multi-material capabilities, demand for magnetically responsive feedstocks rises, adding incremental volume to the magnetite nanoparticles market.
Restraints Impact Analysis of Magnetite Nanoparticles Market*
| Restraint | (~) % Impact on CAGR Forecast | Geographic Relevance | Impact Timeline |
|---|---|---|---|
| Raw-material price volatility | -1.4% | Global, with acute impact in cost-sensitive applications | Short term (≤ 2 years) |
| Industrial-scale size-uniformity challenges | -2.1% | Manufacturing regions, particularly Asia-Pacific | Medium term (2-4 years) |
| Competition from high-performance ferrite substitutes | -1.8% | Advanced applications in North America & EU | Long term (≥ 4 years) |
| Source: Mordor Intelligence | |||
Raw-Material Price Volatility
Magnetite feedstock prices track the wider iron ore cycle, exposing producers to swings that erode margins when long-term contracts lack indexation. Australia, holder of 40% of global magnetite resources, forecasts export receipts to soften in FY 2025-26, limiting negotiating leverage for nanoparticle users. Producers adopt hedging and recycling scrap flows, but capital budgets for expansion tighten during downturns. Volatility complicates tender bids in government-funded environmental projects where fixed-price guarantees prevail. Greater vertical integration into captive ore assets could cushion shocks yet requires large up-front investment.
Industrial-Scale Size-Uniformity Challenges
Uniform particle diameters below ±5 nm are essential for reproducible magnetic behavior, yet batch reactors over several hundred liters struggle to maintain precise temperature and mixing profiles. Post-production sieving adds up to 20% to process costs in high-spec markets like drug delivery. Microfluidic synthesis offers lab-grade control but remains limited to kilogram-per-day throughput. Investments in in-line analytics and automated feed control mitigate lot-to-lot variation, though payback extends beyond three years at today’s prices. Until scalable precision methods mature, adoption in strict-spec electronics and biomedical niches faces supply constraints.
*Our forecasts treat driver/restraint impacts as directional, not additive. The impact forecasts reflect baseline growth, mix effects, and variable interactions.
Magnetite Nanoparticles Market Segment Analysis
By Particle Size:
Sub-20 nm Particles Drive Next-Generation ApplicationsParticles between 20 nm and 50 nm held 41.65% of 2025 volume, balancing high magnetic moment with suspension stability—ideal for separation resins and MRI tracers. Yet particles below 20 nm score the highest 12.61% CAGR as advanced therapy developers exploit their ability to cross biological membranes. Quantum size effects lower magnetocrystalline anisotropy, ensuring rapid demagnetization—essential for safe in-vivo use. Smaller diameters also boost catalytic surface area, shortening diffusion paths in hydrogen evolution. Manufacturers battle Ostwald ripening during scale-up, but pilot lines using continuous flow reactors show promise.
Particles in the 50-100 nm bracket cater to magnetocaloric cooling and bulk separations where stronger magnetization offsets settling risk. Beyond 100 nm, usage narrows to heavy-duty magnetic filters and ferrofluids in vibration dampers. Over time, process optimization and tighter statistical control are likely to tilt output toward the sub-20 nm tier, reshaping the magnetite nanoparticles market mix.

By Synthesis Method:
Sol-Gel Innovation Challenges Co-Precipitation DominanceCo-precipitation generated 46.78% of global tonnage in 2025 because it uses simple salts, ambient pressure, and affordable reactors. However, product variation across batches spurs customers to seek alternatives for high-precision needs. Sol-gel lines achieve narrow size distributions and uniform surface chemistry, stimulating a 11.98% CAGR that outpaces the wider magnetite nanoparticles market. Controlled hydrolysis inside silica matrices yields porous magnetite spheres ideal for drug loading and sustained release.
Thermal decomposition remains popular in laboratories for monodisperse seeds but its reliance on organic solvents raises cost and environmental concerns at scale. Micro-emulsion paths enable sub-10 nm particles yet suffer from surfactant removal challenges. Researchers are piloting atmospheric pressure microplasma routes that promise energy savings and tailorable crystallinity. Adoption hinges on demonstration of ton-scale throughput without losing nanoscale precision.
By Surface Coating:
Polymer Dominance Faces Gold-Coating DisruptionPolymer shells envelop 32.41% of commercial magnetite nanoparticles thanks to straightforward chemistry, low cost, and tunable functionality. Polyethylene glycol coatings confer stealth properties for intravenous delivery, while chitosan layers improve binding toward phosphates in water remediation. However, gold-coated particles register a vigorous 13.02% CAGR as clinicians prize their photothermal effect and inertness. Combining a gold mantle with a magnetite core creates dual-modality agents useful for imaging, hyperthermia, and real-time tracking, elevating price points well above polymer grades.
Silica coatings remain favored in harsh chemical processes where inertness matters, and uncoated magnetite finds a niche in bulk catalysis where post-reaction coating is economical. Innovative bilayer approaches emerge, such as polymer-grafted gold shells that marry biocompatibility with plasmonic activity, signaling deeper segmentation ahead. As functional demands grow, coating technology becomes a prime differentiator within the magnetite nanoparticles industry.
By Application:
Biomedical Dominance Drives Premium PricingThe biomedical segment accounted for 38.62% of the magnetite nanoparticles market in 2025. Hospitals adopt magnetite-based contrast agents that cut gadolinium exposure while enhancing MRI clarity. Magnetic particle imaging prototypes exploit pure superparamagnetism to avoid ionizing radiation, foreshadowing new diagnostic revenue streams. Oncology trials confirm that magnetic hyperthermia can raise intratumoral temperatures above 43 °C with minimal off-target heating, strengthening the business case for magnetite formulations. Elsewhere, cardiology researchers test embolic beads coated with magnetite to steer clot-busting enzymes directly to blocked vessels. High regulatory scrutiny inflates certification timelines, yet premium prices offset the burden, preserving segment margins above the market average.
Conversely, the energy application segment expands fastest at a 12.18% CAGR as electrolyzer builders integrate magnetite catalysts into alkaline stacks. Carbon capture pilots combine magnetite nanoparticles with amine sorbents, improving regeneration energy efficiency. Electronics and wastewater treatment post mid-single-digit gains, supported by ongoing miniaturization and tougher effluent norms. Collectively, diversified demand underpins the magnetite nanoparticles market, insulating it from shocks in any single end-use.
Geography Analysis
APAC Magnetite Nanoparticles Market
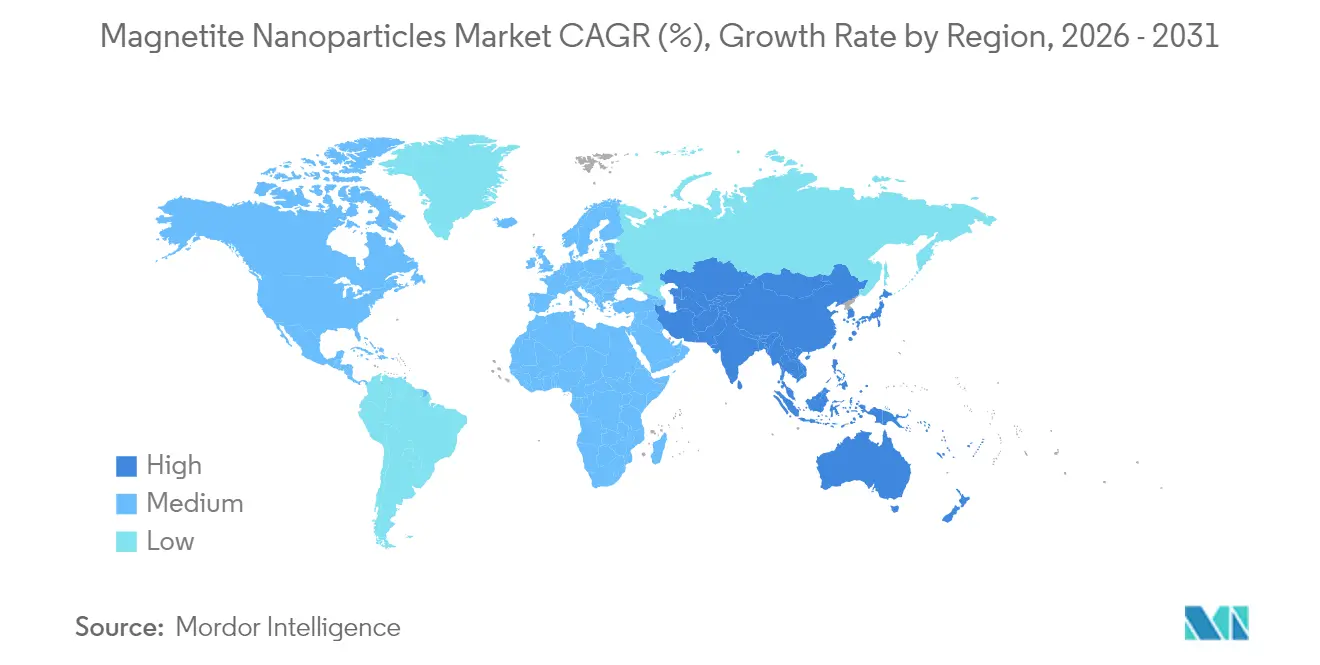
Asia-Pacific generated 44.35% of magnetite nanoparticles market revenue in 2025 and continues to grow at 11.75% CAGR as governments funnel more than USD 30 billion into nanotech R&D. China’s patent volume grants local firms bargaining power when negotiating licensing or joint-development deals with multinationals. Clusters in Shenzhen and Suzhou host integrated supply chains from precursor salts to surface-modified dispersions, trimming lead times for export customers. India and South Korea add momentum through incentives for medical-device manufacturing and semiconductor packaging, respectively.
North America Magnetite Nanoparticles Market
North America leverages deep biomedical research capacity and defense spending to sustain premium niches. The United States leads clinical translation of magnetically guided therapies, while Canada supports mining-to-nanomaterial projects that channel domestic magnetite ores into high-value downstream products. Nevertheless, higher labor costs and stricter workplace safety rules restrain mass-scale production, making the region a net importer for commodity grades.
EMEA and South America Magnetite Nanoparticles Market
Europe pursues sustainability goals, using magnetite adsorbents to meet water-quality directives and circular-economy mandates. Collaboration networks such as Horizon Europe finance pilot plants that validate magnetite catalysts in green-hydrogen schemes. Stringent REACH regulations, however, elongate certification cycles, nudging some production to contract plants in Asia before re-import as finished formulations. South America and the Middle East & Africa present early-stage opportunities as mining, oil, and agricultural sectors look for cost-effective remediation and catalytic technologies, but infrastructure and skills shortages slow uptake.
Value Chain Analysis
The value chain starts with upstream iron sources and chemical inputs, moving from magnetite ore, iron salts (such as iron chlorides), and reagents including bases for precipitation (such as sodium hydroxide) into nanoparticle synthesis, coating, and finishing. Alongside virgin precursors, emerging feedstock strategies use iron oxide-bearing steel-industry waste as a circular input, reflecting a broader shift toward greener, resource-recovery routes. Core manufacturing covers co-precipitation at scale for commodity grades and tighter-control routes (sol-gel, micro-emulsion, and increasingly continuous-flow and microfluidic processing) aimed at narrow size distributions for biomedical and electronics end users.
Midstream activity includes specialized nanomaterial suppliers (for example, American Elements) and service-heavy participants such as contract research organizations that support formulation and application development. Downstream distribution typically combines direct sales of powders and dispersions to OEMs and research buyers with application-specific supply (surface-functionalized particles for medical, water, and energy uses). Key bottlenecks remain industrial-scale size-uniformity control in large reactors, added cost from post-processing and classification for high-spec batches, and operating economics in use cases that require regeneration, notably heavy-metal adsorption. Transport and EHS considerations for bulk chemical inputs and nanoparticle handling also influence plant location and customer qualification.
Competitive Landscape
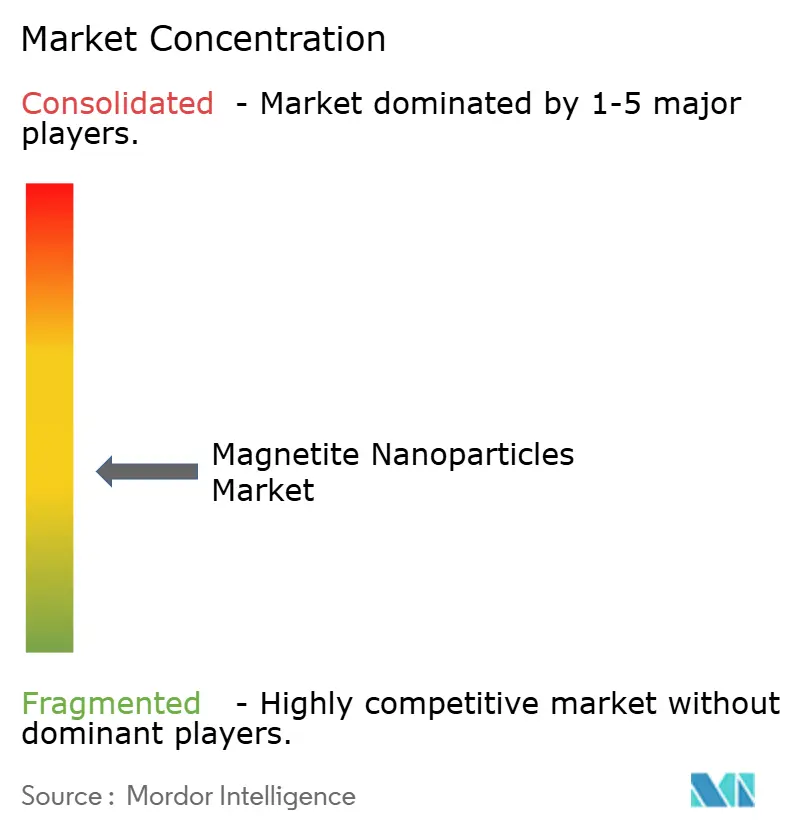
The magnetite nanoparticles market exhibits moderate fragmentation with numerous specialized suppliers competing on technical differentiation rather than scale advantages, creating opportunities for companies that can achieve consistent quality at industrial scale. American Elements markets purities up to 99.999% and tailors’ dispersions in solvents or biocompatible buffers, emphasizing batch traceability.
Vertical integration emerges as a hedge against raw-material swings, prompting players in China and Australia to secure stakes in magnetite ore bodies. Others partner with contract research organizations to co-develop surface-functionalized formulations for pharma clients, turning technical service into a revenue stream. Strategic investments trend toward automated quality-control systems and in-line particle sizing to unlock medical and electronics certifications.
Magnetite Nanoparticles Industry Leaders
-
American Elements
-
Merck KGaA
-
Thermo Fisher Scientific Inc.
-
SkySpring Nanomaterials Inc.
-
Fortis Life Sciences
- *Disclaimer: Major Players sorted in no particular order
Magnetite Nanoparticles Market Companies Covered in this Report
- American Elements
- Ascensus
- Cytodiagnostics Inc
- Fortis Life Sciences
- Imagion Biosystems, Ltd.
- Merck KGaA
- NanoComposix
- Nanoshel LLC
- NNCrystal US Corporation
- Sinosteel New Materials Co., Ltd.
- SkySpring Nanomaterials Inc.
- Thermo Fisher Scientific Inc.
- US Research Nanomaterials Inc.
Market Opportunities and Future Outlook
White space is most visible where performance requirements demand tighter control over surface chemistry, batch traceability, and size distributions, leaving room for suppliers to turn lab-grade coatings into reproducible commercial outputs. In biomedicine, published work in 2026 on amino-acid functionalization (for example, glutamic acid, glutamine, glycine, and asparagine) points to a practical approach to improve biocompatibility while adding antimicrobial and antioxidant functionality. This supports differentiated coated grades rather than commodity powders and aligns with the broader move toward engineered nanomaterials and premium pricing in biomedical applications.
Environmental applications also offer actionable areas for development. 2026 studies comparing carbon-shell magnetite adsorption across dye chemistries, along with demonstrations of green synthesis from iron filings for heavy-metal removal, emphasize optimization around contaminant selectivity, regeneration, and reagent reduction. These findings translate into opportunities for turnkey adsorbent systems (particles plus separation hardware plus regeneration workflows) and for lower-impact manufacturing approaches, including one-step electrochemical routes and resource-recovery inputs from industrial waste streams. Adjacent opportunities are forming at agri-environment interfaces, where Fe3O4-based nano-fertilizers have been presented for soil remediation and nutrient supply, but field-scale validation and ecotoxicology requirements keep the demand for materials suppliers paired with long-term performance data and safety dossiers.
Recent Industry Developments in Magnetite Nanoparticles Market
- March 2026: Researchers reported an optimized route to produce about 9 nm magnetite nanoparticles using steel-industry waste as a resource-recovery feedstock, including an indicated 1.82-year payback period for the approach. The work reinforces a manufacturing pathway that can lower dependence on virgin iron salts while aligning production with circular-economy procurement criteria in water and environmental applications.
- July 2025: Peer-reviewed studies continued to emphasize continuous-flow and microfluidic synthesis strategies for magnetite nanoparticles to improve mixing control and narrow size distributions versus batch reactors. This direction supports commercialization for strict-spec end markets, where lot-to-lot variability can delay qualification in biomedical and electronics supply chains.
- December 2024: American Elements announced an expansion of production facilities for gallium, germanium, antimony, and related compounds, explicitly including nanoparticle products, citing increased demand on inventories. The added capacity across a broader nanoparticle portfolio strengthens supply assurance for customers that source multiple nanomaterial chemistries from one vendor and rely on consistent availability for development and scale-up programs.
Magnetite Nanoparticles Market Report Scope and Research Methodology
Market Definition and Coverage
For this study, the market covers revenue generated from magnetite (Fe3O4) nanoparticles sold as a material for use in industrial and research applications, including coated and uncoated forms, across major end-use adoption areas.
Scope exclusions: We exclude micron-sized magnetite powders, bulk iron oxide pigments, and finished end products where magnetite nanoparticles are only a minor additive.
Segments Covered in This Report
- By Particle Size
- less than 20 nm
- 20–50 nm
- 50–100 nm
- greater than 100 nm
- By Synthesis Method
- Co-precipitation
- Thermal Decomposition
- Micro-emulsion
- Sol–Gel
- Others
- By Surface Coating
- Uncoated
- Polymer-coated
- Silica-coated
- Gold-coated
- Other Coatings
- By Application
- Biomedical
- Electronics
- Wastewater Treatment
- Energy
- Other Applications
- By Geography
- Asia-Pacific
- China
- India
- Japan
- South Korea
- ASEAN Countries
- Rest of Asia-Pacific
- North America
- United States
- Canada
- Mexico
- Europe
- Germany
- United Kingdom
- France
- Italy
- Spain
- NORDIC Countries
- Rest of Europe
- South America
- Brazil
- Argentina
- Rest of South America
- Middle East and Africa
- Saudi Arabia
- United Arab Emirates
- South Africa
- Rest of Middle East and Africa
- Asia-Pacific
Data Sources, Market Sizing, and Validation
Desk Research
We start by mapping where demand comes from and how the product moves across the value chain, and then we align that with what can be observed in public data. For magnetite nanoparticles, this includes scanning scientific and regulatory signals that show where the material is being adopted, along with constraints that may reduce commercialization.
Desk inputs include reputable public sources such as the USGS for minerals context, UN Comtrade for trade direction checks, the World Bank for macro indicators used in demand normalization, and the USPTO plus WIPO for patent filing trends that support application momentum. We also review peer-reviewed journals for shifts in synthesis routes and surface functionalization, plus company filings, investor presentations, and association websites to understand capacity commentary, product positioning, and pricing direction. When needed, we also refer to paid subscriptions for company financials and intelligence, news and financials, and patent databases to cross-check scale and activity. These examples are illustrative only, and the desk research source list is not exhaustive because many other references were used for data collection, validation, and clarification.
Primary Interviews and Surveys
To close gaps left by public data, we run expert interviews and structured surveys across material producers, distributors, application-focused formulators, and downstream users in biomedical, electronics, water treatment, and energy use cases. Respondent input helps sanity check adoption rates, typical price bands by coating and particle size, and how qualification cycles differ by region, before we lock the assumptions.
Distribution of primary research fieldwork respondents
| Company type | Respondent position | Region |
|---|---|---|
| Top tier: 37% | CXOs: 13% | APAC: 50% |
| Mid tier: 47% | Functional/Unit leaders: 42% | EMEA: 31% |
| Smaller Players: 16% | Managers: 45% | Americas: 19% |
Market-Sizing & Forecasting
The model is built using a top-down demand-pool reconstruction that ties magnetite nanoparticle consumption to application-driven output indicators and adoption rates, and then converts those volumes into value using price ranges validated in interviews. We corroborate the totals with selective bottom-up approximations, where supplier revenue disclosures, sampled average selling price (ASP) by coating class, and channel checks are used to confirm the final band is realistic.
Key inputs include, for example, the split of demand across biomedical, electronics, wastewater treatment, and energy, typical particle-size usage preferences by application, the share of polymer-coated versus uncoated volumes, and observable shifts in synthesis method mix that affect cost. For regional growth, we rely on markers such as R&D intensity and manufacturing activity. When direct volume visibility is limited, we handle gaps by using ranges from primary conversations, then select conservative midpoints and run sensitivity checks to show how totals move with ASP and adoption.
For forecasting, we mainly apply scenario analysis driven by a small set of factors that interviewees consistently link to uptake, such as regulatory acceptance in biomedical uses, scale-up success for reproducible coatings, and procurement cycles in environmental remediation projects. Assumptions are refreshed so the forecast reflects near-term commercialization realities, not just long-term lab activity.
Data Validation & Update Cycle
Model outputs are checked against independent signals so obvious mismatches can be caught early, and then corrected with a second pass. We run variance checks across regions and applications, review year-over-year growth for breakpoints that do not match known demand events, and re-check any outliers back to the source trail.
Before sign-off, numbers and assumptions go through multi-step analyst reviews, and re-contact is triggered when interview feedback conflicts with desk indicators, or when pricing and adoption appear to move faster than expected. Reports are refreshed annually, with interim updates when material events occur, and a fresh final review is completed right before delivery so clients receive the latest updated view.
Mordor Intelligence's Magnetite Nanoparticles Market Sizing Compared With Other Published Estimates
Published market sizes for magnetite nanoparticles often do not match because counting rules differ, even when the topic name looks the same. Differences usually come from what is treated as the product, which year is used as the anchor, and how pricing and adoption are translated into revenue.
Micron-sized magnetite powders sit outside Mordor Intelligence's scope, which helps explain why some smaller estimates land far below the 2026 level reported here. The spread also reflects whether figures use lab-scale pricing versus scaled commercial pricing, whether coated and functionalized grades are priced with a clear ASP ladder, and how frequently currency timing and inflation are refreshed in the model.
Benchmark comparison
| Source | Market Size | Gaps in Research Methodology |
|---|---|---|
| Mordor Intelligence | USD 94.46 B (2026) | |
| Global Consultancy A | USD 67.80 M (2024) | Anchors to an earlier year and appears to size a narrower nano-material revenue pool, which can undercount coated and application-ready grades that are sold at higher realized ASPs. |
| Industry Publisher B | USD 70.30 M (2024) | Relies on a smaller captured demand base and does not clearly show how ASP changes by coating type and particle size are applied, which can compress the final value total. |
The comparison points to two practical drivers behind the spread: scope inclusions, and how pricing is translated from particle attributes into realized revenue. When assumptions are tied back to adoption signals and then re-checked through interviews, the resulting market size stays explainable and repeatable for planning.
Key Questions Answered in the Report
What is the projected value of the magnetite nanoparticles market by 2031?
The market is expected to reach USD 149.44 billion by 2031, driven by a 9.62% CAGR.
Which application currently generates the highest revenue?
Biomedical uses lead with 38.62% of 2025 revenue, largely due to targeted drug delivery and imaging.
Why are sub-20 nm particles gaining popularity?
They offer superior surface area and superparamagnetic behavior, supporting next-generation therapies and catalytic processes.
How dominant is Asia-Pacific in global supply?
The region supplied 44.35% of 2025 revenue and shows the highest 11.75% CAGR, propelled by strong patent output and government funding.