Waterproofing Chemicals Market Size and Share
Market Overview
| Study Period | 2020 - 2031 |
|---|---|
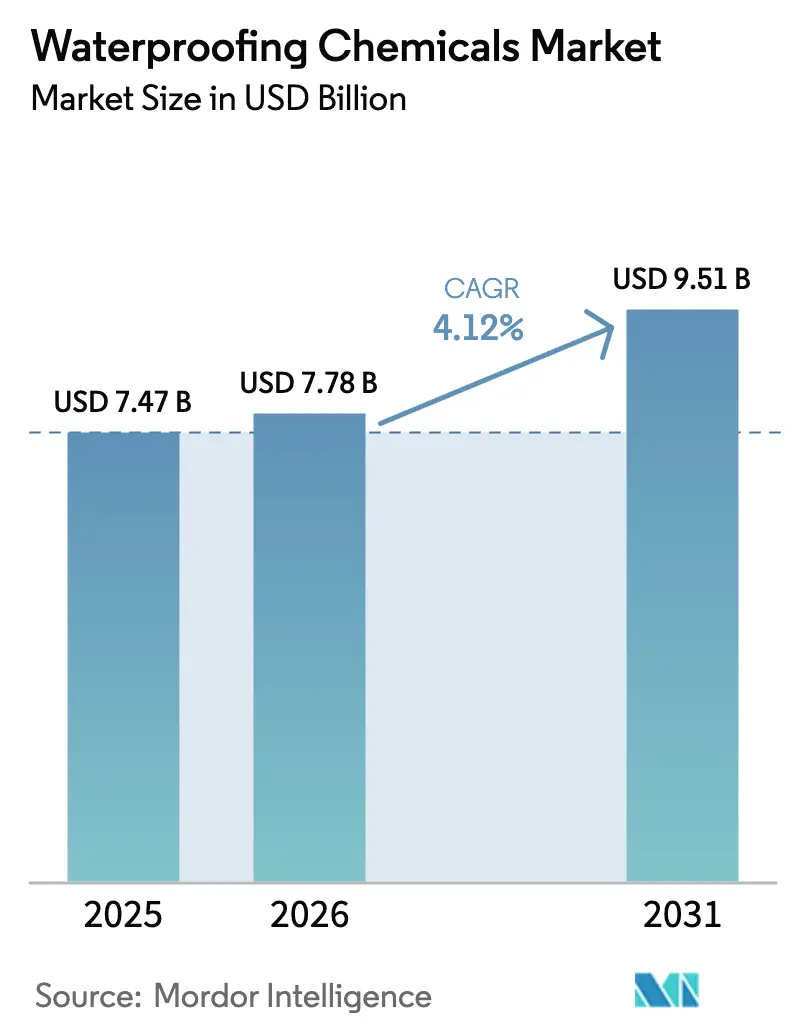
| Market Size (2026) | USD 7.78 Billion |
| Market Size (2031) | USD 9.51 Billion |
| Growth Rate (2026 - 2031) | 4.12% CAGR |
| Fastest Growing Market | Middle East and Africa |
| Largest Market | Asia Pacific |
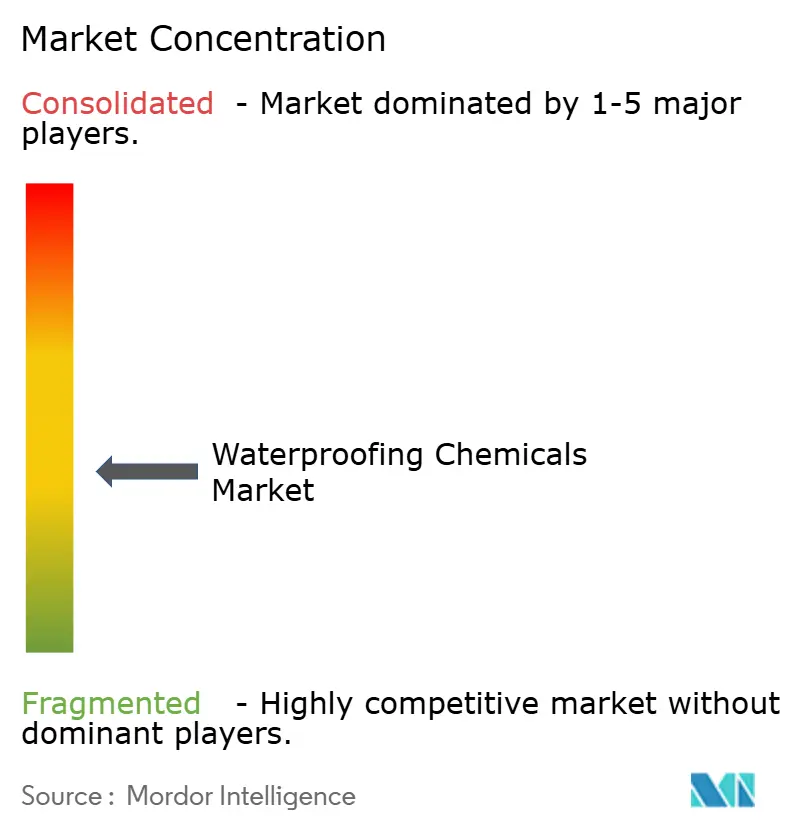
| Market Concentration | Medium |
Major Players *Disclaimer: Major Players sorted in no particular order Image © Mordor Intelligence. Reuse requires attribution under CC BY 4.0. | |
Waterproofing Chemicals Market Analysis by Mordor Intelligence
The Waterproofing Chemicals Market size was valued at USD 7.47 billion in 2025 and estimated to grow from USD 7.78 billion in 2026 to reach USD 9.51 billion by 2031, at a CAGR of 4.12% during the forecast period (2026-2031). Demand is rising as building owners move from commodity sealants to performance-engineered, self-healing systems that extend service life and cut maintenance. Infrastructure modernization programs in emerging regions, stricter codes that mandate vapor and air barriers, and green-building incentives all reinforce steady volume growth. Technology plays a central role: AI-enabled monitoring platforms, nano-engineered self-healing coatings, and bio-based feedstocks are redefining product performance while aligning with carbon-reduction targets. Competitive intensity is moderate yet tightening, with global majors acquiring regional specialists to secure niche chemistries and digital competencies. Although feedstock cost swings and PFAS phase-outs add uncertainty, most suppliers are hedging risk through vertical integration, renewable electricity adoption, and active reformulation pipelines.
Key Report Takeaways
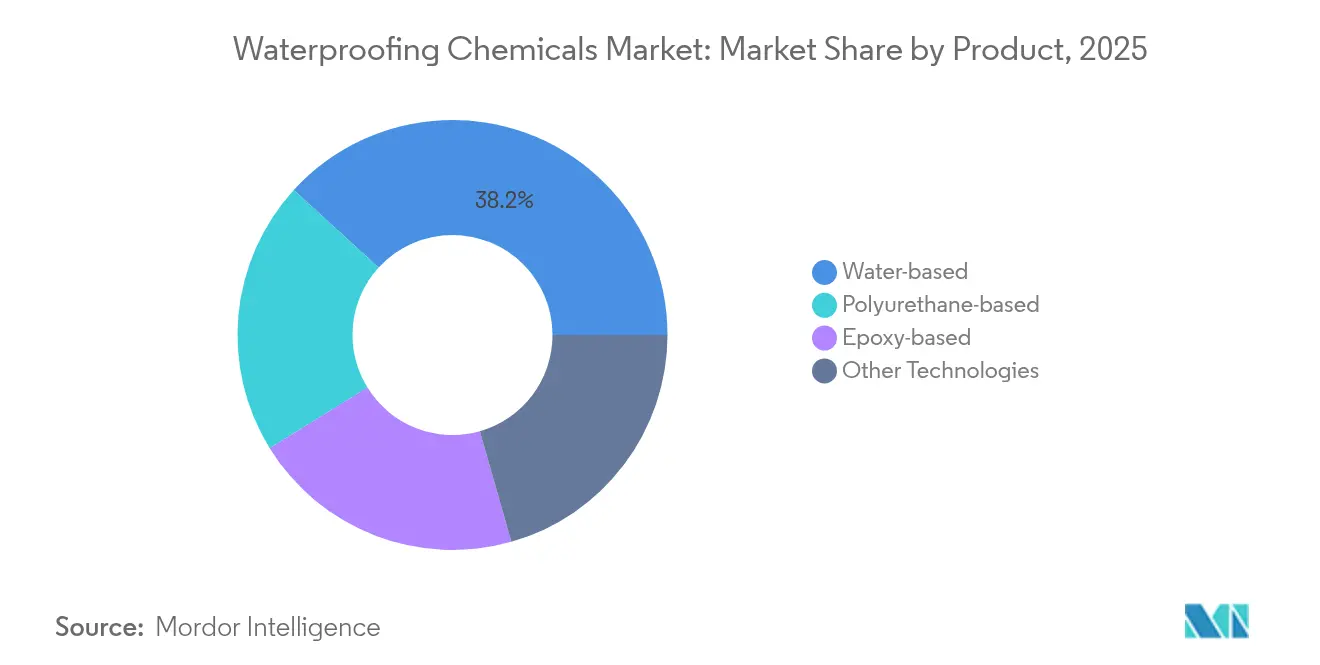
- By product category, water-based formulations captured 38.22% of waterproofing chemicals market share in 2025 and are projected to expand at a 4.43% CAGR through 2031.
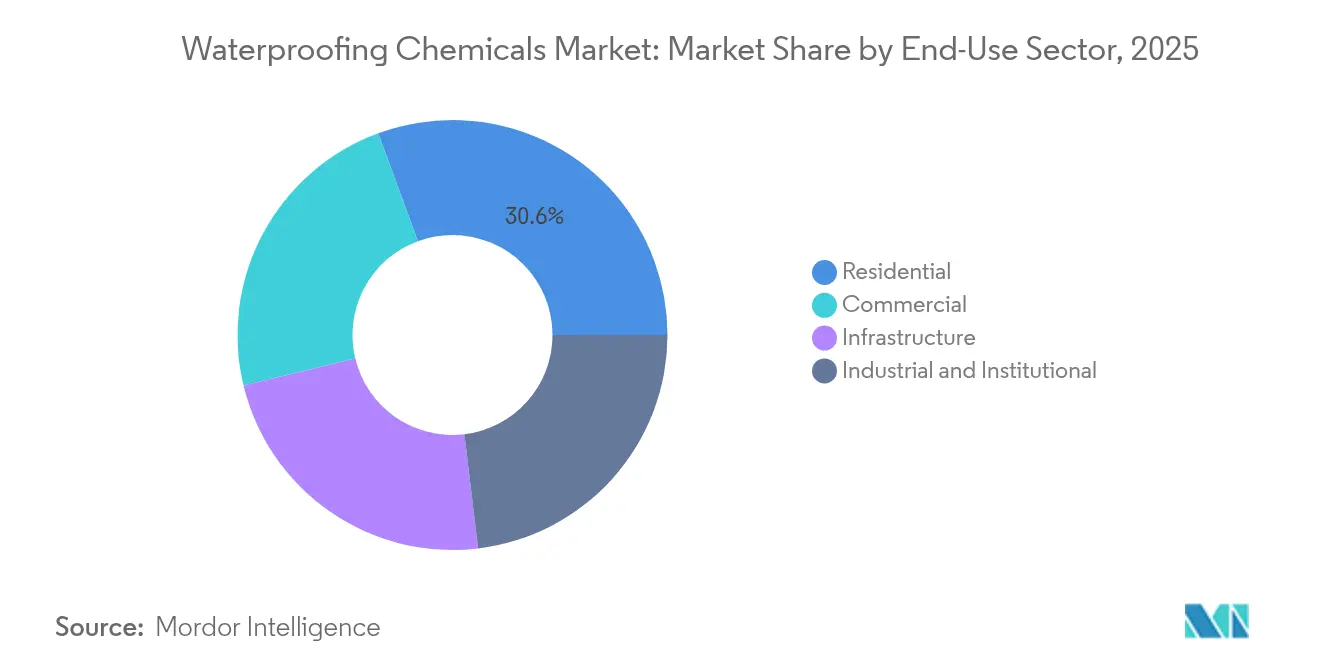
- By end-use sector, residential applications held 30.62% revenue share in 2025, while the industrial and institutional segment is advancing at a 4.86% CAGR to 2031.
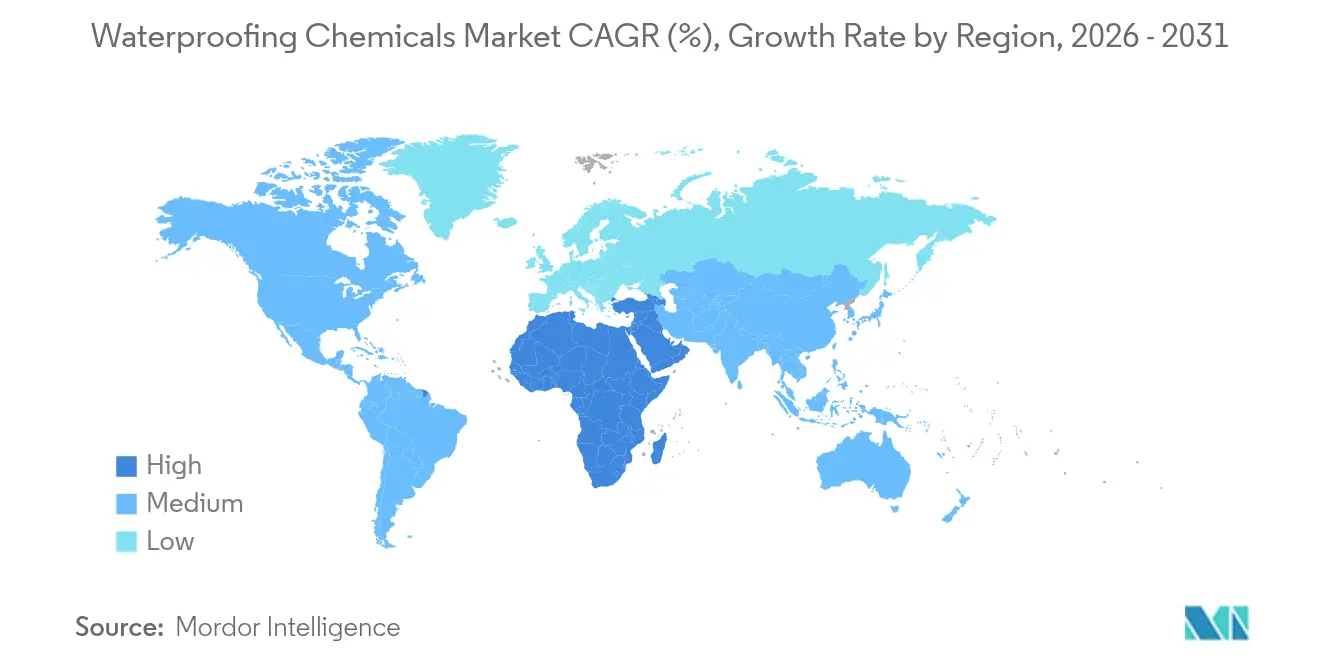
- By geography, Asia-Pacific led with 40.15% share of the waterproofing chemicals market size in 2025; the Middle-East and Africa region is forecast to deliver the highest 5.86% CAGR over the same period.
Note: Market size and forecast figures in this report are generated using Mordor Intelligence’s proprietary estimation framework, updated with the latest available data and insights as of 2026.
Global Waterproofing Chemicals Market Trends and Insights
Drivers Impact Analysis*
| Drivers | (~) % Impact on CAGR Forecast | Geographic Relevance | Impact Timeline |
|---|---|---|---|
| Infrastructure spending in emerging markets | +1.2% | Asia-Pacific, Middle-East and Africa, Latin America | Medium term (2-4 years) |
| Stricter codes that mandate waterproofing | +0.8% | Global; early uptake in North America and Europe | Short term (≤ 2 years) |
| Demand for energy-efficient green buildings | +0.7% | North America, Europe, developed Asia-Pacific | Medium term (2-4 years) |
| AI-driven predictive self-healing coatings | +0.5% | North America, Europe, Japan, South Korea | Long term (≥ 4 years) |
| Carbon-credit incentives for long service life | +0.3% | EU, California, selected North American jurisdictions | Long term (≥ 4 years) |
| Source: Mordor Intelligence | |||


Accelerating Infrastructure Spending in Emerging Economies
Rapid urbanization is channeling public and private capital into large-scale projects that require long-lived envelopes capable of withstanding monsoons, seismic shocks, and sea-level rise. Construction output in the Asia-Pacific region is growing as China, India, Indonesia, and Vietnam implement multi-year transportation and housing programs. Specifications are increasingly calling for multilayer assemblies with 50-year warranties and self-healing properties, prompting suppliers to localize production for just-in-time delivery and lower Scope 3 emissions. Similar investment waves in the Gulf, notably Saudi Arabia’s NEOM and the UAE's regional rail links, set strict technical baselines for temperature swing tolerance and sand abrasion resistance. As budgets prioritize lifecycle cost rather than upfront price, advanced waterproofing becomes a strategic asset rather than a commodity line item.
Stricter Building Codes Mandating Waterproofing Layers
Code bodies worldwide have shifted moisture protection from optional to mandatory. The 2024 International Building Code requires continuous air–vapor barriers verified by third-party testing, while Europe’s Construction Products Regulation 2024/3110 compels environmental product declarations alongside durability certification[1]International Code Council, “International Building Code 2024 Updates,” iccsafe.org. Australia, Japan, and parts of Latin America have mirrored these provisions, accelerating demand for polymer-modified membranes that deliver both vapor control and liquid water resistance. Digital sensors embedded in membranes now feed real-time data to asset managers, enabling code-compliant reporting with minimal site visits. Suppliers able to demonstrate verified permeability, adhesion, and service-life metrics gain preferred-vendor status on major commercial builds.
AI-Driven Predictive Maintenance Boosting Self-Healing Coatings
Embedding IoT sensors and machine learning into the building envelope enables owners to predict leaks months in advance of visible damage. Nano-engineered self-healing concrete seals 0.1 mm cracks autonomously and tracks micro-movement via embedded strain gauges, lowering maintenance spend by 25% over traditional membranes[2]Vijayan D.S., “Nano-Engineered Self-Healing Concrete,” sciencedirect.com. Silicon-based elastomers developed at Waseda University self-repair at 80 °C, regaining a hardness of 1.50 GPa after activation. Vendors are packaging these chemistries into subscription services that cover installation, monitoring, and automatic dispatch of repair crews, converting one-time sales into recurring revenue.
Carbon-Credit Incentives for Extending Building Life Cycles
Life-cycle analysis shows that delaying demolition yields sizable embodied-carbon savings. The EU’s CPR 2024/3110 and California’s building decarbonization framework now issue carbon credits for envelope upgrades that add 20 years or more to the structural life of buildings. Waterproofing suppliers with validated 50-year systems can monetize those credits at USD 50-80 per ton of CO₂e avoided. Digital product passports, utilizing blockchain technology, record every inspection and repair, thereby anchoring claims for both credits and ESG reporting. This policy landscape rewards chemistries that prioritize durability, recyclability, and low-carbon feedstocks.
Restraints Impact Analysis*
| Restraints | (~) % Impact on CAGR Forecast | Geographic Relevance | Impact Timeline |
|---|---|---|---|
| Volatile raw-material prices | -0.9% | Global, particularly impacting petrochemical-dependent regions | Short term (≤ 2 years) |
| Low awareness among small and medium-sized contractors | -0.6% | Emerging markets, rural North America, Southern Europe | Medium term (2-4 years) |
| Petro-chemical feedstock diversion to battery industry | -0.4% | Global, with acute impact in Asia-Pacific manufacturing hubs | Medium term (2-4 years) |
| Source: Mordor Intelligence | |||
Volatile Raw-Material Prices
Polyurethane and epoxy feedstocks, such as MDI and TDI, experienced double-digit price increases in 2024 due to supply disruptions and competition from battery manufacturers. While global majors hedge risk through multi-year contracts and demand forecasting, smaller producers absorb margin hits or pass costs downstream. Although bio-based acrylates offer price stability, they trade at 20-30% premiums, which limits immediate substitution. Such volatility forces contractors to re-quote bids and can delay project starts, tempering short-term volume growth.
Low Awareness Among Small and Medium-Sized Contractors
Industry audits indicate that 60-70% of membrane failures are attributed to installation errors. Thousands of small contractors unfamiliar with advanced chemistries often default to commodity coatings, missing out on the performance gains of polymer-modified or self-healing systems. Manufacturers are rolling out e-learning modules and augmented-reality tutorials, yet uptake remains modest in regions where labor is informal or training budgets are slim. This knowledge gap slows diffusion into the residential and small commercial niches, segmenting the market along technical capability lines.
*Our forecasts treat driver/restraint impacts as directional, not additive. The impact forecasts reflect baseline growth, mix effects, and variable interactions.
Segment Analysis
By Product: Water-Based Formulations Drive Sustainability Transition
Water-based chemistries commanded a 38.22% market share of the waterproofing chemicals market in 2025 and are forecast to maintain leadership through 2031 at a 4.43% CAGR. Their dominance stems from global VOC caps, PFAS phase-outs, and client preference for odor-free application. BASF’s conversion to bio-based ethyl acrylate reduced greenhouse-gas emissions by 30% while maintaining identical performance, providing specifiers with a drop-in, low-carbon option. In comparison, solvent-borne polyurethane remains critical for joints and below-grade works that require extreme flexibility. Epoxies protect chemical-exposed environments, such as wastewater tanks, while hybrids—comprising silane-terminated polyethers, organosiloxanes, and nano-ceramic films—capture innovation headlines for their multi-functional durability.
The waterproofing chemicals market size for water-based formulations is growing, reflecting continuous code pressure and client ESG targets. Suppliers bundle primers, membranes, and topcoats into integrated kits that simplify procurement and warranty. Automated spray rigs and roller-friendly viscosities further shorten labor time, making water-based solutions cost-competitive after factoring in restricted working-hour regulations on VOCs. On the downside, the extreme-cold cure properties still lag behind those of solvent-based peers, leaving room for additive research and winter-grade variants.


By End-Use Sector: Industrial Digitization Accelerates Advanced System Adoption
The industrial and institutional segment is on track for a 4.86% CAGR from 2026-2031, outpacing all other sectors as factories, data centers, and hospitals deploy sensor-equipped envelopes that support predictive maintenance. These buyers favor turnkey packages that integrate IoT nodes, cloud dashboards, and self-healing membranes, justifying a higher upfront cost by cutting unplanned downtime. By contrast, the residential segment, although still the largest by value, adopts innovations more slowly due to budget constraints and fragmented installer networks.
In 2025, residential renovations and new builds generated 30.62% of global revenue. Retrofit grants tied to energy efficiency help stabilize this segment, especially in European heat-pump rollouts, where moisture control preserves thermal performance. The waterproofing chemicals market size for residential retrofits is growing; however, labor shortages and uneven technical training are expected to limit volume growth. Infrastructure megaprojects—bridges, tunnels, rail—continue to specify membranes with 50-year service life clauses, yet cyclical public funding introduces periodic lulls.
Geography Analysis
Asia-Pacific accounted for 40.15% of revenue in 2025. China’s public-works portfolio now mandates membranes rated for self-healing and 50-year durability, raising baseline specifications across ASEAN supply chains. India’s Smart Cities initiative channels funds toward envelope upgrades that combine moisture management with energy savings, opening doors for integrated insulation-membrane panels. Technology-forward Japan and South Korea are piloting AI-linked coatings that feed building-management systems, proving the business case for predictive maintenance.
The Middle-East and Africa enjoy the fastest trajectory at 5.86% CAGR through 2031, shaped by giga-projects such as NEOM, Qatar’s stadium retrofits, and large-scale desalination plants. Formulas must handle intense UV exposure, rapid thermal cycling, and salt spray, favoring hybrid chemistries with ceramic fillers and high solar reflectance. As water security rises on national agendas, chemically resistant linings gain traction in pipelines and reservoirs.
North America and Europe exhibit mature yet dynamic demand. Europe’s CPR 2024/3110 couples environmental declarations with durability validation, elevating suppliers that document cradle-to-grave impacts and long service life. PFAS restrictions compel rapid reformulation, accelerating the shift to water-based and bio-based repellents. In California and British Columbia, carbon-credit schemes reward retrofit projects that demonstrably extend building life, making advanced waterproofing a lever for monetizing avoided emissions. North American owners also favor real-time monitoring platforms, turning envelopes into data assets that inform HVAC cycles and warranty strategies.

Competitive Landscape
The market remains moderately fragmented, yet recent consolidation is reshaping competitive dynamics. Product differentiation hinges on integrating chemistry with data. Providers that bundle IoT nodes, cloud analytics, and self-healing polymers command price premiums and sticky service contracts. Subscription models convert capital expenditures into operating expenditures, making them attractive to facility managers seeking predictable budgets. Niche innovators deploy nanoclay or MOF-enhanced films for dual moisture and thermal control, pressuring incumbents to accelerate research and development cycles. Vertical integration into feedstocks and renewable energy shields margins against price shocks. Sourcing bio-based monomers and locking green-power purchase agreements help insulate cost structure and support ESG disclosures. Collaborations with universities, such as Waseda and ETH Zürich, feed cutting-edge research into commercial pipelines, ensuring continuous performance gains.
Waterproofing Chemicals Industry Leaders
Sika AG
Hongyuan Waterproof Technology Group Co., Ltd.
Nippon Paint Holdings Co., Ltd.
Saint-Gobain
Carlisle Companies Inc
- *Disclaimer: Major Players sorted in no particular order

Recent Industry Developments
- May 2025: Smart Asia Chemicals announced a strategic joint venture with Keshun International Construction and Trading Sdn Bhd, a subsidiary of China-based Keshun Waterproof Technology Co., Ltd. The partnership aims to develop and deliver waterproofing and construction chemical products tailored to the Malaysian market.
- February 2025: Saint-Gobain has finalized its acquisition of Fosroc, a prominent global player in construction chemicals, significantly enhancing its presence across India, the Middle East, and the Asia-Pacific region. This strategic move, announced in June 2024 and completed in February 2025, marks a pivotal expansion of Saint-Gobain’s construction chemicals portfolio, encompassing waterproofing systems from the basement to the roof.


Global Waterproofing Chemicals Market Report Scope
Commercial, Industrial and Institutional, Infrastructure, Residential are covered as segments by End Use Sector. Epoxy-based, Polyurethane-based, Water-based are covered as segments by Technology. Asia-Pacific, Europe, Middle East and Africa, North America, South America are covered as segments by Region.| Epoxy-based |
| Polyurethane-based |
| Water-based |
| Other Technologies |
| Commercial |
| Industrial and Institutional |
| Infrastructure |
| Residential |
| Asia-Pacific | Australia |
| China | |
| India | |
| Indonesia | |
| Japan | |
| Malaysia | |
| South Korea | |
| Thailand | |
| Vietnam | |
| Rest of Asia-Pacific | |
| North America | Canada |
| Mexico | |
| United States | |
| Europe | France |
| Germany | |
| Italy | |
| Russia | |
| Spain | |
| United Kingdom | |
| Rest of Europe | |
| South America | Argentina |
| Brazil | |
| Rest of South America | |
| Middle-East and Africa | Saudi Arabia |
| United Arab Emirates | |
| Rest of Middle-East and Africa |
| By Product | Epoxy-based | |
| Polyurethane-based | ||
| Water-based | ||
| Other Technologies | ||
| By End-Use Sector | Commercial | |
| Industrial and Institutional | ||
| Infrastructure | ||
| Residential | ||
| By Geography | Asia-Pacific | Australia |
| China | ||
| India | ||
| Indonesia | ||
| Japan | ||
| Malaysia | ||
| South Korea | ||
| Thailand | ||
| Vietnam | ||
| Rest of Asia-Pacific | ||
| North America | Canada | |
| Mexico | ||
| United States | ||
| Europe | France | |
| Germany | ||
| Italy | ||
| Russia | ||
| Spain | ||
| United Kingdom | ||
| Rest of Europe | ||
| South America | Argentina | |
| Brazil | ||
| Rest of South America | ||
| Middle-East and Africa | Saudi Arabia | |
| United Arab Emirates | ||
| Rest of Middle-East and Africa | ||


Market Definition
- END-USE SECTOR - Waterproofing chemicals consumed in the construction sectors such as commercial, residential, industrial, institutional, and infrastructure are considered under the scope of the study.
- PRODUCT/APPLICATION - Under the scope of the study, the consumption of waterproofing chemical products based on water, epoxy, polyurethane, and other technologies are considered.
| Keyword | Definition |
|---|---|
| Accelerator | Accelerators are admixtures used to fasten the setting time of concrete by increasing the initial rate and speeding up the chemical reaction between cement and the mixing water. These are used to harden and increase the strength of concrete quickly. |
| Acrylic | This synthetic resin is a derivative of acrylic acid. It forms a smooth surface and is mainly used for various indoor applications. The material can also be used for outdoor applications with a special formulation. |
| Adhesives | Adhesives are bonding agents used to join materials by gluing. Adhesives can be used in construction for many applications, such as carpet laying, ceramic tiles, countertop lamination, etc. |
| Air Entraining Admixture | Air-entraining admixtures are used to improve the performance and durability of concrete. Once added, they create uniformly distributed small air bubbles to impart enhanced properties to the fresh and hardened concrete. |
| Alkyd | Alkyds are used in solvent-based paints such as construction and automotive paints, traffic paints, flooring resins, protective coatings for concrete, etc. Alkyd resins are formed by the reaction of an oil (fatty acid), a polyunsaturated alcohol (Polyol), and a polyunsaturated acid or anhydride. |
| Anchors and Grouts | Anchors and grouts are construction chemicals that stabilize and improve the strength and durability of foundations and structures like buildings, bridges, dams, etc. |
| Cementitious Fixing | Cementitious fixing is a process in which a cement-based grout is pumped under pressure to fill forms, voids, and cracks. It can be used in several settings, including bridges, marine applications, dams, and rock anchors. |
| Commercial Construction | Commercial construction comprises new construction of warehouses, malls, shops, offices, hotels, restaurants, cinemas, theatres, etc. |
| Concrete Admixtures | Concrete admixtures comprise water reducers, air entrainers, retarders, accelerators, superplasticizers, etc., added to concrete before or during mixing to modify its properties. |
| Concrete Protective Coatings | To provide specific protection, such as anti-carbonation or chemical resistance, a film-forming protective coat can be applied on the surface. Depending on the applications, different resins like epoxy, polyurethane, and acrylic can be used for concrete protective coatings. |
| Curing Compounds | Curing compounds are used to cure the surface of concrete structures, including columns, beams, slabs, and others. These curing compounds keep the moisture inside the concrete to give maximum strength and durability. |
| Epoxy | Epoxy is known for its strong adhesive qualities, making it a versatile product in many industries. It resists heat and chemical applications, making it an ideal product for anyone needing a stronghold under pressure. It is widely used in adhesives, electrical and electronics, paints, etc. |
| Fiber Wrapping Systems | Fiber Wrapping Systems are a part of construction repair and rehabilitation chemicals. It involves the strengthening of existing structures by wrapping structural members like beams and columns with glass or carbon fiber sheets. |
| Flooring Resins | Flooring resins are synthetic materials applied to floors to enhance their appearance, increase their resistance to wear and tear or provide protection from chemicals, moisture, and stains. Depending on the desired properties and the specific application, flooring resins are available in distinct types, such as epoxy, polyurethane, and acrylic. |
| High-Range Water Reducer (Super Plasticizer) | High-range water reducers are a type of concrete admixture that provides enhanced and improved properties when added to concrete. These are also called superplasticizers and are used to decrease the water-to-cement ratio in concrete. |
| Hot Melt Adhesives | Hot-melt adhesives are thermoplastic bonding materials applied as melts that achieve a solid state and resultant strength on cooling. They are commonly used for packaging, coatings, sanitary products, and tapes. |
| Industrial and Institutional Construction | Industrial and institutional construction includes new construction of hospitals, schools, manufacturing units, energy and power plants, etc. |
| Infrastructure Construction | Infrastructure construction includes new construction of railways, roads, seaways, airports, bridges, highways, etc. |
| Injection Grouting | The process of injecting grout into open joints, cracks, voids, or honeycombs in concrete or masonry structural members is known as injection grouting. It offers several benefits, such as strengthening a structure and preventing water infiltration. |
| Liquid-Applied Waterproofing Membranes | Liquid-Applied membrane is a monolithic, fully bonded, liquid-based coating suitable for many waterproofing applications. The coating cures to form a rubber-like elastomeric waterproof membrane and may be applied over many substrates, including asphalt, bitumen, and concrete. |
| Micro-concrete Mortars | Micro-concrete mortar is made up of cement, water-based resin, additives, mineral pigments, and polymers and can be applied on both horizontal and vertical surfaces. It can be used to refurbish residential complexes, commercial spaces, etc. |
| Modified Mortars | Modified Mortars include Portland cement and sand along with latex/polymer additives. The additives increase adhesion, strength, and shock resistance while also reducing water absorption. |
| Mold Release Agents | Mold release agents are sprayed or coated on the surface of molds to prevent a substrate from bonding to a molding surface. Several types of mold release agents, including silicone, lubricant, wax, fluorocarbons, and others, are used based on the type of substrates, including metals, steel, wood, rubber, plastic, and others. |
| Polyaspartic | Polyaspartic is a subset of polyurea. Polyaspartic floor coatings are typically two-part systems that consist of a resin and a catalyst to ease the curing process. It offers high durability and can withstand harsh environments. |
| Polyurethane | Polyurethane is a plastic material that exists in various forms. It can be tailored to be either rigid or flexible and is the material of choice for a broad range of end-user applications, such as adhesives, coatings, building insulation, etc. |
| Reactive Adhesives | A reactive adhesive is made of monomers that react in the adhesive curing process and do not evaporate from the film during use. Instead, these volatile components become chemically incorporated into the adhesive. |
| Rebar Protectors | In concrete structures, rebar is one of the important components, and its deterioration due to corrosion is a major issue that affects the safety, durability, and life span of buildings and structures. For this reason, rebar protectors are used to protect against degrading effects, especially in infrastructure and industrial construction. |
| Repair and Rehabilitation Chemicals | Repair and Rehabilitation Chemicals include repair mortars, injection grouting materials, fiber wrapping systems, micro-concrete mortars, etc., used to repair and restore existing buildings and structures. |
| Residential Construction | Residential construction involves constructing new houses or spaces like condominiums, villas, and landed homes. |
| Resin Fixing | The process of using resins like epoxy and polyurethane for grouting applications is called resin fixing. Resin fixing offers several advantages, such as high compressive and tensile strength, negligible shrinkage, and greater chemical resistance compared to cementitious fixing. |
| Retarder | Retarders are admixtures used to slow down the setting time of concrete. These are usually added with a dosage rate of around 0.2% -0.6% by weight of cement. These admixtures slow down hydration or lower the rate at which water penetrates the cement particles by making concrete workable for a long time. |
| Sealants | A sealant is a viscous material that has little or no flow qualities, which causes it to remain on surfaces where they are applied. Sealants can also be thinner, enabling penetration to a certain substance through capillary action. |
| Sheet Waterproofing Membranes | Sheet membrane systems are reliable and durable thermoplastic waterproofing solutions that are used for waterproofing applications even in the most demanding below-ground structures, including those exposed to highly aggressive ground conditions and stress. |
| Shrinkage Reducing Admixture | Shrinkage-reducing admixtures are used to reduce concrete shrinkage, whether from drying or self-desiccation. |
| Silicone | Silicone is a polymer that contains silicon combined with carbon, hydrogen, oxygen, and, in some cases, other elements. It is an inert synthetic compound that comes in various forms, such as oil, rubber, and resin. Due to its heat-resistant properties, it finds applications in sealants, adhesives, lubricants, etc. |
| Solvent-borne Adhesives | Solvent-borne adhesives are mixtures of solvents and thermoplastic or slightly cross-linked polymers such as polychloroprene, polyurethane, acrylic, silicone, and natural and synthetic rubbers. |
| Surface Treatment Chemicals | Surface treatment chemicals are chemicals used to treat concrete surfaces, including roofs, vertical surfaces, and others. They act as curing compounds, demolding agents, rust removers, and others. They are cost-effective and can be used on roadways, pavements, parking lots, and others. |
| Viscosity Modifier | Viscosity Modifiers are concrete admixtures used to change various properties of admixtures, including viscosity, workability, cohesiveness, and others. These are usually added with a dosage of around 0.01% to 0.1% by weight of cement. |
| Water Reducer | Water reducers, also called plasticizers, are a type of admixture used to decrease the water-to-cement ratio in the concrete, thereby increasing the durability and strength of concrete. Various water reducers include refined lignosulfonates, gluconates, hydroxycarboxylic acids, sugar acids, and others. |
| Water-borne Adhesives | Water-borne adhesives use water as a carrier or diluting medium to disperse resin. They are set by allowing the water to evaporate or be absorbed by the substrate. These adhesives are compounded with water as a dilutant rather than a volatile organic solvent. |
| Waterproofing Chemicals | Waterproofing chemicals are designed to protect a surface from the perils of leakage. A waterproofing chemical is a protective coating or primer applied to a structure's roof, retaining walls, or basement. |
| Waterproofing Membranes | Waterproofing membranes are liquid-applied or self-adhering layers of water-tight materials that prevent water from penetrating or damaging a structure when applied to roofs, walls, foundations, basements, bathrooms, and other areas exposed to moisture or water. |


Research Methodology
Mordor Intelligence follows a four-step methodology in all our reports.
- Step-1: Identify Key Variables: The quantifiable key variables (industry and extraneous) pertaining to the specific product segment and country are selected from a group of relevant variables & factors based on desk research & literature review; along with primary expert inputs. These variables are further confirmed through regression modeling (wherever required).
- Step-2: Build a Market Model: In order to build a robust forecasting methodology, the variables and factors identified in Step-1 are tested against available historical market numbers. Through an iterative process, the variables required for market forecast are set and the model is built on the basis of these variables.
- Step-3: Validate and Finalize: In this important step, all market numbers, variables and analyst calls are validated through an extensive network of primary research experts from the market studied. The respondents are selected across levels and functions to generate a holistic picture of the market studied.
- Step-4: Research Outputs: Syndicated Reports, Custom Consulting Assignments, Databases & Subscription Platforms


