Market Overview
| Study Period | 2020 - 2031 |
|---|---|
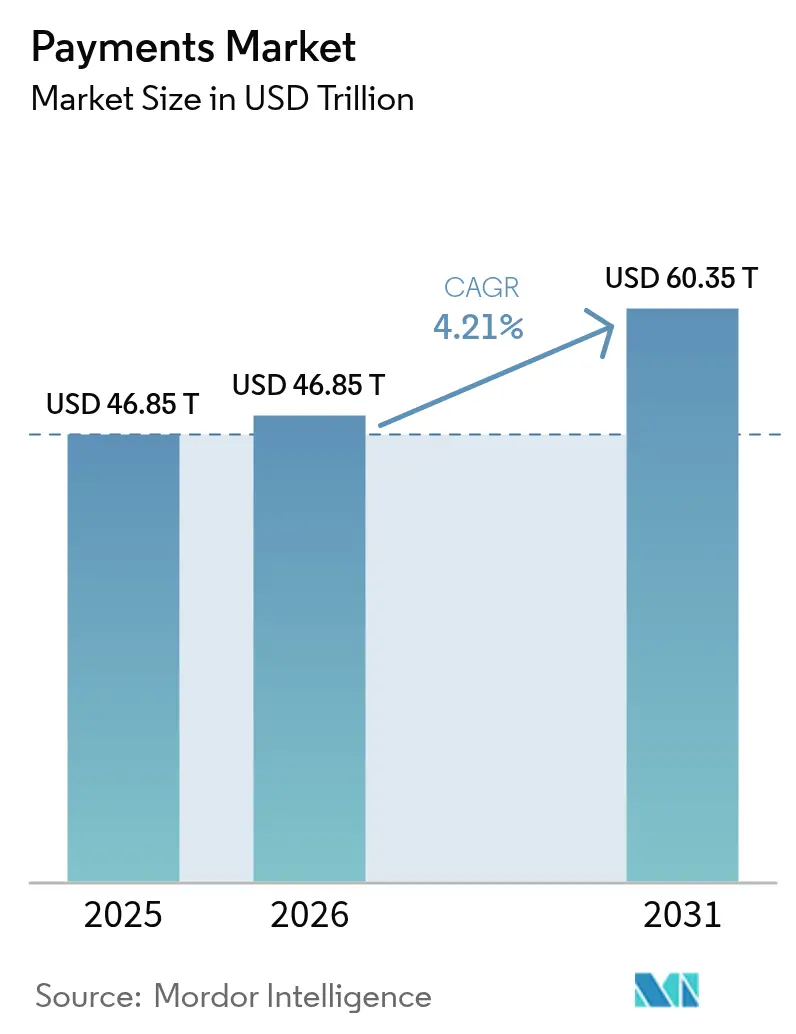
| Market Size (2026) | USD 46.85 Trillion |
| Market Size (2031) | USD 60.35 Trillion |
| Growth Rate (2026 - 2031) | 4.21% CAGR |
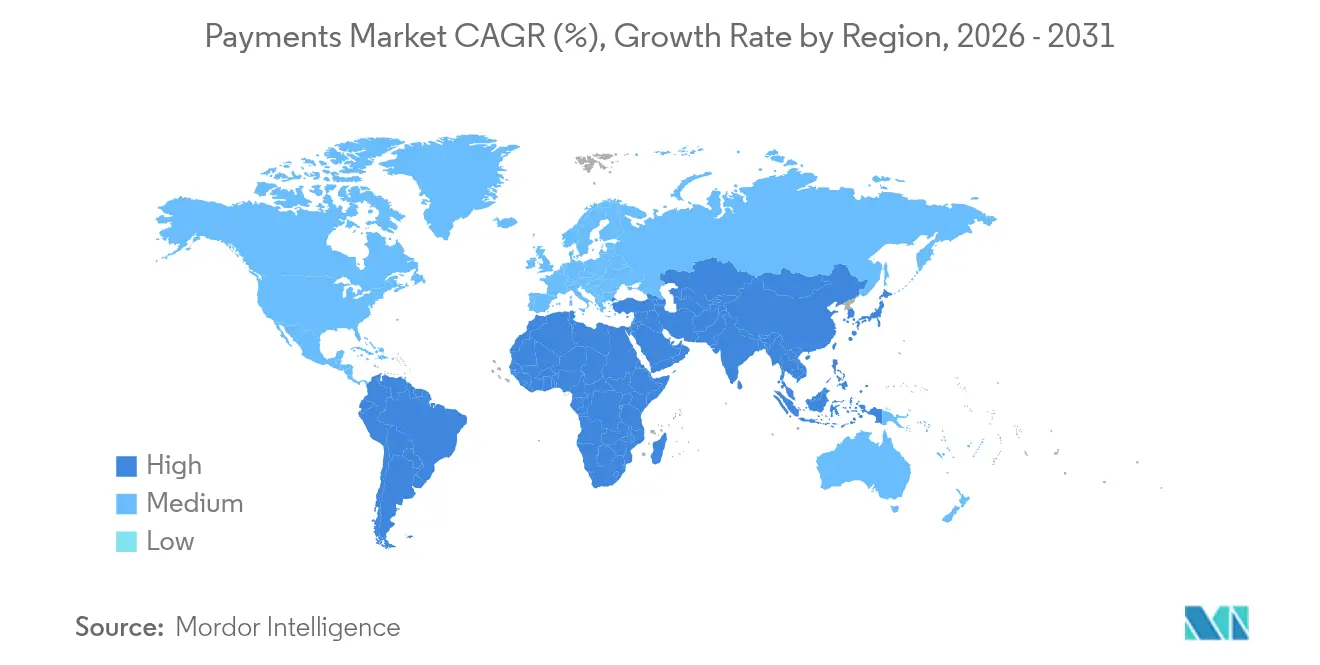
| Fastest Growing Market | Middle East and Africa |
| Largest Market | Asia Pacific |
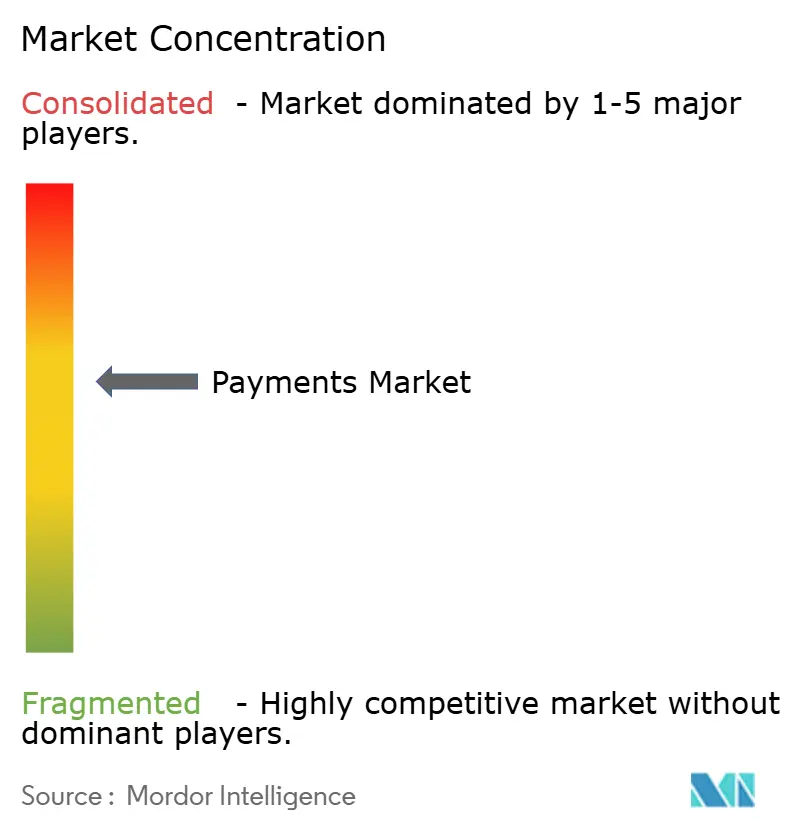
| Market Concentration | Medium |
Major Players *Disclaimer: Major Players sorted in no particular order Image © Mordor Intelligence. Reuse requires attribution under CC BY 4.0. | |
Payments Market Analysis by Mordor Intelligence
The Payments Market size is expected to grow from USD 46.85 trillion in 2025 to USD 46.85 trillion in 2026 and is forecast to reach USD 60.35 trillion by 2031 at 4.21% CAGR over 2026-2031.
Growth is anchored in widespread consumer migration toward mobile-first transactions, the quicker onboarding of financial institutions onto instant-payment rails, and accelerating cross-border e-commerce, which lifts both transaction volume and ticket size. Continued regulatory support for faster payments and uniform data standards quickens account-to-account adoption, while contactless transit programs stimulate tap-to-pay card usage in large metropolitan systems. Competitive intensity remains high as card networks invest in artificial intelligence and tokenization to safeguard volumes, even as digital wallet ecosystems, government-run real-time rails, and emerging fintech intermediaries reduce reliance on traditional interchange economics. Retail leads overall volume, yet healthcare and cross-border remittances provide the fastest incremental opportunities, attracting specialized processors and orchestration platforms.
Key Report Takeaways
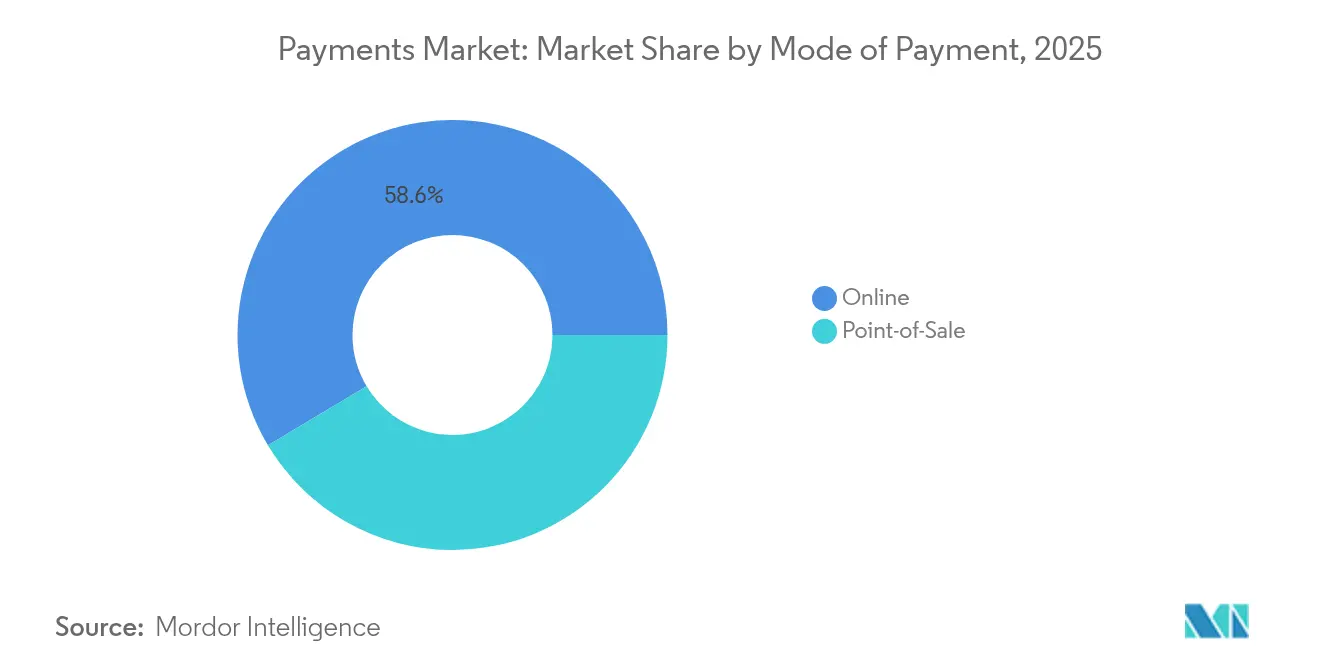
- By mode of payment, point-of-sale card transactions captured 41.43% of global payments market share in 2025, while account-to-account and wallet methods are growing at a 17.31% CAGR to 2031.
- By interaction channel, e-commerce and mobile commerce are advancing at a 16.11% CAGR and are eroding the 72.20% dominance that physical POS held in 2025.
- By transaction type, consumer-to-business flows remained largest at 62.35% in 2025; person-to-person transfers are expanding at a 13.29% CAGR through 2031.
- By end-user industry, retail retained a 34.55% revenue share in 2025, yet healthcare payments are forecast to surge 13.98% annually to 2031.
- By geography, Asia-Pacific led with 37.62% of global payments market share in 2025, while the Middle East & Africa segment is on track for a 15.12% CAGR to 2031.
Note: Market size and forecast figures in this report are generated using Mordor Intelligence’s proprietary estimation framework, updated with the latest available data and insights as of 2026.
Market Trends and Insights
Drivers Impact Analysis of Payments Market*
| Driver | (~) % Impact on CAGR Forecast | Geographic Relevance | Impact Timeline |
|---|---|---|---|
| E-commerce Expansion Driven by Mobile-First Emerging Asia | +2.8% | APAC core, spill-over to MEA | Medium term (2-4 years) |
| Government Instant-Payment Rails Accelerating A2A Adoption | +2.1% | North America & EU, Latin America | Short term (≤ 2 years) |
| Surging Cross-border B2C Remittances Fueling Digital Wallet Uptake | +1.9% | MENA & APAC corridors, Global | Medium term (2-4 years) |
| Contactless Transit & Toll Schemes Catalyzing Tap-to-Pay Card Volumes | +1.4% | Europe & Nordics, North America | Short term (≤ 2 years) |
| BNPL Integration by Tier-1 Retailers Boosting Ticket-Size & Frequency | +1.2% | Oceania, North America, Europe | Medium term (2-4 years) |
| ISO 20022 Migration Enabling Rich-Data Corporate Payments | +0.9% | Global, developed markets priority | Long term (≥ 4 years) |
| Source: Mordor Intelligence | |||
E-commerce Expansion Driven by Mobile-First Emerging Asia
Digital wallets already support 82% of online purchases and 66% of in-store payments in China, while India passed the 50% adoption milestone across all transaction types in 2024.[1]CNBC, “India’s Digital Wallet Adoption Crosses 50% Milestone,” cnbc.com These adoption curves compress a decade of Western growth into fewer than three years, enabling merchants to lower acceptance costs by 15-20% as QR codes and wallet rails bypass interchange fees and legacy card infrastructure. Cash’s share of all Asian transactions is projected to fall to 14% by 2027 as smartphone penetration and super-app ecosystems normalize wallet usage.[2]Nikkei Staff, “Asia’s Cash Use Falls Below 20% of Transactions,” asia.nikkei.com Spill-over effects arise in the Gulf Cooperation Council and African corridors where Asian fintechs replicate QR standards and super-app playbooks, reinforcing the global payments market trajectory. The granular behavioral data captured inside wallet environments creates monetization paths in lending and loyalty that are unavailable to traditional card networks, further accelerating wallet competition.
Government Instant-Payment Rails Accelerating A2A Adoption in North & Latin America
FedNow enrolled 400 U.S. financial institutions by early 2024, marking a structural break as real-time clearing options become mainstream for domestic transfers. [3]Federal Reserve Bank Services, “FedNow® Service – 2024 Participation Update,” frbservices.org The Federal Reserve’s target of onboarding 8,000 institutions will splinter low-value domestic traffic away from card schemes. Brazil’s PIX and India’s UPI illustrate the network effect: UPI now processes more than 100 billion annual transactions and reaches 50% market penetration, confirming the ability of state-sponsored rails to reset consumer and merchant expectations. ISO 20022 compatibility inside these rails permits rich data payloads that lower reconciliation time for corporate treasurers by as much as 40%. Card networks therefore shift defense toward high-value and cross-border flows, while expanding value-added services such as dispute management and installment options.
Surging Cross-border B2C Remittances Fueling Digital Wallet Uptake in MENA & APAC Corridors
Mobile-to-mobile remittances into wallets rose 128% between 2022 and 2023 as diaspora workers seek lower fees and faster settlement. Neo-banks servicing North African migrants in Europe claim annual savings of EUR 30–134 (USD 33–148) per sender against traditional providers. Wallet-based corridors compress total payment cost by 50–70% for under USD 500 transfers—a segment that constitutes the bulk of worker remittances. Faster settlement shrinks working-capital cycles for recipient families and merchants, freeing liquidity inside emerging-market economies. Competitive advantage tilts toward multi-corridor platforms that aggregate compliance, FX, and local disbursement under a single API, widening the addressable share within the global payments market.
Contactless Transit & Toll Schemes Catalyzing Tap-to-Pay Card Volumes in Europe & Nordics
Helsinki’s 4,000-terminal deployment across all public transport modes in 2025 proves that open-loop EMV acceptance can supersede city-specific closed-loop cards. Athens launched its tap2ride system the same year, while Venice extended contactless payments to water buses, trams, and ferries. Ridership uplifts of 20–30% follow once frictionless payments shorten boarding times, generating incremental farebox revenue for transit agencies and higher card volumes for networks. Denmark is replacing its Rejsekort chip platform with a nationwide mobile pay-as-you-go solution, a signpost that fully digital ticketing can eliminate physical media. For issuers, each new transit tap becomes a daily touchpoint that reinforces top-of-wallet status in adjacent retail spending.
Restraints Impact Analysis of Payments Market*
| Restraint | (~) % Impact on CAGR Forecast | Geographic Relevance | Impact Timeline |
|---|---|---|---|
| Cyber-fraud Sophistication Outpacing AI/ML Defenses in Cross-border Flows | -1.8% | Global, concentrated in cross-border corridors | Short term (≤ 2 years) |
| Interchange & MDR Caps Compressing Issuer Margins in EU & India | -1.2% | EU, India, spillover to other regions | Medium term (2-4 years) |
| Legacy Core-Banking Inflexibility Delaying Real-time Settlement in Africa | -0.9% | Africa, select emerging markets | Long term (≥ 4 years) |
| High Cash Reliance in Rural Caribbean Economies | -0.4% | Caribbean, rural Latin America | Long term (≥ 4 years) |
| Source: Mordor Intelligence | |||
Cyber-fraud Sophistication Outpacing AI/ML Defenses in Cross-border Flows
Global fraud losses touched USD 442 billion in 2023, with cross-border channels showing the steepest escalation because attackers exploit latency and jurisdictional silos. Visa has deployed more than 500 AI models and invested over USD 3 billion in data-centric defenses, yet false positives continue to undermine approval rates for high-growth apparel and travel merchants. Real-time payments remove the investigation window formerly provided by batch settlement, amplifying losses when synthetic identities penetrate onboarding filters. The industry’s pivot toward behavior-based analytics requires broader data sharing, but competitive sensitivities and privacy regimes impede unified consortium models. The resulting friction slows merchant adoption of new rails and dents consumer confidence, tempering part of the global payments market expansion.
Interchange & MDR Caps Compressing Issuer Margins in EU & India
Brussels extended interchange caps on non-EU cards to 2029, reinforcing precedent for fee regulation that trims issuer economics. India’s Payments Council supports a 0.3% merchant discount rate for UPI transactions, reversing the zero-MDR stance but still slicing conventional card fee income by up to 70%. With swipe fees at USD 187.2 billion in 2024, political focus on merchant costs triggers proposals such as the U.S. Credit Card Competition Act. Issuers now accelerate their shift to revolving-credit revenue, data monetization, and cross-border premium segments, while fintech acquirers emphasize value-added analytics over pure payment acceptance.
*Our forecasts treat driver/restraint impacts as directional, not additive. The impact forecasts reflect baseline growth, mix effects, and variable interactions.
Payments Market Segment Analysis
By Mode of Payment:
Cards Maintain Relative Scale Amid Wallet DisruptionPoint-of-sale card transactions held 41.43% of global payments market share in 2025, anchored by decades-old EMV infrastructure and global brand trust. Despite this cushion, wallet and account-to-account flows are compounding at 17.31% annually as QR codes and direct-to-account checkouts reduce acceptance cost. Merchants in Asia can save up to 2 percentage points in fees by steering consumers toward wallets, reinforcing the structural shift. In response, card networks promote network tokens and installment APIs to embed their rails inside wallet ecosystems, seeking to preserve transaction count even if form factors mutate.
The global payments market will still see card volumes increase in absolute terms because total consumption grows, but relative wallet share rises faster. ISO 20022 data-rich messages enhance reconciliation for corporate cards, yet they also enable competitive A2A alternatives carrying the same metadata. Co-branded card issuance remains a strategic hedge for e-commerce giants that want customer data, suggesting coexistence rather than immediate cannibalization.


By Interaction Channel:
Digital Commerce Propels Omnichannel OrchestrationPhysical POS owned 72.20% of 2025 volume, yet e-commerce and mobile commerce are climbing at a 16.11% CAGR, narrowing the gap each year. Merchants therefore accelerate payment-orchestration investments that blend online and in-store acceptance inside one API to lower vendor complexity. Digital wallets accounted for 53% of online spend in 2025, lifted by “one-click” checkout and smartphone NFC. Cash’s share of in-store spend has fallen from 44% to 15% in a decade, freeing physical retailers to repurpose cash-office labor.
Within the global payments market, restaurants and quick-service operators deploy QR-based ordering that routes payments through e-commerce rails even while customers sit in-store. Wearables extend the notion of card present to watches and rings, raising the need for tokenization at the edge. Payment service providers differentiate on orchestration dashboards that expose granular approval, retry, and cost data, enabling CFOs to treat payments as a managed P&L line item rather than a binary pass/fail utility.
By Transaction Type:
P2P Adoption Erodes C2B Share at the MarginConsumer-to-business flows remained dominant at 62.35% in 2025, but P2P transfers clock a 13.29% CAGR on the back of wallet interoperability and faster-payment clearing. Freelance wages, micro-investing, and social commerce all favor instant disbursement schemes, creating adjacent lending-and-savings flywheels inside wallets. Cross-border P2P grows fastest as migrant-led remittances route through wallet corridors that undercut legacy corridors by half on fees.
For the global payments market size attached to P2P, API-centric aggregators link domestic faster-payment systems across multiple jurisdictions, creating quasi-real-time corridors for sub-USD 1,000 transfers. Regulators welcome the heightened transparency versus informal hawala channels, albeit with sharper AML oversight. Card networks continue to monetize P2P through push-to-card programs, but volumes risk migrating to pure account proxies if banks accelerate open-banking functionality.

By End-user Industry:
Healthcare Digitalization Unlocks New Acceptance ModelsRetail still accounted for a 34.55% revenue share in 2025 thanks to ubiquitous acceptance, but healthcare is forecast to post a 13.98% CAGR through 2031 as telehealth and patient-centric portals mature. Providers deploy wallet-based installments that remove friction from high-deductible payments, while insurers adopt instant payout for claims, shrinking days-sales-outstanding. Entertainment, digital content, and gaming ride the subscription wave, adding micro-payment rails for in-app commerce.
In the global payments market, utilities and governments upgrade citizen interfaces with QR codes and wallets, reducing check processing costs. Hospitality chains link room keys to tokenized cards, enabling contactless loyalty accrual and instant tip payouts. The common denominator is embedded finance—payment functionality subsumed into vertical software—boosting retention for software vendors and diversifying revenue for acquirers.
Geography Analysis
APAC Payments Market
Asia-Pacific led the global payments market with 37.62% revenue in 2025, propelled by China’s wallet duopoly and India’s UPI scaling beyond 100 billion annual transactions. Wallet penetration across Southeast Asia accelerates because merchants adopt dynamic QR standards that interoperate across schemes. Regional governments continue piloting central-bank digital currencies for retail use, which could further elevate account-based flows over cards.
MEA Payments Market
The Middle East & Africa segment delivers the fastest 15.12% CAGR to 2031 as mobile-money operators convert cash-heavy populations through agent networks and lightweight KYC. The Pan-African Payment and Settlement System promises intra-African instant payments in local currencies, a structural boost for small-business trade. Gulf regulators push open-banking mandates and explore a digital dirham, drawing global payment processors to establish regional hubs.
North America, Europe and LATAM Payments Market
North America sustains high average ticket sizes on credit cards, yet FedNow’s real-time rails create an alternate domestic path for bill payments and gig-economy payouts. Europe prioritizes cost-reduction and sovereignty through the European Payments Initiative’s Wero wallet, while transit networks leverage contactless ticketing to lift card volume. Latin America sees Brazil’s PIX benchmark incentivizing peers like Colombia and Peru to fast-track instant-payment programs, while CBDC pilots explore offline wallets for financial-inclusion goals.

Competitive Landscape
The global payments market exhibits medium concentration as card networks, fintech wallets, Big Tech super-apps, and government rails jostle for adjacent value pools. Visa and Mastercard retain a structural advantage in cross-border and premium credit, but their combined share faces steady dilution from account-to-account rails and domestic wallet schemes. Both networks invest in multi-rail capabilities—Visa Direct and Mastercard Send—to remain integral to money-movement irrespective of instrument.
Fintech acquirers such as Stripe and Adyen converge on orchestration, real-time risk scoring, and alternative‐payment enablement to capture enterprise merchants seeking a single payments operating system. Regional switches like India’s NPCI and Brazil’s Banco Central operate as public utilities, compelling private-sector processors to layer data analytics and credit products on top of commoditized clearing. Blockchain patents from incumbents, including American Express for reward-point tokenization, indicate that intellectual-property positioning complements scale economics.
M&A demonstrates a pivot toward ecosystem breadth: Capital One’s USD 35.3 billion purchase of Discover secures an in-house network at issuer economics, while Global Payments’ USD 22.7 billion Worldpay deal deepens merchant breadth. Strategic partnerships—Payrails with Mastercard for enterprise orchestration and eBay with Checkout.com for multi-rail acquiring—highlight competition shifting from pure processing to differentiated servicing of industry verticals.
Payments Industry Leaders
Mastercard Inc.
Visa Inc.
PayPal Holdings, Inc.
China UnionPay Co., Ltd.
American Express Company
- *Disclaimer: Major Players sorted in no particular order
Payments Market Companies Covered in this Report
- Visa Inc.
- Mastercard Incorporated
- China UnionPay Co., Ltd.
- Ant Group Co., Ltd. (Alipay)
- PayPal Holdings, Inc.
- Apple Inc. (Apple Pay)
- Google LLC (Google Pay)
- Amazon.com, Inc. (Amazon Pay)
- American Express Company
- Adyen N.V.
- Stripe, Inc.
- Block, Inc. (Square & Afterpay)
- Worldline SA
- Fidelity National Information Services, Inc. (FIS)
- Fiserv, Inc.
- Global Payments Inc.
- Klarna Bank AB
- Razorpay Software Pvt. Ltd.
- PayU Payments Pvt. Ltd.
- Revolut Ltd.

Recent Industry Developments in Payments Market
- June 2025: Visa posted USD 9.6 billion net revenue and rolled out stablecoin settlement on its network, aligning its multi-rail strategy with treasury demand for 24/7 clearing.
- May 2025: Capital One completed the USD 35.3 billion Discover acquisition, integrating issuer, acquirer, and network capabilities to defend interchange economics in a tightening regulatory climate.
- April 2025: Global Payments acquired Worldpay for USD 22.7 billion and divested its issuer unit, doubling down on merchant solutions while unlocking cross-sell of analytics and loyalty add-ons.
- April 2025: eBay selected Checkout.com as global acquiring partner across 190 markets, streamlining shopper experience and reducing acceptance cost through direct local-method connections.


Global Payments Market Report Scope
The payments market is segmented by mode of payment (point of sale [card payment [debit card, credit card, bank financing card], digital wallet [mobile wallets], other modes of payment [cash on delivery, bank transfer, buy now pay later]), (online sale (card payment [debit card, credit card, bank financing card], digital wallet [Mobile Wallets], other online sales [cash on delivery, bank transfer, buy now pay later]), by end-user industries (retail, entertainment, healthcare, hospitality) and geography (North America, Europe, Asia-Pacific, Latin America, Middle East and Africa).
The report offers market forecasts and size in value (USD) for all the above segments.
Segmentation Overview
By Mode of Payment
| Point-of-Sale | Card (Debit, Credit, Pre-paid) |
| Digital Wallets (Apple Pay, Google Pay, Interac Flash) | |
| Cash | |
| Other POS (Gift-cards, QR, Wearables) | |
| Online | Card (Card-Not-Present) |
| Digital Wallet & Account-to-Account (Interac e-Transfer, PayPal) | |
| Other Online (COD, BNPL, Bank Transfer) |
By Interaction Channel
| Point-of-Sale |
| E-commerce/M-commerce |
By Transaction Type
| Person-to-Person (P2P) |
| Consumer-to-Business (C2B) |
| Business-to-Business (B2B) |
| Remittances & Cross-border |
By End-user Industry
| Retail |
| Entertainment & Digital Content |
| Healthcare |
| Hospitality & Travel |
| Government & Utilities |
| Other End-user Industries |
By Geography
| North America | United States |
| Canada | |
| Mexico | |
| Europe | Germany |
| United Kingdom | |
| France | |
| Nordics | |
| Rest of Europe | |
| Asia-Pacific | China |
| India | |
| Japan | |
| Rest of Asia-Pacific | |
| South America | Brazil |
| Argentina | |
| Rest of South America | |
| Middle East | United Arab Emirates |
| Saudi Arabia | |
| Rest of Middle East | |
| Africa | South Africa |
| Nigeria | |
| Rest of Africa |
| By Mode of Payment | Point-of-Sale | Card (Debit, Credit, Pre-paid) |
| Digital Wallets (Apple Pay, Google Pay, Interac Flash) | ||
| Cash | ||
| Other POS (Gift-cards, QR, Wearables) | ||
| Online | Card (Card-Not-Present) | |
| Digital Wallet & Account-to-Account (Interac e-Transfer, PayPal) | ||
| Other Online (COD, BNPL, Bank Transfer) | ||
| By Interaction Channel | Point-of-Sale | |
| E-commerce/M-commerce | ||
| By Transaction Type | Person-to-Person (P2P) | |
| Consumer-to-Business (C2B) | ||
| Business-to-Business (B2B) | ||
| Remittances & Cross-border | ||
| By End-user Industry | Retail | |
| Entertainment & Digital Content | ||
| Healthcare | ||
| Hospitality & Travel | ||
| Government & Utilities | ||
| Other End-user Industries | ||
| By Geography | North America | United States |
| Canada | ||
| Mexico | ||
| Europe | Germany | |
| United Kingdom | ||
| France | ||
| Nordics | ||
| Rest of Europe | ||
| Asia-Pacific | China | |
| India | ||
| Japan | ||
| Rest of Asia-Pacific | ||
| South America | Brazil | |
| Argentina | ||
| Rest of South America | ||
| Middle East | United Arab Emirates | |
| Saudi Arabia | ||
| Rest of Middle East | ||
| Africa | South Africa | |
| Nigeria | ||
| Rest of Africa | ||


Key Questions Answered in the Report
What is the current size of the global payments market in 2026?
The global payments market size is USD 49.10 trillion in 2026 and is forecast to reach USD 60.35 trillion by 2031.
Why are healthcare payments growing so quickly?
Telemedicine adoption and patient-centric digital platforms reduce administrative friction and drive a projected 13.98% CAGR through 2031.
Which region holds the largest share of the global payments market?
Asia-Pacific leads with 37.62% market share, driven by digital wallet dominance and instant-payment rails.
Which payment channel is growing the fastest?
E-commerce and mobile commerce channels are expanding at a 16.11% CAGR as consumers increasingly shop through digital interfaces.
How are interchange caps affecting issuers?
Fee ceilings in the EU and India compress traditional card margins by up to 70%, pushing issuers toward data services and premium cross-border segments.
What strategic moves are card networks making to stay competitive?
Visa and Mastercard invest heavily in AI-driven fraud defenses, stablecoin settlement, and multi-rail push-payment services to maintain relevance amid wallet and A2A growth.
Page last updated on:


