Market Overview
| Study Period | 2018 - 2031 |
|---|---|
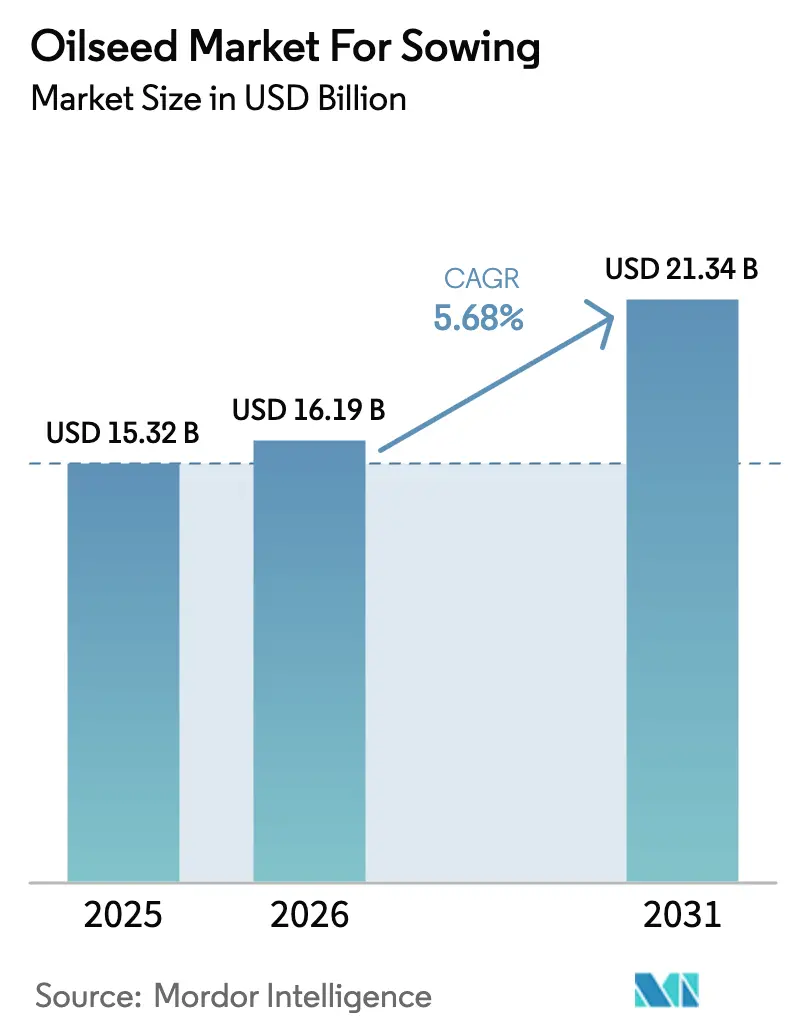
| Market Size (2026) | USD 16.19 Billion |
| Market Size (2031) | USD 21.34 Billion |
| Growth Rate (2026 - 2031) | 5.68% CAGR |
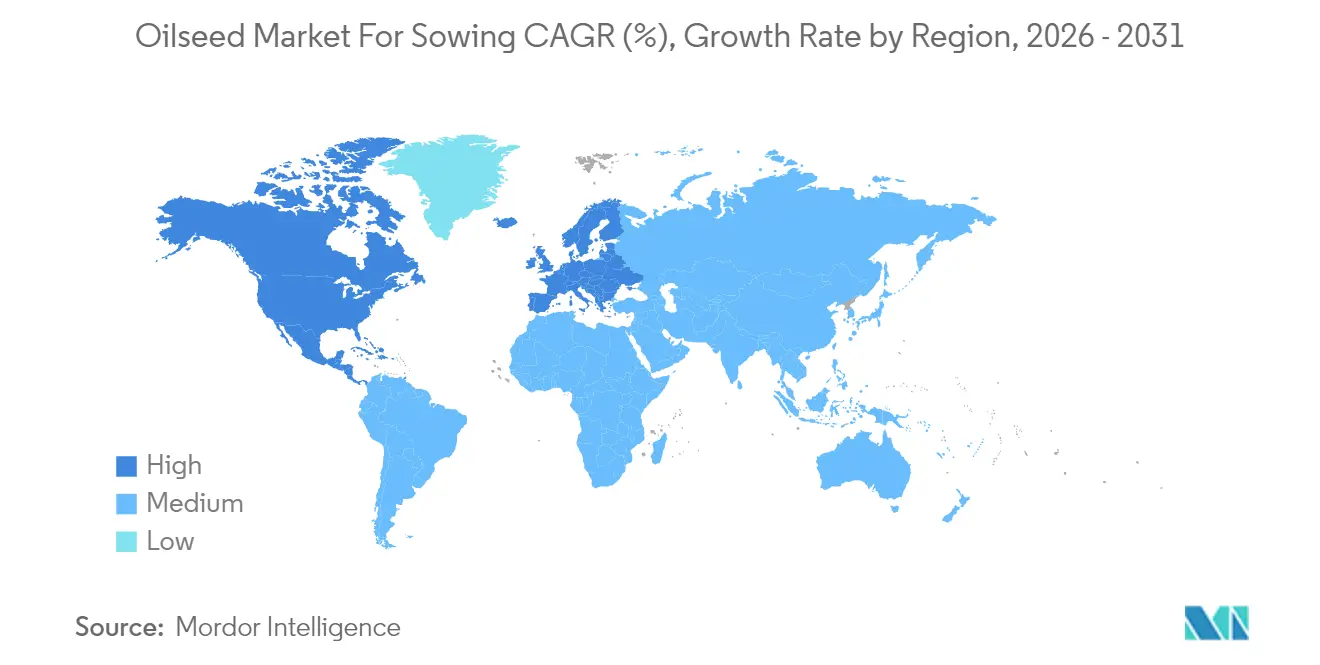
| Fastest Growing Market | Europe |
| Largest Market | North America |
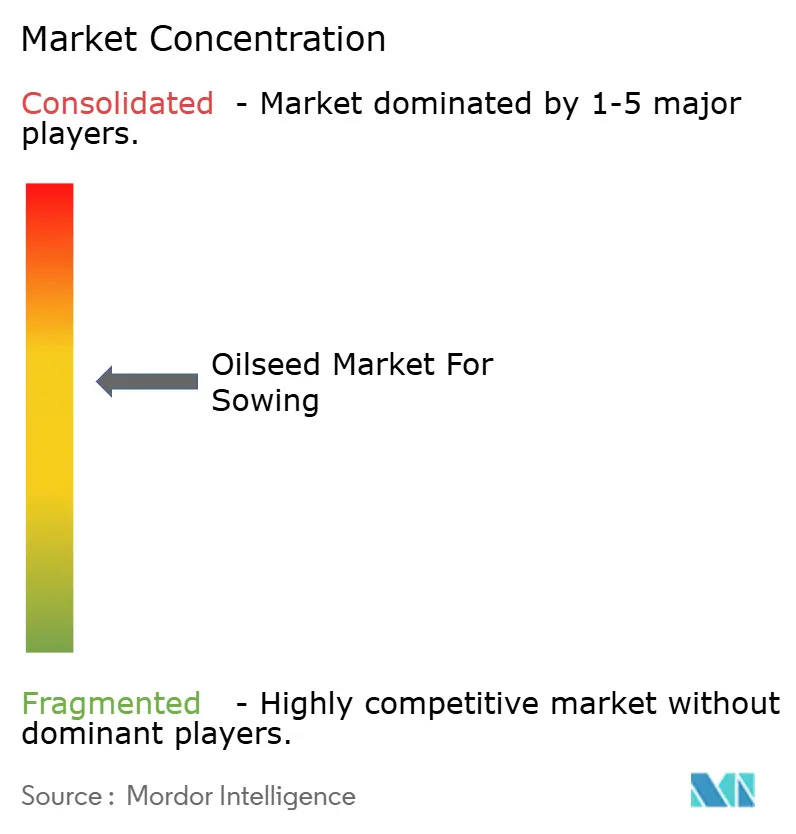
| Market Concentration | Medium |
Major Players *Disclaimer: Major Players sorted in no particular order Image © Mordor Intelligence. Reuse requires attribution under CC BY 4.0. | |
Oilseed for Sowing Market Analysis by Mordor Intelligence
The oilseed market size for sowing size in 2026 is estimated at USD 16.19 billion, growing from 2025 value of USD 15.32 billion with 2031 projections showing USD 21.34 billion, growing at 5.68% CAGR over 2026-2031. Current growth reflects robust biofuel demand, rapid trait innovation, and sustained government incentives that reward high-oil hybrids. Escalating adoption of herbicide-tolerant and insect-resistant technologies reduces production risk, while AI-enabled phenotyping compresses breeding cycles and speeds new varietal releases. Renewable diesel mandates in the United States and European Union keep crushers operating at high utilization, anchoring seed demand even when feedstock prices soften. Competitive dynamics favor breeders with integrated R&D pipelines and digital agronomy platforms that help growers match hybrids to micro-climates. Despite fertilizer price swings and periodic regulatory pushback on transgenics, the Oilseed for Sowing Market remains positive for farmer economics in most producing regions.
Key Report Takeaways
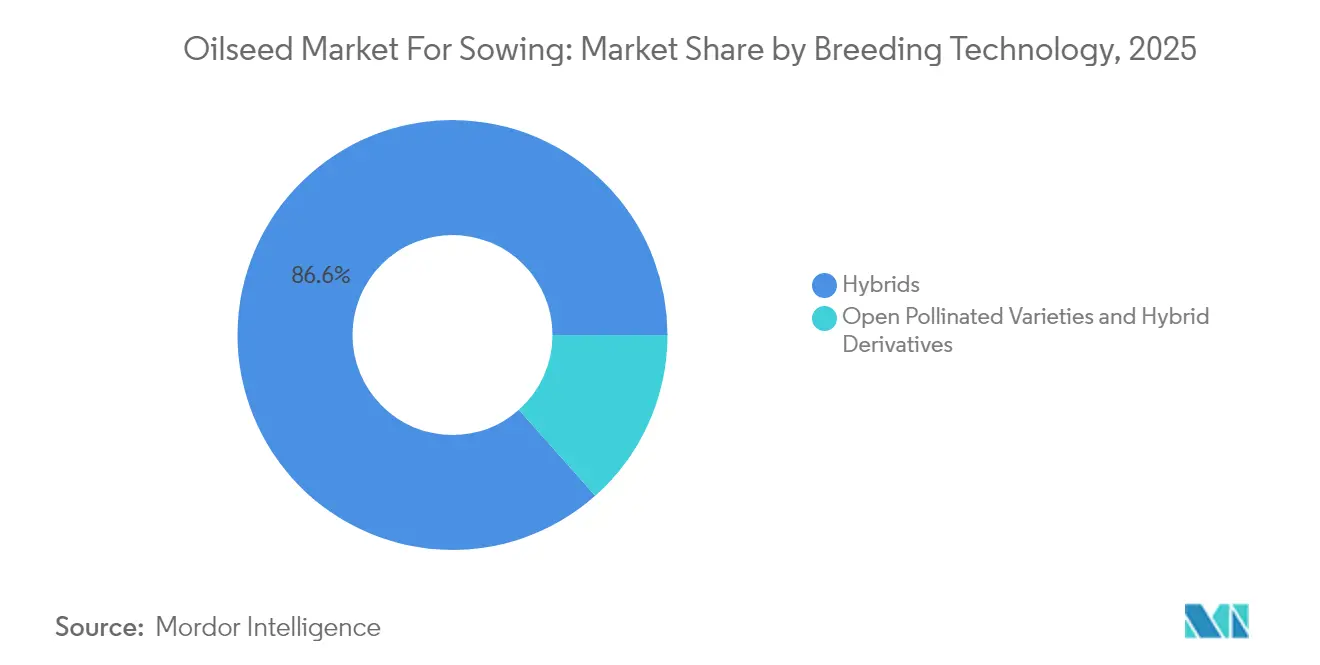
- By breeding technology, hybrids captured 86.55% revenue share of the Oilseed for Sowing Market in 2025, while hybrids are advancing at a 6.03% CAGR to 2031.
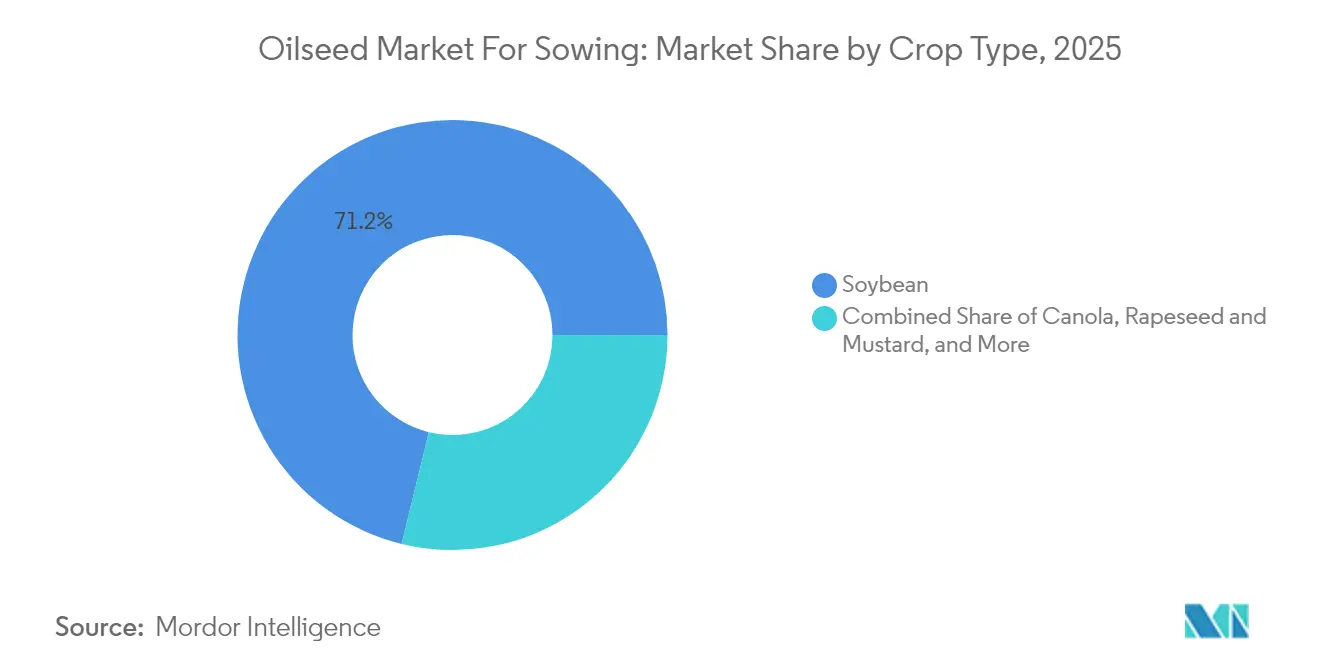
- By crop, soybean commanded 71.20% share of the Oilseed for Sowing Market size in 2025 and is projected to expand at 6.08% CAGR through 2031.
- By geography, North America held 39.40% of the Oilseed for Sowing Market share in 2025, whereas Europe records the highest regional CAGR at 6.06% to 2031.
Note: Market size and forecast figures in this report are generated using Mordor Intelligence’s proprietary estimation framework, updated with the latest available data and insights as of 2026.
Global Oilseed for Sowing Market Trends and Insights
Drivers Impact Analysis*
| Driver | (~) % Impact on CAGR Forecast | Geographic Relevance | Impact Timeline |
|---|---|---|---|
| Demand for edible oils and biofuel feedstocks | +1.8% | North America and Europe lead, global spill-over | Medium term (2-4 years) |
| Adoption of herbicide-tolerant and insect-resistant traits | +1.2% | North America, South America, Asia-Pacific | Short term (≤ 2 years) |
| Government incentives for renewable diesel and high-oil crops | +1.0% | United States and European Union | Medium term (2-4 years) |
| AI-enabled phenotyping accelerating hybrid cycles | +0.7% | Early adoption in North America and Europe | Long term (≥ 4 years) |
| Carbon-credit premiums for low-emission varieties | +0.5% | Europe and North America, and emerging Asia-Pacific | Long term (≥ 4 years) |
| CRISPR-based high-oleic hybrids improving crusher margins | +0.6% | Regulatory uptake varies by region | Medium term (2-4 years) |
| Source: Mordor Intelligence | |||


Demand for Edible Oils and Biofuel Feedstocks
Rising global consumption of vegetable oils, coupled with renewable diesel mandates, creates sustained upward pressure on oilseed planting decisions across major producing regions. The United States Renewable Fuel Standard requires 36 billion gallons of renewable fuel annually, with renewable diesel accounting for an increasing share due to its superior cold-weather performance compared to biodiesel[1]Source: U.S. Environmental Protection Agency, “Renewable Fuel Standard Program,” epa.gov. European renewable diesel capacity reached 3.2 million metric tons in 2024, driving demand for high-oleic rapeseed and camelina varieties that meet stringent sustainability criteria under the European Union Taxonomy Regulation. This demand convergence between food and fuel applications creates price premiums for oilseed varieties with enhanced oil content and composition, incentivizing farmers to adopt premium hybrid seeds despite higher upfront costs. The trend is particularly pronounced in regions with established crushing infrastructure, where processors offer contract premiums for specific oil profiles that meet renewable diesel specifications.
Adoption of Herbicide-Tolerant and Insect-Resistant Traits
Transgenic traits continue expanding their footprint in oilseed production systems, with herbicide tolerance providing the most immediate economic benefits through simplified weed management protocols. Glyphosate-tolerant soybeans now represent over 95% of United States plantings, while dicamba-tolerant varieties gained 15% adoption in 2024 despite regulatory restrictions. Brazil's approval of additional herbicide-tolerant soybean events in 2024 expanded farmer options for managing resistant weed populations, particularly in the Cerrado region where continuous soybean-corn rotations intensify selection pressure. Insect-resistant traits show accelerating adoption in regions facing lepidopteran pressure, with Bt-expressing canola varieties gaining traction in Canadian Prairie provinces where diamondback moth populations developed resistance to conventional insecticides. The economic value proposition remains compelling, with trait premiums typically recovered through reduced input costs and yield protection benefits that become more pronounced during pest outbreak years.
Government Incentives for Renewable Diesel and High-Oil Crops
Policy frameworks increasingly favor oilseed varieties that deliver enhanced environmental outcomes, creating market premiums that justify higher seed costs for farmers. California's Low Carbon Fuel Standard provides carbon intensity credits that can add USD 0.50 per gallon to renewable diesel values, translating to significant premiums for feedstocks with verified low-carbon production practices. The European's Fit for 55 package establishes binding targets for renewable energy in transport, with advanced biofuels from high-oleic crops receiving double counting toward compliance obligations. These policy mechanisms create direct economic incentives for seed companies to develop varieties with enhanced oil content and improved sustainability profiles. State-level programs in the US Midwest offer cost-share assistance for cover crop adoption, benefiting oilseed species like pennycress and camelina that can be integrated into existing rotation systems without displacing food crops.
AI-Enabled Phenotyping Accelerating Hybrid Cycles
Machine learning algorithms applied to high-throughput phenotyping platforms are compressing breeding cycle times from 8-10 years to 5-6 years for major oilseed crops, enabling faster trait introgression and variety development. Corteva's deployment of drone-based imaging systems across 200 breeding locations captures plant architecture, stress responses, and maturity patterns at an unprecedented scale, feeding predictive models that identify superior genetic combinations earlier in the breeding pipeline. Bayer's FieldView platform integrates satellite imagery with ground-truth data to optimize hybrid placement recommendations, improving yield outcomes by 3-5% through better genotype-environment matching. These technological advances reduce the time and cost required to bring new varieties to market, particularly benefiting traits that require complex genetic backgrounds such as high-oleic oil profiles and enhanced protein content. The competitive advantage accrues to companies with sufficient scale to invest in digital infrastructure and data analytics capabilities that can process phenotypic information across diverse environments.
Restraints Impact Analysis*
| Restraint | (~) % Impact on CAGR Forecast | Geographic Relevance | Impact Timeline |
|---|---|---|---|
| Volatile fertilizer and agrochemical costs | -0.8% | Strongest headwinds in developing regions | Short term (≤ 2 years) |
| Regulatory and consumer pushback on transgenics | -0.6% | Europe, selective Asia-Pacific markets | Medium term (2-4 years) |
| Regional crusher concentration risk | -0.4% | Specific river-port corridors | Medium term (2-4 years) |
| Synthetic biology oils displacing traditional demand | -0.3% | Specialty industrial channels worldwide | Long term (≥ 4 years) |
| Source: Mordor Intelligence | |||
Volatile Fertilizer and Agrochemical Costs
Input cost volatility creates significant headwinds for seed market expansion as farmers delay variety upgrades when fertilizer and pesticide expenses consume larger budget shares. Nitrogen fertilizer prices experienced 40% volatility in 2024 due to natural gas supply disruptions and geopolitical tensions affecting major producing regions [2]Source: International Fertilizer Association, “Fertilizer Outlook 2024-2028,” fertilizer.org. This price instability forces farmers to prioritize immediate input needs over longer-term investments in premium seed genetics, particularly in developing markets where credit access remains limited. Glyphosate price increases of 25% in key South American markets during 2024 reduced adoption rates for herbicide-tolerant varieties as the total system cost exceeded farmer budget thresholds. The impact is most pronounced for hybrid seeds that command premium pricing, as farmers revert to saved seed or open-pollinated varieties during periods of input cost stress. Regional variations in input cost inflation create competitive distortions, with farmers in high-cost regions facing disadvantages relative to producers in markets with subsidized input access.
Regulatory and Consumer Pushback on Transgenics
Regulatory approval delays and consumer resistance to genetically modified crops create market access barriers that limit the commercial potential of transgenic oilseed varieties in key regions. The European Union's stringent approval process for GM crops resulted in only 2 new oilseed events receiving cultivation approval between 2020-2024, compared to 15 approvals in the same period for North America. Consumer preference for non-GM products in European markets maintains price premiums for conventional varieties, reducing economic incentives for farmers to adopt transgenic alternatives despite potential yield advantages. Similar patterns emerge in parts of Asia-Pacific, where Japan and South Korea maintain restrictive import protocols for GM oilseeds that limit variety development investments by multinational seed companies. The regulatory complexity creates market fragmentation that increases compliance costs and reduces the scale economies available to seed developers, particularly for traits with region-specific benefits that may not justify global development investments.
*Our forecasts treat driver/restraint impacts as directional, not additive. The impact forecasts reflect baseline growth, mix effects, and variable interactions.
Segment Analysis
By Breeding Technology: Transgenic Traits Drive Market Evolution
Hybrids retained 86.55% share of the Oilseed for Sowing Market in 2025. The hybrid portion of the Oilseed for Sowing Market size climbs at 6.03% CAGR as growers emphasize yield stability and trait stacking. Transgenic hybrids widen the technology gap by bundling herbicide tolerance, insect resistance, and oil-quality profiles. Open-pollinated varieties remain relevant in subsistence systems where saved seed lowers cash costs, yet their share continues to erode. CRISPR-edited hybrids blur regulatory lines, allowing rapid commercial gains without GMO labeling hurdles. Suppliers with strong trait portfolios and seed-conditioning assets capture a disproportionate slice of the Oilseed for Sowing Market.
These conventional varieties serve as genetic reservoirs for breeding programs and provide cost-effective options for subsistence farming systems in developing markets. CRISPR-based genome editing is emerging as a disruptive force that could blur traditional boundaries between transgenic and non-transgenic categories, with several gene-edited oilseed varieties approaching commercial release in markets where regulatory frameworks treat them as conventional crops rather than genetically modified crops. The regulatory distinction between transgenic and gene-edited varieties will likely influence future market segmentation patterns as different jurisdictions adopt varying approval standards.


By Crop: Soybean Dominance Faces Emerging Competition
Soybean commands 71.20% market share of the Oilseed for Sowing Market in 2025 and projects a 6.08% CAGR through 2031, benefiting from established processing infrastructure and dual-use applications in food and industrial markets. The crop's market leadership stems from its high protein content, favorable oil composition for biodiesel production, and extensive global trade networks that provide price discovery and risk management tools for producers. Canola, rapeseed, and mustard collectively represent the second-largest segment, with canola experiencing particularly strong growth in renewable diesel applications due to its high-oleic acid content and cold-weather adaptability that extends growing regions into northern latitudes.
The segment's leadership position is reinforced by soybeans' versatility in applications ranging from food processing to animal feed and biodiesel production. North America and South America are the primary contributors to this segment's growth, together accounting for over 75% of the global soybean cultivation area. The segment's growth is further propelled by the increasing adoption of herbicide-tolerant and insect-resistant hybrid varieties, particularly in major producing countries. Additionally, the rising demand from processing industries and wider adoption of advanced traits in major soybean-growing regions continues to strengthen this segment's market position in the Oilseed for Sowing Market.
Geography Analysis
North America maintains its leadership position with 39.40% market share of the Oilseed for Sowing Market in 2025, supported by extensive transgenic trait adoption and established crushing capacity that creates consistent demand for premium oilseed varieties. United States farmers planted 87 million acres of soybeans in 2024, with 95% adopting herbicide-tolerant varieties that simplify weed management in no-till systems . Canada's canola industry benefits from strong export demand to Asia and growing renewable diesel capacity that creates domestic processing opportunities. Mexico's oilseed sector remains import-dependent but shows increasing interest in domestic production expansion supported by government programs that provide technical assistance and credit access to smallholder farmers.
Europe is posting the fastest regional growth at 6.06% CAGR, propelled by sustainability regulations that favor high-oleic rapeseed varieties for renewable diesel production. The European Union Farm to Fork Strategy establishes targets for organic farming expansion and pesticide reduction that influence variety selection toward crops with enhanced disease resistance and nutrient use efficiency. Germany and France lead regional production with established rapeseed processing clusters that provide price premiums for specific oil quality attributes. The region's growth trajectory depends on successful navigation of evolving regulatory frameworks for gene-edited crops, where recent policy developments suggest potential relaxation of restrictions that could accelerate innovation adoption.
Asia-Pacific represents significant market share driven by China's strategic emphasis on oilseed self-sufficiency and India's expanding cultivation programs. China's soybean imports exceeded 100 million metric tons in 2024, creating food security concerns that drive domestic production incentives and research investments in yield-enhancing varieties. India's National Mission on Oilseeds and Oil Palm targets 10 million hectare expansion by 2030, supported by minimum support prices and technology transfer programs that encourage adoption of high-yielding varieties. The region's growth potential is constrained by fragmented farm structures and limited access to modern seed genetics in some markets, but digital agriculture platforms are beginning to address these challenges through direct-to-farmer distribution models and mobile-based advisory services.

Competitive Landscape
The Oilseed for Sowing Market demonstrates a consolidated structure where multinational agrochemical and seed companies dominate through their extensive research capabilities and broad product portfolios. These global leaders Bayer AG, Corteva Agriscience, Syngenta Group, BASF SE, KWS SAAT SE & Co. KGaA are leverage their integrated operations spanning research, production, and distribution to maintain market position, while regional players focus on specific crops or geographical markets where they have established strengths. The market features a mix of diversified agricultural conglomerates and specialized seed companies, with the former holding an advantage through their ability to offer comprehensive agricultural solutions, including crop protection and digital farming services.
The industry has witnessed significant consolidation through mergers and acquisitions, particularly among larger players seeking to expand their technological capabilities and geographical reach. Companies are increasingly focusing on acquiring smaller, innovative seed companies to enhance their germplasm libraries and access new markets. Regional players maintain their relevance through strong local distribution networks and a deep understanding of specific market needs, often collaborating with global leaders for technology access while maintaining their market position through specialized offerings and strong farmer relationships.
Success in the oilseeds market increasingly depends on companies' ability to develop climate-resilient varieties while adapting to changing regulatory landscapes and consumer preferences. Market leaders are investing in advanced breeding technologies and digital solutions to enhance product development efficiency and provide value-added services to farmers. Companies must balance their investment in transgenic and non-transgenic varieties to address varying regional regulations and market demands, while also focusing on sustainability initiatives to meet growing environmental concerns.
Oilseed for Sowing Industry Leaders
Bayer AG
Corteva Agriscience
Syngenta Group
BASF SE
KWS SAAT SE & Co. KGaA
- *Disclaimer: Major Players sorted in no particular order

Recent Industry Developments
- July 2023: BASF expanded its Xitavo soybean seed portfolio with the addition of its 11 new high-yielding varieties for the 2024 growing season, featuring the Enlist E3 technology to combat difficult weeds.
- July 2023: Pacific Seeds, a subsidiary of Advanta Seeds, introduced two new canola hybrid varieties, Hyola Defender CT and Hayola Continuum CL, to the Australian market. These varieties offer high-yield performance, strong disease resistance, elevated oil content, and enhanced weed control flexibility.
- June 2023: Syngenta Seeds launched a new conventional soybean brand, "Silverline," into the Canadian market. This brand offers high-protein soybeans and NK-treated soybean varieties.


Global Oilseed for Sowing Market Report Scope
Hybrids, Open Pollinated Varieties & Hybrid Derivatives are covered as segments by Breeding Technology. Canola, Rapeseed & Mustard, Soybean, Sunflower are covered as segments by Crop. Africa, Asia-Pacific, Europe, Middle East, North America, South America are covered as segments by Region.Breeding Technology
| Hybrids | Non-Transgenic Hybrids | |
| Transgenic Hybrids | Herbicide Tolerant Hybrids | |
| Insect Resistant Hybrids | ||
| Other Traits | ||
| Open Pollinated Varieties & Hybrid Derivatives | ||
Crop
| Canola, Rapeseed & Mustard |
| Soybean |
| Sunflower |
| Other Oilseeds |
Geography
| Africa | By Breeding Technology | |
| By Country | Egypt | |
| Ethiopia | ||
| Ghana | ||
| Kenya | ||
| Nigeria | ||
| South Africa | ||
| Tanzania | ||
| Rest of Africa | ||
| Asia-Pacific | By Breeding Technology | |
| Australia | ||
| Bangladesh | ||
| China | ||
| India | ||
| Indonesia | ||
| Japan | ||
| Myanmar | ||
| Philippines | ||
| Thailand | ||
| Vietnam | ||
| Rest of Asia-Pacific | ||
| Europe | By Breeding Technology | |
| France | ||
| Germany | ||
| Italy | ||
| Netherlands | ||
| Poland | ||
| Romania | ||
| Russia | ||
| Spain | ||
| Turkey | ||
| Ukraine | ||
| United Kingdom | ||
| Rest of Europe | ||
| Middle East | By Breeding Technology | |
| Iran | ||
| Saudi Arabia | ||
| Rest of Middle East | ||
| North America | By Breeding Technology | |
| Canada | ||
| Mexico | ||
| United States | ||
| Rest of North America | ||
| South America | By Breeding Technology | |
| Argentina | ||
| Brazil | ||
| Rest of South America | ||
| Breeding Technology | Hybrids | Non-Transgenic Hybrids | |
| Transgenic Hybrids | Herbicide Tolerant Hybrids | ||
| Insect Resistant Hybrids | |||
| Other Traits | |||
| Open Pollinated Varieties & Hybrid Derivatives | |||
| Crop | Canola, Rapeseed & Mustard | ||
| Soybean | |||
| Sunflower | |||
| Other Oilseeds | |||
| Geography | Africa | By Breeding Technology | |
| By Country | Egypt | ||
| Ethiopia | |||
| Ghana | |||
| Kenya | |||
| Nigeria | |||
| South Africa | |||
| Tanzania | |||
| Rest of Africa | |||
| Asia-Pacific | By Breeding Technology | ||
| Australia | |||
| Bangladesh | |||
| China | |||
| India | |||
| Indonesia | |||
| Japan | |||
| Myanmar | |||
| Philippines | |||
| Thailand | |||
| Vietnam | |||
| Rest of Asia-Pacific | |||
| Europe | By Breeding Technology | ||
| France | |||
| Germany | |||
| Italy | |||
| Netherlands | |||
| Poland | |||
| Romania | |||
| Russia | |||
| Spain | |||
| Turkey | |||
| Ukraine | |||
| United Kingdom | |||
| Rest of Europe | |||
| Middle East | By Breeding Technology | ||
| Iran | |||
| Saudi Arabia | |||
| Rest of Middle East | |||
| North America | By Breeding Technology | ||
| Canada | |||
| Mexico | |||
| United States | |||
| Rest of North America | |||
| South America | By Breeding Technology | ||
| Argentina | |||
| Brazil | |||
| Rest of South America | |||


Market Definition
- Commercial Seed - For the purpose of this study, only commercial seeds have been included as part of the scope. Farm-saved Seeds, which are not commercially labeled are excluded from scope, even though a minor percentage of farm-saved seeds are exchanged commercially among farmers. The scope also excludes vegetatively reproduced crops and plant parts, which may be commercially sold in the market.
- Crop Acreage - While calculating the acreage under different crops, the Gross Cropped Area has been considered. Also known as Area Harvested, according to the Food & Agricultural Organization (FAO), this includes the total area cultivated under a particular crop across seasons.
- Seed Replacement Rate - Seed Replacement Rate is the percentage of area sown out of the total area of crop planted in the season by using certified/quality seeds other than the farm-saved seed.
- Protected Cultivation - The report defines protected cultivation as the process of growing crops in a controlled environment. This includes greenhouses, glasshouses, hydroponics, aeroponics, or any other cultivation system that protects the crop against any abiotic stress. However, cultivation in an open field using plastic mulch is excluded from this definition and is included under open field.
| Keyword | Definition |
|---|---|
| Row Crops | These are usually the field crops which include the different crop categories like grains & cereals, oilseeds, fiber crops like cotton, pulses, and forage crops. |
| Solanaceae | These are the family of flowering plants which includes tomato, chili, eggplants, and other crops. |
| Cucurbits | It represents a gourd family consisting of about 965 species in around 95 genera. The major crops considered for this study include Cucumber & Gherkin, Pumpkin and squash, and other crops. |
| Brassicas | It is a genus of plants in the cabbage and mustard family. It includes crops such as carrots, cabbage, cauliflower & broccoli. |
| Roots & Bulbs | The roots and bulbs segment includes onion, garlic, potato, and other crops. |
| Unclassified Vegetables | This segment in the report includes the crops which don’t belong to any of the above-mentioned categories. These include crops such as okra, asparagus, lettuce, peas, spinach, and others. |
| Hybrid Seed | It is the first generation of the seed produced by controlling cross-pollination and by combining two or more varieties, or species. |
| Transgenic Seed | It is a seed that is genetically modified to contain certain desirable input and/or output traits. |
| Non-Transgenic Seed | The seed produced through cross-pollination without any genetic modification. |
| Open-Pollinated Varieties & Hybrid Derivatives | Open-pollinated varieties produce seeds true to type as they cross-pollinate only with other plants of the same variety. |
| Other Solanaceae | The crops considered under other Solanaceae include bell peppers and other different peppers based on the locality of the respective countries. |
| Other Brassicaceae | The crops considered under other brassicas include radishes, turnips, Brussels sprouts, and kale. |
| Other Roots & Bulbs | The crops considered under other roots & bulbs include Sweet Potatoes and cassava. |
| Other Cucurbits | The crops considered under other cucurbits include gourds (bottle gourd, bitter gourd, ridge gourd, Snake gourd, and others). |
| Other Grains & Cereals | The crops considered under other grains & cereals include Barley, Buck Wheat, Canary Seed, Triticale, Oats, Millets, and Rye. |
| Other Fibre Crops | The crops considered under other fibers include Hemp, Jute, Agave fibers, Flax, Kenaf, Ramie, Abaca, Sisal, and Kapok. |
| Other Oilseeds | The crops considered under other oilseeds include Ground nut, Hempseed, Mustard seed, Castor seeds, safflower seeds, Sesame seeds, and Linseeds. |
| Other Forage Crops | The crops considered under other forages include Napier grass, Oat grass, White clover, Ryegrass, and Timothy. Other forage crops were considered based on the locality of the respective countries. |
| Pulses | Pigeon peas, Lentils, Broad and horse beans, Vetches, Chickpeas, Cowpeas, Lupins, and Bambara beans are the crops considered under pulses. |
| Other Unclassified Vegetables | The crops considered under other unclassified vegetables include Artichokes, Cassava Leaves, Leeks, Chicory, and String beans. |


Research Methodology
Mordor Intelligence follows a four-step methodology in all our reports.
- Step-1: IDENTIFY KEY VARIABLES: In order to build a robust forecasting methodology, the variables and factors identified in Step-1 are tested against available historical market numbers. Through an iterative process, the variables required for market forecast are set and the model is built on the basis of these variables.
- Step-2: Build a Market Model: Market-size estimations for the forecast years are in nominal terms. Inflation is not a part of the pricing, and the average selling price (ASP) is kept constant throughout the forecast period.
- Step-3: Validate and Finalize: In this important step, all market numbers, variables and analyst calls are validated through an extensive network of primary research experts from the market studied. The respondents are selected across levels and functions to generate a holistic picture of the market studied.
- Step-4: Research Outputs: Syndicated Reports, Custom Consulting Assignments, Databases, and Subscription Platforms


