Non-dairy Yogurt Market Size and Share
Market Overview
| Study Period | 2018 - 2031 |
|---|---|
| Forecast Data Period | 2026 - 2031 |
| Historical Data Period | 2018 - 2024 |
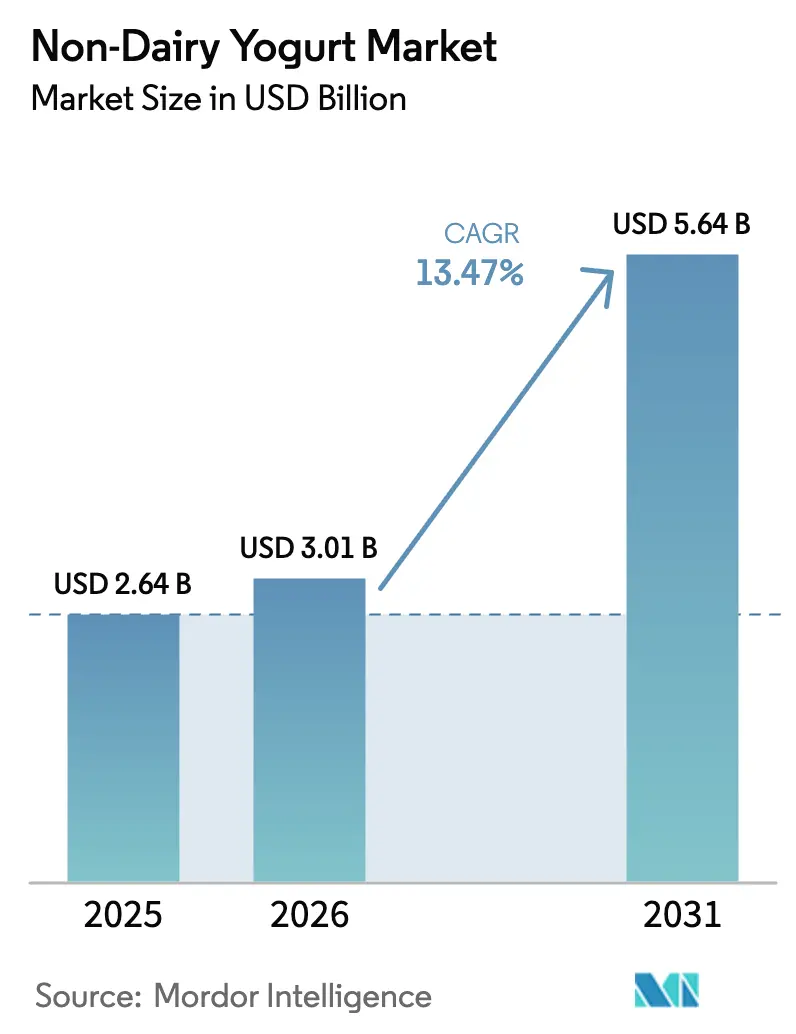
| Market Size (2026) | USD 3.01 Billion |
| Market Size (2031) | USD 5.64 Billion |
| Growth Rate (2026 - 2031) | 13.47% CAGR |
| Market Concentration | Medium |
Major Players*Disclaimer: Major Players sorted in no particular order Image © Mordor Intelligence. Reuse requires attribution under CC BY 4.0. | |
Non-dairy Yogurt Market Analysis by Mordor Intelligence
The Non-dairy Yogurt Market size was valued at USD 2.64 billion in 2025 and estimated to grow from USD 3.01 billion in 2026 to reach USD 5.64 billion by 2031, at a CAGR of 13.47% during the forecast period (2026-2031).
The non-dairy yogurt industry is experiencing a significant transformation in retail dynamics, driven by evolving consumer preferences and shopping behaviors. Off-trade retailing has emerged as the dominant distribution channel, demonstrating a notable growth of 6.84% from 2021, primarily attributed to enhanced consumer satisfaction and convenience factors. Retailers are adapting their strategies to accommodate this shift, implementing dedicated shelf spaces and specialized storage solutions for dairy-free products. The market has witnessed a remarkable evolution in pricing strategies, with products now available across various price points ranging from USD 2.55 to USD 16.4, making dairy-free yogurt accessible to different consumer segments.
Product innovation and diversification have become central to market development, with manufacturers introducing various flavors, including unsweetened, chocolate, and vanilla variants, to cater to diverse consumer preferences. The industry has witnessed substantial investment in research and development, focusing on improving the texture, taste, and nutritional profiles of plant-based yogurt alternatives. Specialty stores have gained significant traction by offering enhanced product visibility and detailed information about ingredients and nutritional benefits, contributing to informed consumer decision-making. This trend has been particularly impactful, with the global distribution segment projected to expand by 24.7% by 2025.
Consumer awareness and acceptance of plant-based dairy alternatives have reached unprecedented levels, evidenced by the fact that approximately 60% of UK consumers expressed interest in plant-based protein in 2022. The market has responded to this growing demand by expanding product portfolios and improving accessibility through various retail channels. Manufacturers are increasingly focusing on clean-label products and transparent ingredient sourcing, addressing the growing consumer demand for healthier and more sustainable food options. The industry has also witnessed significant advancement in packaging innovation, with companies introducing convenient formats like cups, tubs, and portable pouches to enhance the consumer experience.
The market has demonstrated remarkable growth in consumer adoption, with approximately 62% of US households purchasing dairy-free products, representing a significant increase from previous years. This shift is accompanied by a broader transformation in retail strategy, with supermarkets and specialty stores expanding their plant-based sections and implementing sophisticated merchandising approaches. The industry has also witnessed a notable evolution in marketing strategies, with companies focusing on educational initiatives to inform consumers about the health and environmental benefits of vegan yogurt alternatives. Global consumption patterns have shown substantial change, with non-dairy yogurt consumption growing by 82% from 2019 to 2022, indicating a robust and sustained shift in consumer preferences.
Note: Market size and forecast figures in this report are generated using Mordor Intelligence’s proprietary estimation framework, updated with the latest available data and insights as of 2026.
Global Non-dairy Yogurt Market Trends and Insights
The significant rise in the vegan population, the growing lactose intolerant population, and the availability of innovative plant-based yogurt options drive the consumption of non-dairy yogurt.
- The consumption of different types of dairy alternative products is rising globally owing to a significant rise in the vegan population and the growing lactose-intolerant population. Even vegan exhibitions/trade shows and music festivals are conducted in different countries. For example, Australia has the third-highest percentage of vegans per capita globally. As of 2022, the country had 2.5 million vegans and vegetarians.
- In 2021, plant-based yogurt retail sales in the United States increased by 9%, i.e., three times more than traditional yogurt, reaching a 4.5% market share. Plant-based yogurt unit sales grew rapidly from 54% to 170 million units in 2021. Companies are taking innovative approaches to develop appetizing plant-based yogurts and introducing new flavors and combinations to meet the requirements of their vegan consumer base. Non-dairy yogurt consumption is anticipated to increase due to awareness about the advantages of plant-based foods in the market.
- Germany, France, and Italy have the highest per capita consumption of non-dairy yogurt. The growing popularity of dairy alternatives, primarily in Germany, has led to the rapid growth of plant-based yogurt. The demand for vegan yogurt is growing within the country, and domestic consumers, along with international consumers, are adopting veganism.


OTHER KEY INDUSTRY TRENDS COVERED IN THE REPORT
- Increasing demand for plant-based yogurt, driven by consumer interest in health, sustainability, and animal welfare, leading to a steady growth in the production of non-dairy yogurt globally.
Segment Analysis: Distribution Channel
Off-Trade Segment in Non-Dairy Yogurt Market
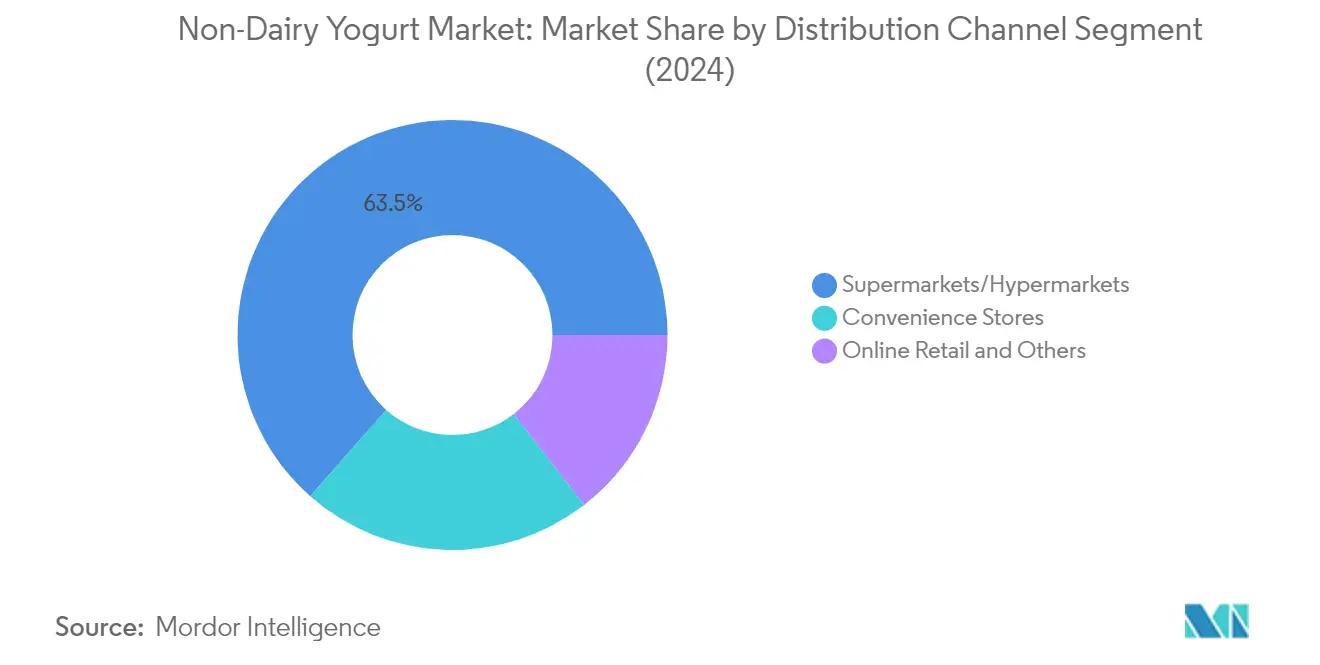
The off-trade segment dominates the global non-dairy yogurt market, accounting for approximately 100.00% of the total market value in 2025. This commanding position is primarily driven by supermarkets and hypermarkets, which contribute around 62.88% of off-trade sales, offering consumers a wide selection of brands, considerable shelf space, and frequent price promotions. The segment's dominance is further strengthened by the omnichannel approach adopted by major retailers worldwide, allowing consumers to access products through multiple touchpoints. Within the off-trade segment, convenience stores hold the second-largest share at approximately 22.31%, benefiting from their widespread presence and accessibility to consumers.

Online Retail in Non-Dairy Yogurt Market
The online retail sub-segment within the off-trade channel is experiencing remarkable growth momentum, projected to expand by approximately 123.6% during 2026-2031. This explosive growth is driven by the increasing adoption of e-commerce platforms, particularly in regions like Europe, where major countries such as Germany, the United Kingdom, and France have substantial online consumer bases. The growth is further fueled by the convenience of online shopping, extensive product selection, competitive pricing, and the ability of companies to reach a larger target market effectively. Online retailers are also leveraging various strategies such as bulk purchase discounts, seasonal offers, free deliveries, and coupon codes to attract potential buyers. The rise in dairy-free products and plant-based dairy options online is contributing significantly to this trend.
Remaining Segments in Distribution Channel
The specialist retailers and other distribution channels, including warehouse clubs and gas stations, play a significant role in the non-dairy yogurt market by catering to specific consumer preferences and shopping behaviors. Specialist retailers differentiate themselves by offering premium and niche products, often complying with strict production and quality standards to target core consumers with distinct quality consciousness and brand awareness. Meanwhile, warehouse clubs and gas stations provide convenience and accessibility to consumers through their strategic locations and membership-based models, contributing to the overall market penetration of dairy alternatives and alternative protein products.
Non-dairy Yogurt Market Geography Segment Analysis
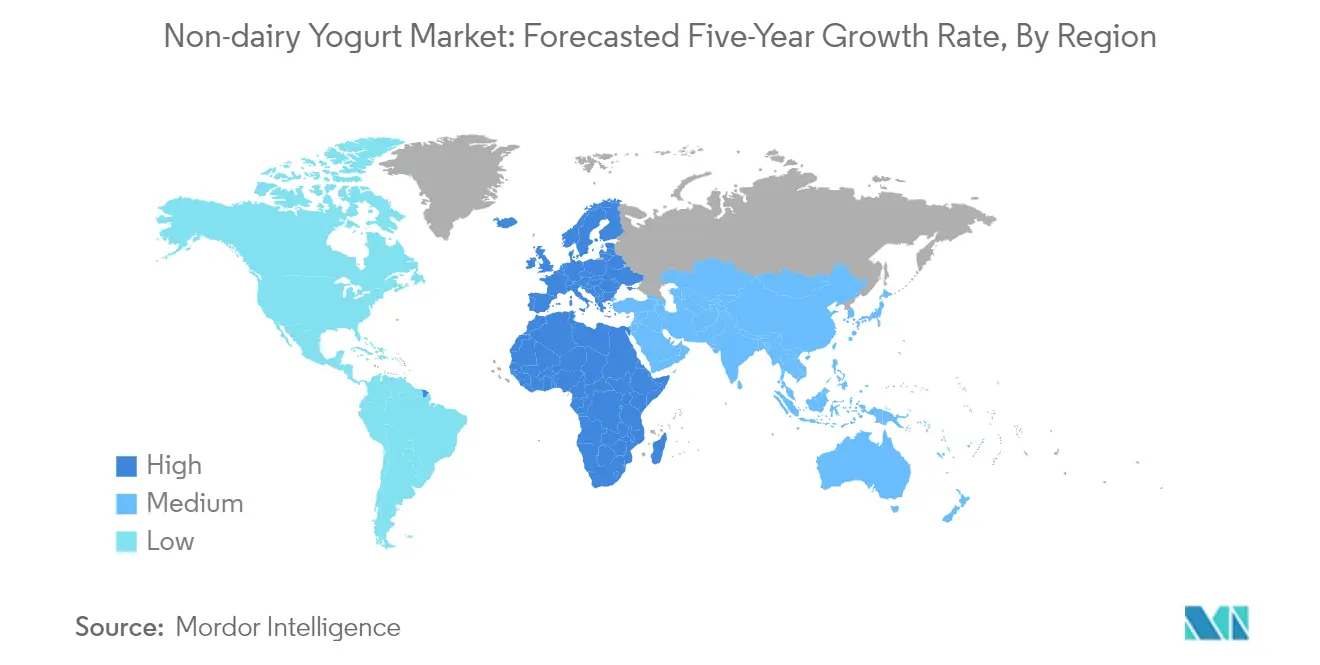
The African non-dairy yogurt market is experiencing significant growth driven by increasing health consciousness and rising consumer preference for vegan-based products. The market is particularly dynamic in South Africa, where consumers are diversifying their diets with plant-based alternatives and consuming fewer animal-based products. The off-trade distribution channel plays a dominant role in the region's market dynamics, with supermarkets and hypermarkets being the primary sales channels. Health-conscious consumers are leading the increasing demand for the dairy-free yogurt market in the region, particularly due to rising awareness about the environmental impact of animal agriculture.
South Africa dominates the African non-dairy yogurt market as the region's largest market. The country's market leadership is driven by the growing trend of veganism and vegetarianism, with approximately 20% of consumers identifying as flexitarians, 17% as vegetarians, and 9% as vegans. The country holds approximately 61.35% market share in 2025. Various initiatives by different associations and organizations to promote a vegan lifestyle have contributed to market growth. The availability of multiple brands through major supermarket chains, including Yokos, Irenes, Plant-Powered, Forager Project, and Siggi's, has made the vegan yogurt market more accessible to consumers.
South Africa demonstrates remarkable growth potential in the non-dairy yogurt sector, with a projected growth rate of approximately 30.74% during 2026-2031. This growth is primarily attributed to increasing consumer awareness about the health benefits associated with plant-based products. The market expansion is further supported by the rising prevalence of cardiovascular diseases and diabetes, prompting consumers to switch to plant-based diets. The online retail channel is emerging as a particularly dynamic segment, driven by increasing internet penetration and the convenience of e-commerce platforms. The market is also benefiting from the expansion of retail infrastructure and the introduction of innovative flavors and product variants, contributing to the broader alternative protein market.
Competitive Landscape
Top Companies in Non-Dairy Yogurt Market
The non-dairy yogurt market is characterized by intense product innovation activities, with companies focusing on developing new flavors and improving nutritional profiles to meet evolving consumer preferences. Major players are expanding their production facilities and investing in research and development to enhance their market presence. Strategic partnerships and collaborations with retailers and distributors have become crucial for expanding market reach. Companies are also emphasizing sustainable packaging solutions and organic ingredients to align with environmental consciousness. The market has witnessed significant operational improvements through technological advancements in manufacturing processes, while companies are actively pursuing geographical expansion through both organic and inorganic growth strategies. This dynamic is reflective of the broader dairy alternatives market, where innovation and sustainability are key drivers.
Consolidated Market Led By Global Players
The non-dairy yogurt market exhibits a relatively consolidated structure dominated by large multinational food and beverage conglomerates, particularly in developed markets. These established players leverage their extensive distribution networks, brand recognition, and research capabilities to maintain their market positions. The market is characterized by the presence of both diversified food companies with broad product portfolios and specialized plant-based food manufacturers focusing exclusively on vegan dairy alternatives. Regional players maintain strong positions in their respective local markets through a deep understanding of consumer preferences and established relationships with local retailers.
The industry has witnessed significant merger and acquisition activities as larger companies seek to expand their plant-based portfolios and gain access to innovative technologies and recipes. Traditional dairy companies are increasingly entering the market through acquisitions of smaller plant-based manufacturers or by developing their own non-dairy product lines. Market consolidation is particularly evident in mature markets, where established players are acquiring innovative startups to strengthen their position in the growing plant-based dairy market. The competitive landscape is further shaped by strategic partnerships between manufacturers and ingredient suppliers to ensure consistent quality and innovation in product development.
Innovation and Distribution Drive Market Success
Success in the non-dairy yogurt market increasingly depends on companies' ability to differentiate their products through innovative formulations, unique flavors, and enhanced nutritional profiles. Incumbent players must focus on continuous product development, sustainable packaging solutions, and strengthening their distribution networks to maintain their market positions. Building strong relationships with retailers and investing in marketing campaigns to educate consumers about plant-based benefits are crucial strategies. Companies need to optimize their production processes and supply chains to achieve cost efficiencies while maintaining product quality and meeting growing demand.
For new entrants and smaller players, success lies in identifying and serving niche market segments with specialized products that address specific consumer needs. Developing unique value propositions through innovative ingredients, local sourcing, or specific health benefits can help differentiate their offerings. Building direct-to-consumer channels and leveraging e-commerce platforms can help overcome distribution challenges faced by smaller players. Companies must also stay ahead of evolving regulatory requirements regarding labeling and health claims while investing in certification programs to build consumer trust. The ability to adapt to changing consumer preferences and maintain price competitiveness while ensuring product quality will be crucial for long-term success. This adaptability is essential in the broader plant-based protein industry and alternative protein industry, where consumer trends are rapidly evolving.
Non-dairy Yogurt Industry Leaders
Coconut Collaborative Ltd
Danone SA
Sapporo Holdings Ltd (POKKA SAPPORO Food & Beverage Ltd)
Triballat Noyal SAS
Valsoia SpA
- *Disclaimer: Major Players sorted in no particular order


Recent Industry Developments
- November 2022: Oatly Group AB announced that it would release a new range of oat-based yogurt. The new range comes in four flavors: strawberry, blueberry, plain, and Greek style.
- October 2022: Califia Farms raised USD 225 million to invest in R&D to increase its production capacity, deepen its presence in the US market, or expand overseas.
- October 2021: Danone launched Greek Style Coconutmilk Yogurt under its Silk brand.


Global Non-dairy Yogurt Market Report Scope
Off-Trade are covered as segments by Distribution Channel. Africa, Asia-Pacific, Europe, Middle East, North America, South America are covered as segments by Region.| Soy Yogurt |
| Almond Yogurt |
| Oat Yogurt |
| Others |
| Drinkable Yogurt |
| Spoonable Yogurt |
| Flavoured |
| Unflavoured |
| On-trade | |
| Off-trade | Convenience Stores |
| Specialist Retailers | |
| Supermarkets/Hypermarkets | |
| Online Retail Channels | |
| Others (Warehouse Clubs, Gas Stations, etc.) |
| North America | United States |
| Canada | |
| Mexico | |
| Rest of North America | |
| South America | Brazil |
| Colombia | |
| Chile | |
| Peru | |
| Argentina | |
| Rest of South America | |
| Europe | United Kingdom |
| Germany | |
| France | |
| Italy | |
| Spain | |
| Poland | |
| Belgium | |
| Sweden | |
| Rest of Europe | |
| Asia-Pacific | China |
| Japan | |
| India | |
| Australia | |
| Indonesia | |
| South Korea | |
| Thailand | |
| Singapore | |
| Rest of Asia-Pacific | |
| Middle East and Africa | South Africa |
| Saudi Arabia | |
| United Arab Emirates | |
| Nigeria | |
| Egypt | |
| Morocco | |
| Turkey | |
| Rest of Middle East and Africa |
| By Product Type | Soy Yogurt | |
| Almond Yogurt | ||
| Oat Yogurt | ||
| Others | ||
| By Category | Drinkable Yogurt | |
| Spoonable Yogurt | ||
| By Flavor | Flavoured | |
| Unflavoured | ||
| By Distribution Channel | On-trade | |
| Off-trade | Convenience Stores | |
| Specialist Retailers | ||
| Supermarkets/Hypermarkets | ||
| Online Retail Channels | ||
| Others (Warehouse Clubs, Gas Stations, etc.) | ||
| By Geography | North America | United States |
| Canada | ||
| Mexico | ||
| Rest of North America | ||
| South America | Brazil | |
| Colombia | ||
| Chile | ||
| Peru | ||
| Argentina | ||
| Rest of South America | ||
| Europe | United Kingdom | |
| Germany | ||
| France | ||
| Italy | ||
| Spain | ||
| Poland | ||
| Belgium | ||
| Sweden | ||
| Rest of Europe | ||
| Asia-Pacific | China | |
| Japan | ||
| India | ||
| Australia | ||
| Indonesia | ||
| South Korea | ||
| Thailand | ||
| Singapore | ||
| Rest of Asia-Pacific | ||
| Middle East and Africa | South Africa | |
| Saudi Arabia | ||
| United Arab Emirates | ||
| Nigeria | ||
| Egypt | ||
| Morocco | ||
| Turkey | ||
| Rest of Middle East and Africa | ||


Market Definition
- Dairy Alternatives - Dairy alternatives are foods that are made from plant-based milk/oils instead of their usual animal products, such as cheese, butter, milk, ice cream, yogurt, etc. Plant-based or non-dairy milk alternative is the fast-growing segment in the newer food product development category of functional and specialty beverage across the globe.
- Non-Dairy Butter - Non dairy butter is a vegan butter alternative that is made from a mixture of plant oils. With an increase in alternative diets like vegetarianism, veganism, and gluten intolerance, plant butter is a healthy non-dairy substitute for normal butter.
- Non-Dairy Ice Cream - Plant based ice cream is a growing category. Non-dairy ice cream is a type of dessert made without any animal ingredients. This is typically considered a substitute for regular ice cream for those who cannot or do not eat animal or animal-derived products, including eggs, milk, cream, or honey.
- Plant-Based Milk - Plant based milks are milk substitutes that are made from nuts (e.g., hazelnuts, hemp seeds), seeds (e.g., sesame, walnuts, coconuts, cashews, almonds, rice, oats, etc.) or legumes (e.g., soy). Plant-based milk such as soy milk and almond milk have been popular in East Asia and the Middle East for centuries.
| Keyword | Definition |
|---|---|
| Cultured Butter | Cultured butter is prepared by having the raw butter go through chemical processing and has been added with certain emulsifiers and foreign ingredients. |
| Uncultured Butter | This type of butter is one which has not been processed in any way |
| Natural Cheese | The type of cheese in its most natural form. It is made from natural and simple products and ingredients, including fresh and natural salts, natural colors, enzymes, and high-quality milk. |
| Processed Cheese | Processed cheese undergoes the same processes as natural cheese; however, it requires more steps and many different forms of ingredients. Making processed cheese involves melting natural cheese, emulsifying it, and adding preservatives and other artificial ingredients or colorings. |
| Single Cream | Single cream contains around 18% fat. It’s a single layer of cream that appears over boiled milk. |
| Double Cream | Double cream contains 48% fat, more than double the amount of fat of single cream. It’s heavier and thicker than single cream |
| Whipping Cream | This has a much higher fat percentage than single cream (36%). Used to top cakes, pies, and puddings and as a thickener for sauces, soups, and fillings. |
| Frozen Desserts | Desserts that are meant to be eaten in frozen condition. E.g., sherbets, sorbets, frozen yogurts |
| UHT Milk (Ultra-high temperature milk) | Milk heated at a very high temperature. Ultra-high-temperature processing (UHT) of milk involves heating for 1–8 sec at 135–154°C. which kills the spore-forming pathogenic microorganism, resulting in a product with a shelf-life of several months. |
| Non-dairy butter/Plant-based butter | Butter made from plant-derived oil such as coconut, palm, etc. |
| Non-dairy Yogurt | Yogurt made from typically made from nuts, like almonds, cashews, coconuts, and even other foods like soybeans, plantains, oats, and peas |
| On-trade | It refers to restaurants, QSRs, and bars. |
| Off-trade | It refers to supermarkets, hypermarkets, on-line channels, etc. |
| Neufchatel cheese | One of the oldest kinds of cheese in France. It is a soft, slightly crumbly, mold-ripened, bloomy-rind cheese made in the Neufchâtel-en-Bray region of Normandy. |
| Flexitarian | It refers to a consumer preferring a semi-vegetarian diet, that is centered on plant foods with limited or occasional inclusion of meat. |
| Lactose Intolerance | Lactose intolerance is a reaction in digestive system to lactose, the sugar in milk. It causes uncomfortable symptoms in response to the consumption of dairy products. |
| Cream Cheese | Cream cheese is a soft and creamy fresh cheese with a tangy taste made from milk and cream. |
| Sorbets | Sorbet is a frozen dessert made using ice combined with fruit juice, fruit purée, or other ingredients, such as wine, liqueur, or honey. |
| Sherbet | Sherbet is a sweetened frozen dessert made with fruit and some sort of dairy product such as milk or cream. |
| Shelf stable | Foods that can be safely stored at room temperature, or "on the shelf," for at least one year and do not have to be cooked or refrigerated to eat safely. |
| DSD | Direct Store Delivery is the process in supply chain management wherein the product is delivered from manufacturing plant directly to the retailer. |
| OU Kosher | Orthodox Union Kosher is a kosher certification agency based in New York City. |
| Gelato | Gelato is a frozen creamy dessert made with milk, heavy cream and sugar. |
| Grass-fed Cows | Grass-fed cows are allowed to graze in pastures, where they eat a variety of grasses and clover. |


Research Methodology
Mordor Intelligence follows a four-step methodology in all our reports.
- Step-1: Identify Key Variables: In order to build a robust forecasting methodology, the variables and factors identified in Step 1 are tested against available historical market numbers. Through an iterative process, the variables required for market forecast are set, and the model is built on the basis of these variables.
- Step-2: Build a Market Model: Market-size estimations for the forecast years are in nominal terms. Inflation is not a part of the pricing, and the average selling price (ASP) is kept constant throughout the forecast period for each country.
- Step-3: Validate and Finalize: In this important step, all market numbers, variables, and analyst calls are validated through an extensive network of primary research experts from the market studied. The respondents are selected across levels and functions to generate a holistic picture of the market studied.
- Step-4: Research Outputs: Syndicated Reports, Custom Consulting Assignments, Databases & Subscription Platforms


