Drippers Market Size and Share
Market Overview
| Study Period | 2021 - 2031 |
|---|---|
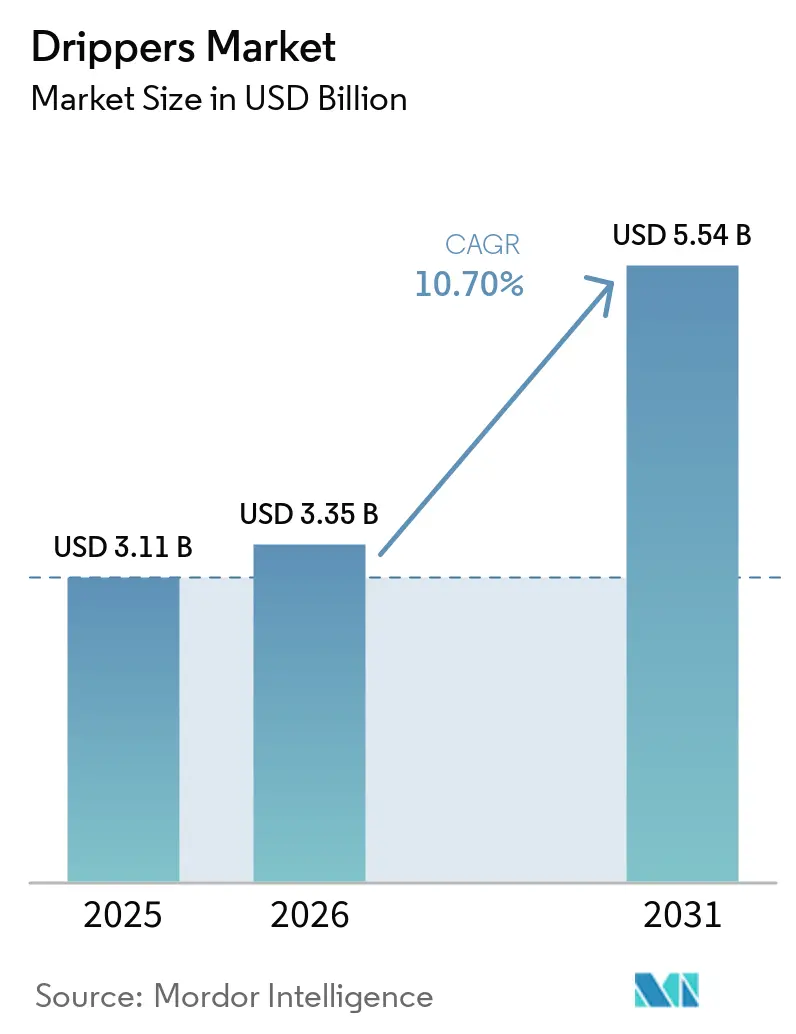
| Market Size (2026) | USD 3.35 Billion |
| Market Size (2031) | USD 5.54 Billion |
| Growth Rate (2025 - 2031) | 10.70% CAGR |
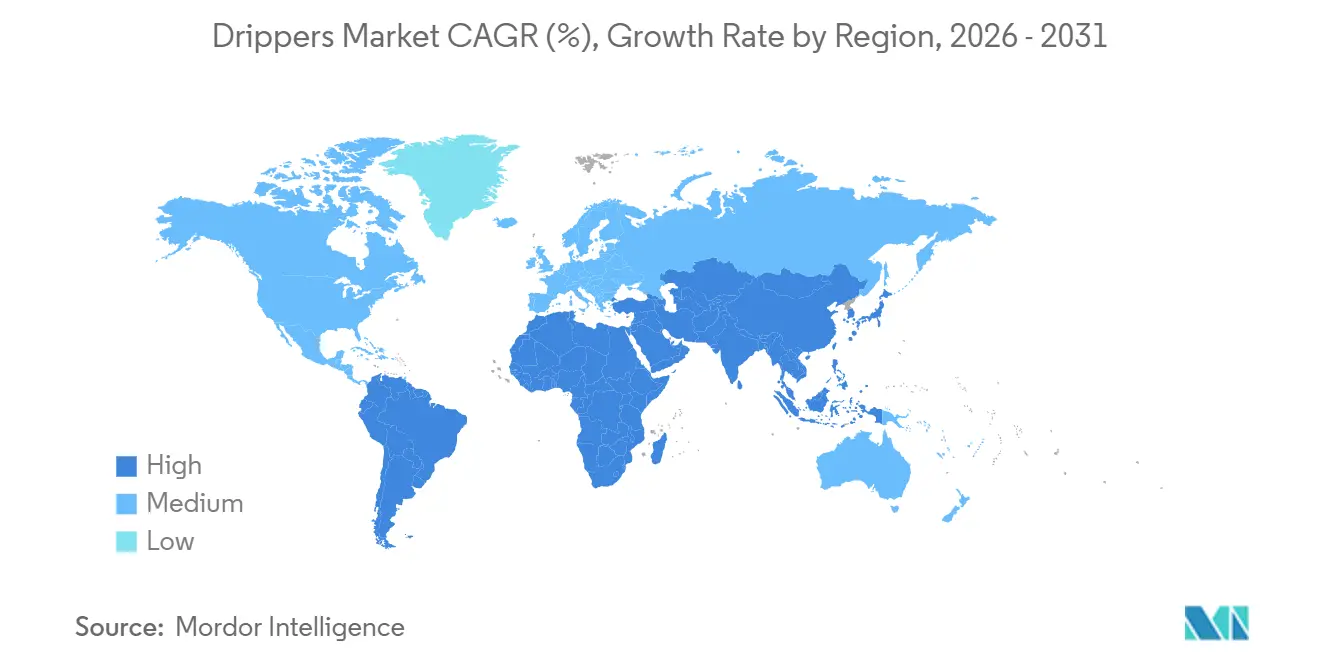
| Fastest Growing Market | Africa |
| Largest Market | Asia Pacific |
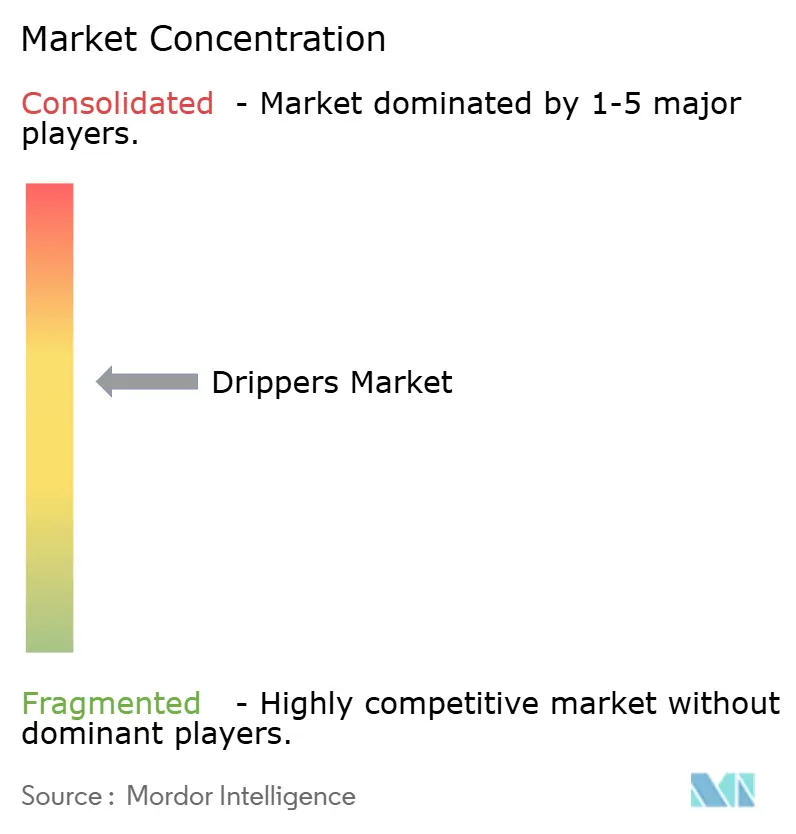
| Market Concentration | Medium |
Major Players *Disclaimer: Major Players sorted in no particular order Image © Mordor Intelligence. Reuse requires attribution under CC BY 4.0. | |
Drippers Market Analysis by Mordor Intelligence
The drippers market was valued at USD 3.11 billion in 2025 and is projected to grow from USD 3.35 billion in 2026 to USD 5.54 billion by 2031, growing at a CAGR of 10.7% from 2026 to 2031. Investments addressing rising water stress, regulations discouraging flood irrigation, and bundled sensor-based fertigation solutions are transforming precision emitters from optional upgrades to essential farm infrastructure. Inline emitters currently lead in volume sales due to their ease of installation and low risk of leakage, which appeals to large corporate farms. However, the price gap between inline emitters and field-adjustable online units is narrowing as growers increasingly rotate high-value crops and seek flow flexibility to manage rising labor costs. Government subsidies are accelerating dripper adoption across countries such as India and the United States by lowering upfront investment costs. In India, under the Pradhan Mantri Krishi Sinchayee Yojana (PMKSY), farmers receive 55% subsidy for small and marginal farmers and 45% for others for micro-irrigation systems. Similarly, the United States supports drip irrigation through the Environmental Quality Incentives Program (EQIP).
Key Report Takeaways
- By product type, inline drippers led with the largest 48% of the drippers market share in 2025. The online drippers market size is projected to expand at the fastest 10.6% CAGR from 2026 to 2031.
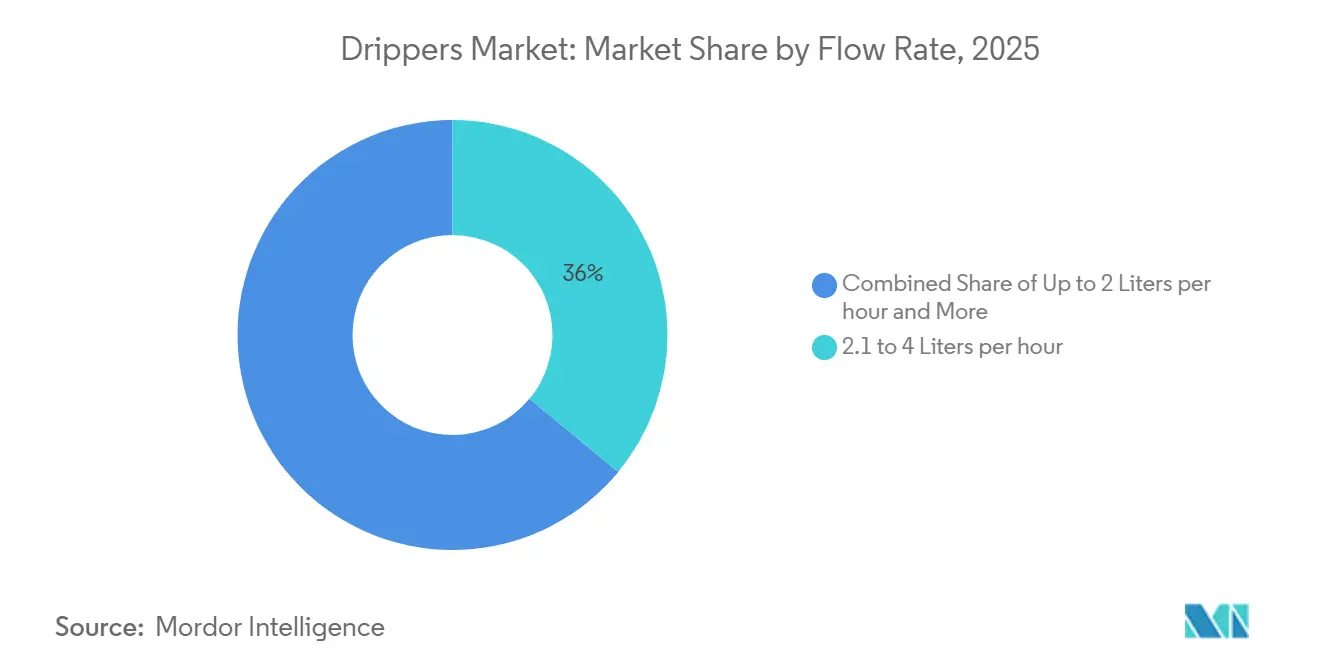
- By flow rate, the 2.1 to 4 liters per hour segment held the largest 36% of the drippers market share in 2025. Flow rate above 8 liters per hour are anticipated to advance at the fastest 9.6% CAGR from 2026 to 2031.
- By crop type, fruits and vegetables accounted for the largest 41% of the drippers market share in 2025. Orchards and vineyards market size is projected to grow at the fastest 10.8% CAGR from 2026 to 2031.
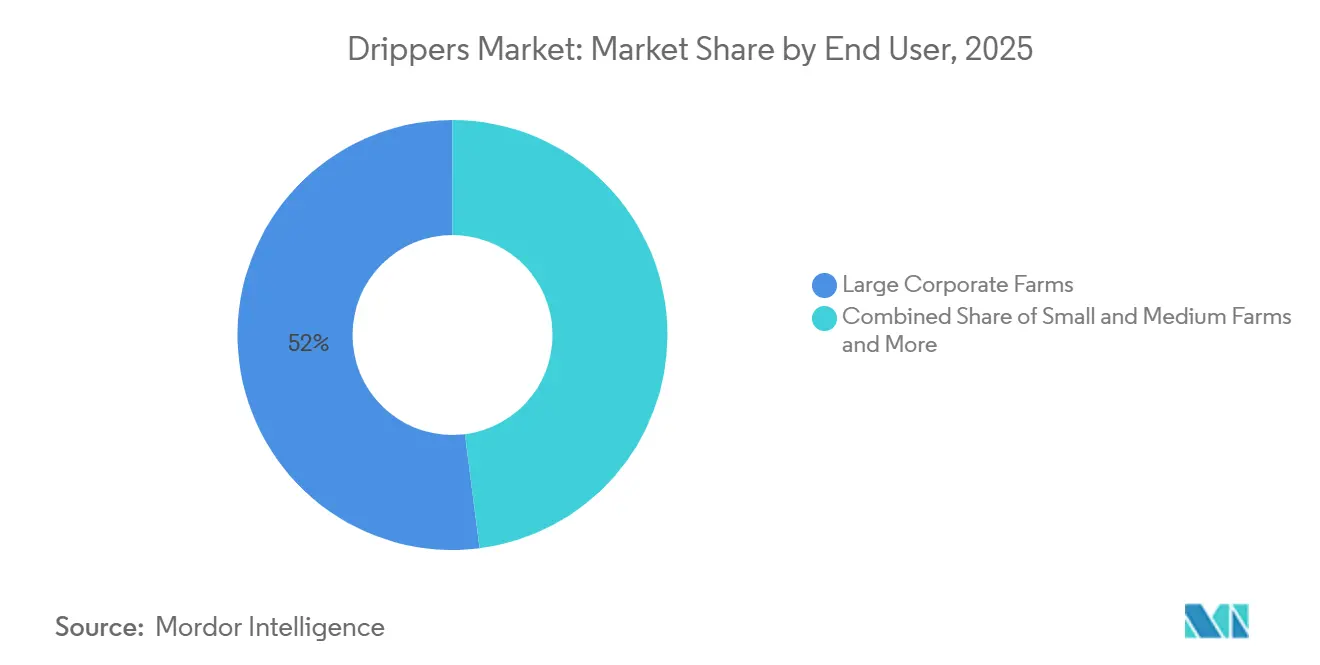
- By end user, large corporate farms held the largest 52% of the drippers market share in 2025. Greenhouses and nurseries market size is projected to grow at the fastest 12.5% CAGR from 2026 to 2031.
- By distribution channel, dealer/distributor networks captured the largest 57% of the drippers market share in 2025. E-commerce market size is forecast to expand at the fastest 14.2% CAGR from 2026 to 2031.
- By geography, Asia-Pacific dominated with the largest 34% of the drippers market share in 2025, while Africa market size is projected to grow at the fastest 13.6% CAGR from 2026 to 2031.
Note: Market size and forecast figures in this report are generated using Mordor Intelligence’s proprietary estimation framework, updated with the latest available data and insights as of January 2026.
Global Drippers Market Trends and Insights
Drivers Impact Analysis*
| Driver | (~) % Impact on CAGR Forecast | Geographic Relevance | Impact Timeline |
|---|---|---|---|
| Drought-induced irrigation mandates | +2.1% | Mediterranean Europe, California, Northern China, and Southern Africa | Medium term (2-4 years) |
| Government micro-irrigation subsidies | +1.8% | India, European Union, United States, Egypt, Kenya, and Uganda | Short term (≤ 2 years) |
| Commercial greenhouse boom in Asia-Pacific | +1.5% | China, India, Japan, South Korea, Vietnam, and Thailand | Medium term (2-4 years) |
| Smart fertigation bundling with IoT drippers | +1.3% | North America, Israel, Western Europe, Brazil, and South Africa | Long term (≥ 4 years) |
| Agro-solar projects needing low-profile irrigation | +0.9% | Middle East and North Africa, India, and sub-Saharan Africa | Long term (≥ 4 years) |
| Regenerative agriculture and carbon-credit projects | +0.7% | North America, European Union, Australia, and South America | Long term (≥ 4 years) |
| Source: Mordor Intelligence | |||
Drought-Induced Irrigation Mandates
Water scarcity regulations are shifting irrigation from an optional upgrade to a compliance-driven requirement, driving the adoption of drippers in water-stressed regions. Governments are implementing groundwater extraction limits and irrigation efficiency standards to safeguard agricultural productivity and maintain land value. Micro irrigation facilities reduce dependence on rainfall variability and encourage the use of precision irrigation. As compliance becomes mandatory, farmers are increasingly adopting drippers to meet regulatory requirements, ensuring consistent demand irrespective of fluctuations in commodity prices.
Government Micro-Irrigation Subsidies
Public funding programs are playing a crucial role in reducing financial barriers to adopting dripper systems, especially for small and marginal farmers. Subsidy-driven models lower initial capital costs and enhance return on investment, thereby increasing the accessibility of micro-irrigation in developing agricultural economies. For instance, India’s Pradhan Mantri Krishi Sinchayee Yojana has facilitated micro-irrigation coverage around 8.3 million hectares through 2024 [1]Source: Press Information Bureau, Government of India, “Micro Irrigation under Pradhan Mantri Krishi Sinchayee Yojana (PMKSY),” pib.gov.in. These initiatives drive demand for drippers by aligning financial incentives with water conservation objectives. When subsidy frameworks are effectively integrated with local financing mechanisms, they boost installation rates and support stable, policy-driven market growth.
Commercial Greenhouse Boom in Asia-Pacific
The expansion of controlled-environment agriculture (CEA) continues to drive consistent demand for dripper systems, which are a vital component of irrigation. Greenhouse farming depends on precise water and nutrient delivery, making drippers an essential part of the infrastructure rather than an optional feature. These systems enable advanced greenhouse operations by combining drip irrigation with automation technologies to improve yield and resource efficiency. With the growing adoption of greenhouses, drippers experience increased installation cycles and recurring replacement requirements, supporting steady market growth.
Smart Fertigation Bundling with IoT Drippers
The adoption of smart fertigation systems integrated with Internet of Things (IoT)-enabled drippers is driving the growth of precision agriculture. These systems merge automated irrigation with real-time nutrient dosing, allowing for plant-specific decision-making instead of relying on fixed schedules. This approach minimizes fertilizer losses and enhances water-use efficiency, especially in high-value crops. According to the Food and Agriculture Organization (FAO), drip irrigation can improve water-use efficiency by up to 90% compared to conventional irrigation methods [2]Source: Food and Agriculture Organization, “Irrigation Techniques and Water Management,” fao.org.
Restraints Impact Analysis*
| Restraint | (~) % Impact on CAGR Forecast | Geographic Relevance | Impact Timeline |
|---|---|---|---|
| High up-front system cost for smallholders | -1.2% | Africa, South Asia, and Andean belt | Short term (≤ 2 years) |
| Bio-film and mineral clogging risks | -0.9% | Areas with hard water or debris-laden canals | Medium term (2-4 years) |
| Shortage of skilled installers and technicians | -0.6% | Rural South America, Sub-Saharan Africa, and Central Asia | Medium term (2-4 years) |
| Polymer resin price volatility | -0.5% | Global manufacturing hubs | Short term (≤ 2 years) |
| Source: Mordor Intelligence | |||
High Up-Front System Cost for Smallholders
The high initial investment required for drip irrigation systems limits adoption among smallholder farmers. This challenge is particularly evident in developing agricultural economies, where farm incomes remain volatile and unpredictable. Despite the proven long-term efficiency benefits, the upfront capital requirements hinder purchasing decisions due to limited access to affordable credit, fragmented landholdings, and the lack of financial incentives or subsidies. This cost barrier continues to slow the adoption of drip irrigation systems in price-sensitive regions, even with policy support in place, as many farmers prioritize immediate cost savings over long-term gains.
Bio-Film and Mineral Clogging Risks
Emitter clogging, resulting from biofilm formation, suspended particles, and mineral precipitation, continues to pose a significant challenge for dripper systems, especially in regions reliant on untreated groundwater or reclaimed water. These problems adversely affect flow uniformity and irrigation efficiency, increasing maintenance demands and causing system downtime for farmers. The narrow design of emitter channels makes them particularly vulnerable to fluctuations in water quality. A study published in the International Journal of Agriculture and Nutrition found that emitter clogging levels can reach 1.9% under field conditions, depending on emitter type and operating pressure [3]Source: International Journal of Agriculture and Nutrition, “Evaluation of Hydraulic Performance of Drip Irrigation System,” agriculturejournal.net.
*Our forecasts treat driver/restraint impacts as directional, not additive. The impact forecasts reflect baseline growth, mix effects, and variable interactions.
Segment Analysis
By Product Type: Inline Stability and Online Flexibility
Inline drippers led with the largest 48% of the drippers market share in 2025, reflecting strong adoption in plantations with fixed crop layouts and long-term irrigation strategies. Their integrated design reduces leakage points and simplifies installation, enhancing operational efficiency during peak agricultural periods. Inline systems are particularly favored in scenarios where uniform spacing and durability are essential, such as in perennial crops. The market for inline drippers remains stable, as large-scale farms prioritize reliability and low maintenance over flexibility, thereby ensuring consistent demand in structured irrigation setups.
The online drippers market is projected to grow at the fastest CAGR of 10.6% from 2026 to 2031, driven by rising demand for flexible irrigation systems. These emitters enable farmers to adjust outlet positions based on crop spacing and rotation patterns, making them suitable for diversified farming practices. As cropping intensity increases and farm operations become more dynamic, growers are opting for adaptable irrigation solutions. Manufacturers are improving product features, including pressure compensation and anti-siphon mechanisms, enhancing performance comparability with inline systems and driving adoption across varied terrains and mixed cropping systems.
By Flow Rate: Mid-Range Dominance and High-Flow Expansion
The 2.1 to 4 liters per hour segment held the largest 36% of the drippers market share in 2025, attributed to its adaptability across various soil types and crops. This flow range ensures balanced water distribution, minimizing runoff while achieving effective root-zone penetration. It is commonly utilized in row crops and moderately permeable soils, making it a preferred option for many farmers. The market size for this segment remains robust as growers focus on efficiency and consistency in water application amidst increasing resource limitations.
Flow rates above 8 liters per hour are anticipated to grow at the fastest 9.6% CAGR from 2026 to 2031, driven by their suitability for sandy and arid regions that require deeper water infiltration. These high-flow systems serve crops that require rapid moisture delivery and are increasingly used in large-scale irrigation projects. Investments in infrastructure, including pumps and monitoring systems, further support this segment's growth. As water management becomes more data-driven, growers are increasingly selecting flow rates based on soil properties and evapotranspiration models, driving the adoption of high-flow emitters in specialized agricultural areas.


By Crop Type: Produce Leadership and Perennial Upswing
Fruits and vegetables accounted for the largest 41% of the drippers market share in 2025. This dominance is attributed to intensive cultivation practices that require precise irrigation and fertigation. High-value crops such as tomatoes, peppers, and berries rely on controlled water delivery to ensure consistent yield quality. Drip systems play a critical role in both greenhouse and open-field horticulture, where effective nutrient management directly influences output. The drippers market in this segment remains strong as growers increasingly adopt precision irrigation to enhance productivity and meet the growing demand for high-quality produce.
The orchards and vineyards market size is projected to grow at the fastest 10.8% CAGR from 2026 to 2031. This growth is driven by the rising adoption of deficit irrigation strategies. Perennial crops benefit from controlled water application, which improves fruit quality while conserving resources. As water pricing and sustainability regulations become more stringent, growers are transitioning to efficient irrigation methods. Drippers facilitate targeted water delivery to deep root zones, making them particularly suitable for long-cycle crops. Additionally, the expansion of high-value tree crop cultivation supports long-term demand in this segment.
By End User: Corporate Scale and Greenhouse Acceleration
Large corporate farms held the largest 52% of the drippers market share in 2025, benefiting from economies of scale and the integration of advanced farming technologies. These farms utilize drip irrigation alongside precision agriculture tools, such as satellite mapping and automated fertilization, to enhance efficiency. Their financial resources allow for significant investments in advanced irrigation infrastructure, facilitating consistent adoption. The drippers market in this segment remains dominant as corporate farms expand operations and focus on resource optimization, establishing standards for technology-driven agriculture.
The greenhouse and nurseries market size is projected to grow at the fastest 12.5% CAGR from 2026 to 2031, driven by the increasing adoption of controlled-environment agriculture. These systems rely on precise water and nutrient delivery, making drippers an essential component. Year-round production cycles and contract-based supply models contribute to stable demand. As urban farming and protected cultivation practices expand, growers are increasingly investing in efficient irrigation solutions. This trend is driving the rapid adoption of advanced dripper systems in greenhouses, solidifying their importance in high-efficiency agricultural production systems.
By Distribution Channel: Dealer Endurance and Digital Upswing
Dealer and distributor networks captured the largest 57% of the drippers market share in 2025, driven by their role in installation, maintenance, and financing support. These channels are particularly important in regions with fragmented farming structures, where technical guidance and after-sales service significantly influence purchasing decisions. Dealers serve as intermediaries between manufacturers and farmers, ensuring product accessibility and reliability. The market size for drippers through this channel remains robust, driven by established trust and localized service capabilities.
The e-commerce channels market size is projected to expand at the fastest 14.2% CAGR from 2026 to 2031, fueled by increasing digital adoption in agriculture. Online platforms allow farmers to purchase modular irrigation components tailored to their budgets and needs, enhancing accessibility. Faster logistics and direct engagement with manufacturers improve convenience and pricing transparency. As digital ecosystems integrate with farm management tools, e-commerce channels are gaining traction. This trend supports a hybrid distribution model that combines the efficiency of digital platforms with the reliability of traditional service networks to drive market growth.
Geography Analysis
Asia-Pacific is projected to dominate the drippers market with the largest 34% market share in 2025, driven by government-supported micro-irrigation programs and the rapid expansion of greenhouses in major agricultural economies. India remains a key contributor to regional demand, supported by subsidy-driven adoption under irrigation schemes. Meanwhile, China is making significant investments in controlled-environment agriculture to enhance food security. In 2024, India allocated INR 1,600 crore (USD 192 million) to expand micro-irrigation, emphasizing long-term infrastructure development. These policy initiatives and technological advancements position Asia-Pacific as a major growth driver in the drippers market.
The African market is projected to grow at the fastest CAGR of 13.6% from 2026 to 2031, marking a rapid growth rate among regions. This growth is primarily attributed to large-scale irrigation modernization efforts and the increasing need to enhance water-use efficiency in agriculture. Egypt is making good investments in irrigation transformation to expand modern irrigation systems. Additionally, the expansion of commercial farming and policy-driven adoption of efficient irrigation technologies are anticipated to drive increased demand for drippers across the region.
Regional growth trends indicate a global shift toward the adoption of precision irrigation technologies in both developed and emerging economies. Europe and North America are driving adoption due to regulatory constraints on groundwater usage and sustainability objectives. The Middle East has emerged as a center for innovation in irrigation technologies. In the Asia-Pacific region, public investments, such as India’s allocation for micro-irrigation programs are promoting widespread adoption. These trends collectively suggest a sustained global demand for efficient irrigation systems.

Competitive Landscape
The drippers market is moderately consolidated, with key players such as Netafim Ltd., Rivulis Irrigation Ltd., The Toro Company, Rain Bird Corporation, and Jain Irrigation Systems Ltd. holding a significant share of global revenue. These companies utilize robust distribution networks, product innovation, and integrated irrigation solutions to maintain their competitive positions. Strategic investments in digital agriculture and precision irrigation technologies are enabling these firms to enhance their product portfolios and improve customer retention in major agricultural regions.
Competitive intensity is rising as new entrants and regional players introduce cost-effective, technology-driven solutions. Companies are increasingly focusing on integrating Internet of Things (IoT) capabilities, automation, and fertigation systems to differentiate their offerings. Research efforts, including developments from the Massachusetts Institute of Technology, underscore potential efficiency improvements in irrigation systems, fostering innovation across the market. Additionally, regional firms in Asia are bolstering their domestic presence through government-supported initiatives and localized manufacturing advantages.
Market dynamics are shifting toward value-added services, where companies combine hardware, software, and financing solutions to enhance customer engagement. Rising raw material and labor costs are exerting pressure on profit margins, prompting firms to adopt digital platforms and service-based revenue models. As competition intensifies, partnerships, acquisitions, and technological advancements are projected to shape the market's future. Companies that effectively integrate analytics, automation, and irrigation expertise are likely to gain a competitive edge, while traditional manufacturers face an increasing risk of commoditization.
Drippers Industry Leaders
Netafim Ltd.
Rivulis Irrigation Ltd.
The Toro Company
Rain Bird Corporation
Jain Irrigation Systems Ltd.
- *Disclaimer: Major Players sorted in no particular order

Recent Industry Developments
- March 2026: Netafim Ltd. collaborated with Irrigreen to introduce a Smart Drip Irrigation System, combining Netafim Ltd’s dripline hardware with Irrigreen’s digital Smart Valve technology. The system offers real-time monitoring, leak and clog detection, and automated irrigation control, extending precision irrigation applications beyond traditional turf to include garden beds, shrubs, and orchard crops such as olives.
- February 2025: Netafim Ltd. introduced the world’s first hybrid dripline, integrating inline and online dripper technologies into a single system with a built-in outlet to enhance efficiency and performance. This solution streamlines irrigation by removing manual installation steps, such as hole punching and migration rings, thereby reducing labor needs while ensuring consistent water delivery.
- September 2024: Rivulis Irrigation Ltd. expanded its manufacturing presence in North America by opening a new factory in Tijuana, Mexico. This facility aims to strengthen regional supply capabilities for drip irrigation systems, ensuring improved production efficiency and better service to customers in the region.


Global Drippers Market Report Scope
Drippers are components of drip irrigation systems designed to deliver water gradually and directly to the root zone of plants. They enable accurate water distribution, enhancing water-use efficiency and minimizing wastage in agricultural and horticultural practices. The drippers market report is segmented by product type (inline drippers and online drippers), flow rate (up to 2 L h, 2.1 to 4 L h, 4.1 to 8 L h, and above 8 L h), crop type (field crops, fruits and vegetables, orchards and vineyards, and ornamentals and turf), end user (large corporate farms, small and medium farms, and greenhouses and nurseries), distribution channel (direct OEM sales, dealer/distributor network, and e-commerce), and geography (North America, South America, Europe, Asia-Pacific, Middle East, and Africa). The market forecasts are provided in terms of value (USD).
| Inline Drippers |
| Online Drippers |
| Up to 2 L h |
| 2.1 To 4 L h |
| 4.1 To 8 L h |
| Above 8 L h |
| Field Crops |
| Fruits and Vegetables |
| Orchards and Vineyards |
| Ornamentals and Turf |
| Large Corporate Farms |
| Small and Medium Farms |
| Greenhouses and Nurseries |
| Direct OEM Sales |
| Dealer/Distributor Network |
| E-Commerce |
| North America | United States |
| Canada | |
| Mexico | |
| Rest of North America | |
| South America | Brazil |
| Argentina | |
| Rest of South America | |
| Europe | Germany |
| France | |
| Spain | |
| Italy | |
| United Kingdom | |
| Russia | |
| Rest of Europe | |
| Asia-Pacific | China |
| India | |
| Japan | |
| South Korea | |
| Australia | |
| Rest of Asia-Pacific | |
| Middle East | Israel |
| Turkey | |
| Rest of Middle East | |
| Africa | South Africa |
| Egypt | |
| Rest of Africa |
| By Product Type | Inline Drippers | |
| Online Drippers | ||
| By Flow Rate | Up to 2 L h | |
| 2.1 To 4 L h | ||
| 4.1 To 8 L h | ||
| Above 8 L h | ||
| By Crop Type | Field Crops | |
| Fruits and Vegetables | ||
| Orchards and Vineyards | ||
| Ornamentals and Turf | ||
| By End User | Large Corporate Farms | |
| Small and Medium Farms | ||
| Greenhouses and Nurseries | ||
| By Distribution Channel | Direct OEM Sales | |
| Dealer/Distributor Network | ||
| E-Commerce | ||
| By Geography | North America | United States |
| Canada | ||
| Mexico | ||
| Rest of North America | ||
| South America | Brazil | |
| Argentina | ||
| Rest of South America | ||
| Europe | Germany | |
| France | ||
| Spain | ||
| Italy | ||
| United Kingdom | ||
| Russia | ||
| Rest of Europe | ||
| Asia-Pacific | China | |
| India | ||
| Japan | ||
| South Korea | ||
| Australia | ||
| Rest of Asia-Pacific | ||
| Middle East | Israel | |
| Turkey | ||
| Rest of Middle East | ||
| Africa | South Africa | |
| Egypt | ||
| Rest of Africa | ||


Key Questions Answered in the Report
How large will the drippers market be by 2031?
It is projected to reach USD 5.54 billion by 2031, up from USD 3.35 billion in 2026, reflecting a 10.7% CAGR from 2026 to 2031.
Which product type currently leads sales?
Inline drippers hold the largest 48% of revenue because plantation-scale farms value fast installation and low leak risk.
How are manufacturers defending margins as emitters commoditize?
Leading firms bundle connectivity and analytics, converting one-time hardware sales into high-margin subscription revenue streams.
What flow rate segment is set for the quickest expansion?
Emitters delivering more than 8 liters per hour are projected to grow at the fastest 9.6% from 2026 to 2031.
Page last updated on:


