International Express Service Market Size and Share
Market Overview
| Study Period | 2018 - 2031 |
|---|---|
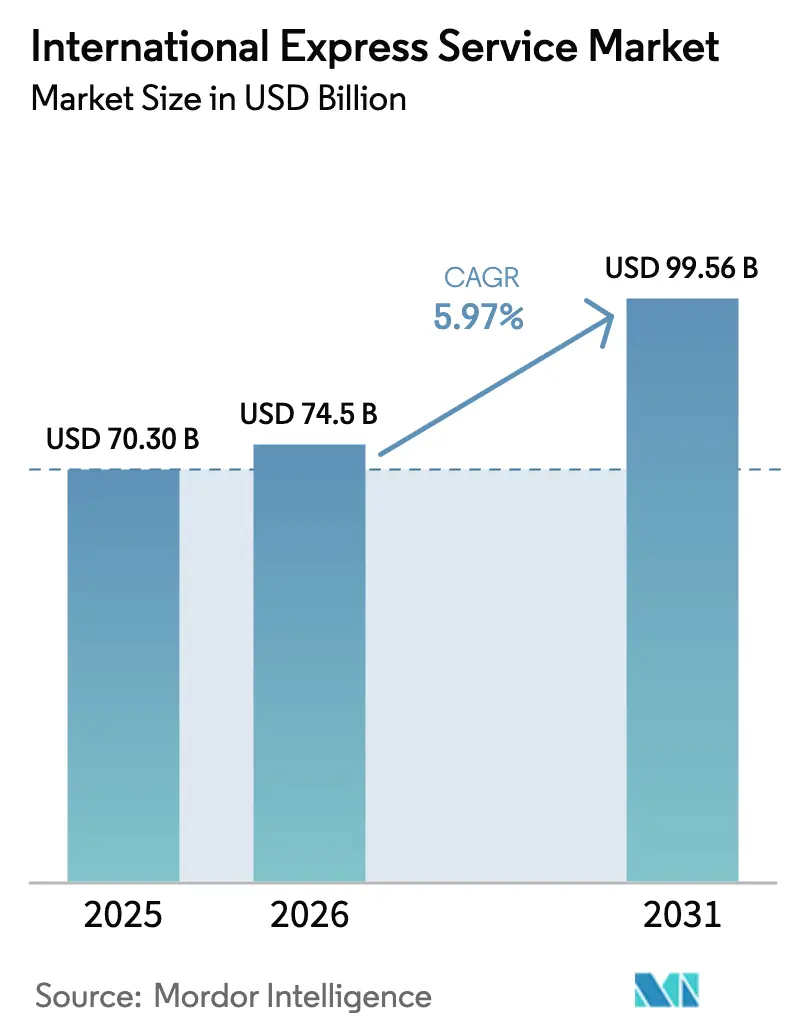
| Market Size (2026) | USD 74.5 Billion |
| Market Size (2031) | USD 99.56 Billion |
| Growth Rate (2026 - 2031) | 5.97% CAGR |
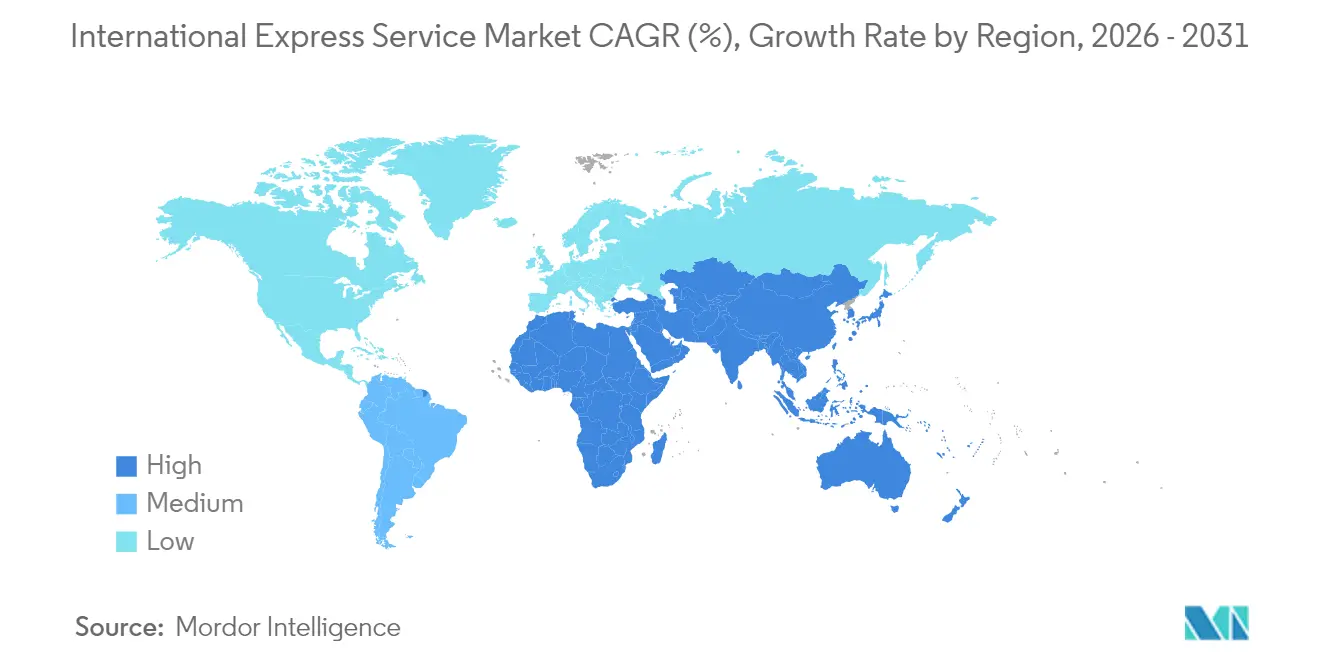
| Fastest Growing Market | Middle East and Africa |
| Largest Market | Asia Pacific |
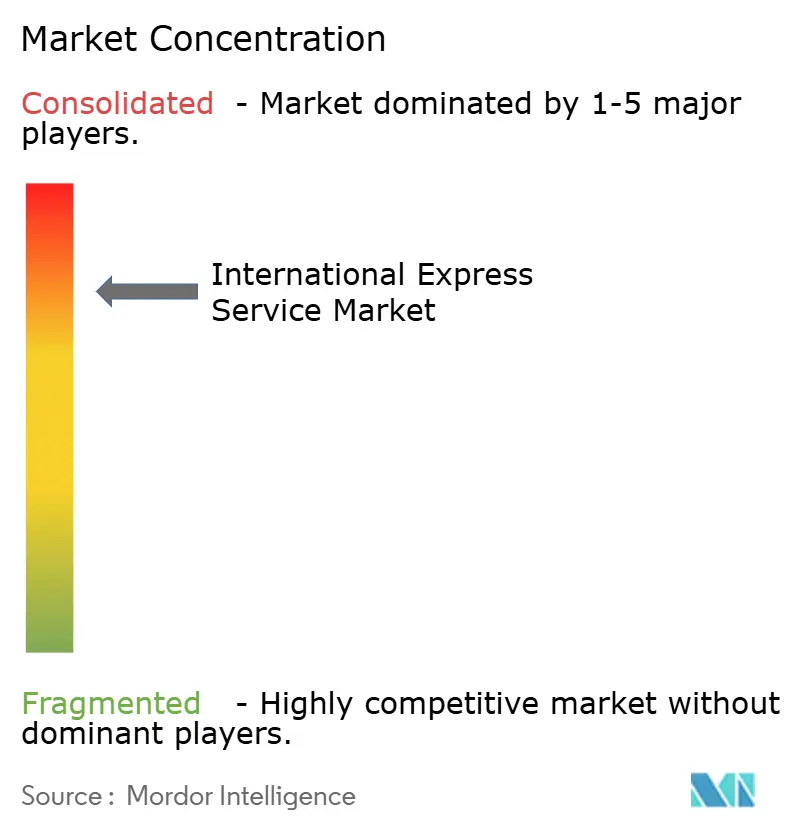
| Market Concentration | High |
Major Players*Disclaimer: Major Players sorted in no particular order Image © Mordor Intelligence. Reuse requires attribution under CC BY 4.0. | |
International Express Service Market Analysis by Mordor Intelligence
The international express service market size in 2026 is estimated at USD 74.5 billion, growing from 2025 value of USD 70.3 billion with 2031 projections showing USD 99.56 billion, growing at 5.97% CAGR over 2026-2031. Rising cross-border e-commerce volumes, expanding free-trade frameworks, and accelerating supply-chain regionalization are reinforcing demand for premium door-to-door delivery, while technology investments in automated sortation and AI-enabled routing strengthen service reliability and cost control. Express carriers are also scaling temperature-controlled capabilities to capture biologics and specialty-food flows, and they are investing in sustainable aviation fuels plus electric ground fleets to comply with carbon mandates. Competitive intensity is heightening as geopolitical airspace closures reroute long-haul lanes and boost fuel burn, pressing operators to recalibrate networks through data-driven planning. Amid these shifts, Asia-Pacific retains a pivotal role as both production engine and consumption arena, underpinning new service corridors that link factory clusters with global buyer hubs.
Key Report Takeaways
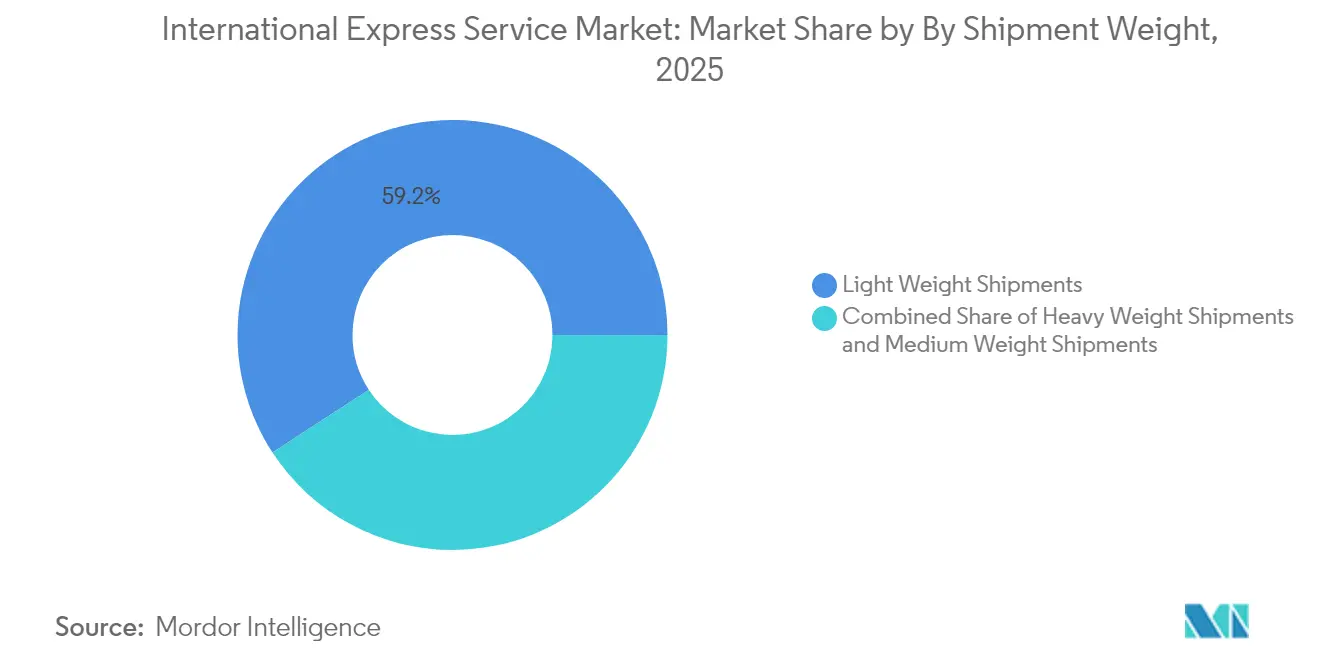
- By shipment weight, lightweight parcels accounted for 59.21% of the international express service market share in 2025, while heavyweight parcels are expanding at a 6.05% CAGR from 2026-2031, the fastest among weight bands.
- By route, inter-region flows captured 72.34% of the international express service market size in 2025, while intra-region services are forecast to grow at a 5.55% CAGR between 2026-2031.
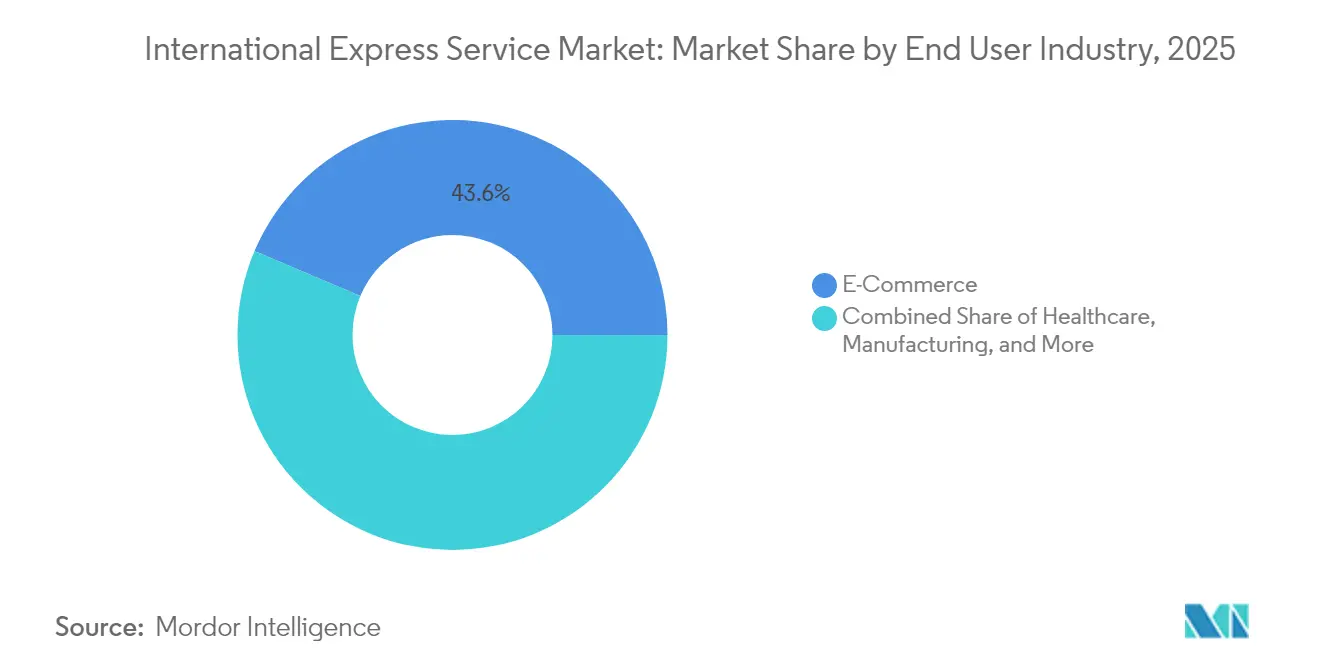
- By end user industry, e-commerce led with 43.62% of the revenue share in 2025; healthcare is projected to advance at a 7.16% CAGR between 2026-2031.
- By region, Asia-Pacific dominated with a 54.38% share of the revenue in 2025, whereas the Middle East and Africa segment is poised for a 7.55% CAGR during 2026-2031.
Note: Market size and forecast figures in this report are generated using Mordor Intelligence’s proprietary estimation framework, updated with the latest available data and insights as of 2026.
Global International Express Service Market Trends and Insights
Drivers Impact Analysis*
| Driver | (~) % Impact on CAGR Forecast | Geographic Relevance | Impact Timeline |
|---|---|---|---|
| Explosive growth of cross-border e-commerce | +1.8% | Global; APAC and North America lead | Medium term (2-4 years) |
| Time-definite B2B delivery preference | +1.2% | Global; concentrated in manufacturing hubs | Short term (≤ 2 years) |
| Trade liberalization and FTAs expansion | +0.9% | APAC core; spill-over to MEA and South America | Long term (≥ 4 years) |
| AI-driven route optimization on underserved lanes | +0.7% | Global; early adoption in North America and Europe | Medium term (2-4 years) |
| Temperature-controlled express for biologics and gourmet foods | +0.5% | North America, Europe, select APAC | Long term (≥ 4 years) |
| SME fulfillment hubs in tier-2 APAC cities | +0.4% | APAC core; expansion to emerging markets | Medium term (2-4 years) |
| Source: Mordor Intelligence | |||


Explosive Growth of Cross-Border E-Commerce
Surging direct-to-consumer sales are reshaping the international express service market as merchants replace bulk freight with millions of small parcels demanding two-to-five-day delivery. Asia-Pacific booked USD 882 billion of cross-border e-commerce revenue in 2024, generating unprecedented shipment density for carriers[1]Bloomberg News, “Asia-Pacific Cross-Border E-Commerce Reaches $784 Billion in 2024,” bloomberg.com. Integrators are responding with mega-sort hubs, robotic last-mile depots, and paperless clearance to compress transit times. Aramex’s automated facility in Jeddah illustrates how regional operators scale capacity to capture intra-MEA flows. These upgrades accelerate shipment hand-offs and improve reliability, reinforcing customer trust in premium services across B2C and SME segments.
Time-Definite B2B Delivery Preference
Manufacturers running lean inventories value delivery certainty more than absolute freight cost, driving steady uptake of express lanes for semiconductors, aerospace parts, and precision tooling. Delays can immobilize production lines and inflict sizeable financial penalties, motivating firms to pre-book guaranteed slots within the international express service market. SG Holdings’ acquisition of Morrison Express to deepen semiconductor logistics specialization signals rising carrier focus on high-value verticals[2]Nikkei Asia, “SG Holdings Acquires Morrison Express to Strengthen Semiconductor Logistics,” asia.nikkei.com. Enhanced shipment visibility, proactive exception alerts, and flexible rescheduling options have become baseline expectations for mission-critical cargo.
Trade Liberalization and FTAs Expansion
Modernized customs regimes and deepening free-trade agreements such as RCEP reduce administrative friction, making express solutions more competitive than traditional postal or deferred freight. Pre-arrival data exchange and digital release processes cut border dwell times, supporting the international express service market in opening new city-pair lanes. Yamato’s Southeast Asia-Europe multimodal network shows how carriers leverage simplified rules of origin and harmonized documentation to offer direct services linking second-tier manufacturing hubs to European buyers[3]Transport Topics, “Yamato Transport Expands Multimodal Services Southeast Asia-Europe Corridor,” ttnews.com. Over the forecast horizon, additional FTAs in South America and Africa are likely to replicate this momentum.
AI-Driven Route Optimization on Underserved Lanes
Machine-learning engines analyze historic demand, weather, and slot availability to allocate capacity dynamically, enabling carriers to serve thin lanes profitably. When geopolitical disruptions lifted fuel burn by 13% on certain flights, operators used AI tools to reroute aircraft and rebalance load factors, preserving service quality while limiting cost escalation. Enhanced decision support also powers dynamic pricing, which monetizes late-booked capacity at premium yields without undermining existing contracts.
Restraints Impact Analysis*
| Restraint | (~) % Impact on CAGR Forecast | Geographic Relevance | Impact Timeline |
|---|---|---|---|
| Volatile fuel surcharges and aviation costs | -1.1% | Global; long-haul lanes most exposed | Short term (≤ 2 years) |
| Stringent customs and security compliance | -0.8% | Global; heightened on high-risk corridors | Medium term (2-4 years) |
| Geopolitical air-space closures limiting capacity | -0.6% | Europe-Asia and Middle East transits | Short term (≤ 2 years) |
| Carbon-emission mandates raising long-haul costs | -0.4% | Europe and North America; expanding worldwide | Long term (≥ 4 years) |
| Source: Mordor Intelligence | |||
Volatile Fuel Surcharges and Aviation Costs
Jet-fuel prices can swing 10-15% within a quarter, eroding margins because surcharge mechanisms often lag spot markets. Fuel averages 25% of international express operating costs so that pronounced spikes may trigger schedule cuts or down-gauge decisions on low-yield sectors. Big three integrators apply indexed surcharges, yet the timing mismatch exposes them to short-term losses, particularly on ultra-long-haul Asia-to-U.S. sectors[4]Wall Street Journal, “Express Carriers Struggle With Fuel Cost Volatility,” wsj.com. Investments in new-generation freighters and sustainable aviation fuels promise efficiency gains but entail heavy upfront outlays.
Stringent Customs and Security Compliance
Post-pandemic supply-chain vigilance has tightened X-ray screening and advance data requirements, adding processing minutes that dilute the express value proposition. Small operators struggle with hardware and training costs needed for 100% e-manifest accuracy, pushing them toward alliances or exit from the international express service industry. Divergent national rules also create patchwork processes that complicate network planning; harmonization efforts remain gradual despite World Customs Organization initiatives.
*Our forecasts treat driver/restraint impacts as directional, not additive. The impact forecasts reflect baseline growth, mix effects, and variable interactions.
Segment Analysis
By End User Industry: Healthcare Leads Growth Outlook
E-commerce retained a 43.62% share of the international express service market in 2025, powered by marketplaces offering duty-paid checkout and guaranteed delivery date visibility. Subscription-box sellers and crowdsourced creators add incremental parcel counts that favor express over postal due to tracking expectations. Manufacturing lines depend on rapid replenishment for components, stabilizing second-rank share even as macro cycles shift. Financial services maintain a niche for notarized documents requiring chain-of-custody safeguards.
Healthcare posts a 7.16% CAGR between 2026-2031, the fastest among end users, underpinned by genomic-test kits, cell-therapy shipments, and clinical-trial supplies that mandate a 2-8 °C cold chain. DHL’s EUR 2 billion (USD 2.20 billion) life-sciences expansion plan allocates half the funds to the Americas, underscoring the carrier's conviction in premium healthcare lanes. Primary industry and wholesale trade customers also turn to express for urgent equipment spares that avert costly downtime in mines, rigs, and distribution centers. These varied verticals ensure the international express service market remains diversified across economic contexts.


By Shipment Weight: Light Parcels Sustain Volume Leadership
Lightweight parcels held 59.21% of the international express service market share in 2025, as consumer e-commerce and document delivery dominated order books. Their high drop-density favors automated sortation and cycle-time targets of three to five days across continents. The international express service market size attributable to light parcels is poised for steady mid-single-digit growth as social-commerce platforms scale cross-border sales. In contrast, medium-weight consignments carry industrial components that sustain process industries, yielding stable if lower margins because handling requires more floor space. Heavy parcels, while only a slice of total volume, are forecast at a 6.05% CAGR between 2026-2031 as aerospace and automotive producers lean on expedited replenishment for high-value parts.
Light-parcel operators enjoy superior network turns yet contend with intense price competition from postal hybrids; sustaining yield will depend on value-added features like precise delivery-window selection and carbon-offset badges. Heavy-item specialists, meanwhile, leverage limited capacity to command price premiums, especially on lanes facing capacity constraints from airspace restrictions. Medium parcels represent a bridge segment where differentiated handling such as kitting, labeling, and return-logistics programs can lift margins. The blended contribution keeps the international express service market resilient, with diversification across weight bands insulating carriers from swings in any single demand pool.
By Route: Inter-Region Revenues Dominate, Intra-Region Momentum Builds
Inter-region shipments captured 72.34% of 2025 revenue, reflecting entrenched flows between Asian factories and North American or European shoppers. These lanes generate the highest revenue per kilo but remain vulnerable to fuel volatility and congestion at major hubs. Conversely, intra-region services post a 5.55% CAGR outlook between 2026-2031, buoyed by trade integration projects such as ASEAN Economic Community initiatives that cut overland transit barriers. The international express service market size attributable to intra-region flows is rising as regional fulfillment centers relocate closer to consumer clusters, slicing delivery windows while sidestepping costly long-haul airspace. Yamato’s U.S.–Mexico trucking corridor typifies how providers bundle multimodal legs to offer duty-paid, day-definite services.
Network planners are recalibrating aircraft rotations to balance east-bound and west-bound load factors, thereby raising asset utilization. Emerging corridors such as South-South trade between Latin America and Africa are gaining experimental frequencies under ACMI leasing models that cap financial risk. For intra-APAC express, short-haul 737-800Fs and regional wide-bodies offer flexible uplift that pairs with trucking to bypass congested gateway airports. Such measures collectively enhance service diversity within the international express service market and hedge against macro shocks on flagship intercontinental sectors.
Geography Analysis
Asia-Pacific commanded 54.38% of the international express service market share in 2025 as integrated manufacturing clusters across China, Vietnam, and Indonesia generated dense outbound flows. Carriers exploit a web of tier-1 and tier-2 city gateways supported by competitive airport handling fees and favorable customs pilot programs. Investments in night-sort hubs near Shenzhen and Kuala Lumpur enhance cross-border cut-off flexibility, encouraging sellers to postpone order finalization until late evening cut-offs. Demand is equally strong inbound, driven by affluent metropolitan shoppers in Japan, South Korea, and Australia seeking niche overseas brands. Regulatory thrusts to decarbonize logistics spur fleet upgrades to new-technology freighters and electric last-mile vans, adding capital intensity yet enabling greener brand narratives.
The Middle East and Africa log the highest regional CAGR at 7.55% for 2026-2031 as multi-modal free zones such as Dubai South, King Abdullah Port, and Kigali Logistics Platform mature into regional redistribution nodes. Aramex’s robotic sortation line in Jeddah and UPS’s planned Dubai South facility exemplify ecosystem upgrades that cut transit times to African growth cities and the Indian subcontinent. Gulf carriers leverage belly-hold capacity on passenger wide-bodies to offer overnight links between Asia and Europe, reinforcing the international express service market’s hub-and-spoke architecture for time-critical cargo.
Europe, North America, and South America together account for the remaining share with mid-single-digit growth outlooks. Europe enjoys regulatory harmonization inside the customs union, yet post-Brexit UK-EU flows require specialized express solutions that manage VAT reconciliation and real-time compliance audits. North America shows stable parcel counts but rising customer expectations for emissions disclosure and same-day cross-border options on Canada-U.S. lanes. South America’s manufacturing resurgence in electronics and automotive parts is prompting integrators to add direct flights into São Paulo and Bogotá, lifting service competitiveness against maritime or deferred air freight. Collectively, geographic diversification cushions the international express service market against region-specific shocks.

Competitive Landscape
The international express service market is moderately consolidated, with DHL, FedEx, and UPS anchoring global coverage through multi-continent air fleets, expansive ground assets, and proprietary IT stacks. Their dominance forces midsize specialists such as SF Express, Aramex, CJ Logistics, and Yamato to carve niche advantages in home regions or vertical specialties. Artificial-intelligence route optimization and dynamic pricing narrow historical scale gaps, enabling challengers to match reliability on selective lanes. Strategic emphasis has shifted from general freight to high-margin segments like healthcare, perishables, and high-tech machinery, explaining why DHL earmarked EUR 2 billion (USD 2.20 billion) for life sciences and why FedEx opened a Qatar free-zone hub to bridge Asia-Europe flows.
Mergers and acquisitions remain a key tool for coverage expansion. European logistics M&A volumes reached 364 deals in 2024, a 15% jump year over year, highlighted by DSV’s bid for Schenker and SF Express’ EUR 280 million (USD 309 million) purchase of a European forwarder. Cross-border deals represented 44% of transactions, underscoring network consolidation aimed at lowering per-package overheads and bargaining power with airlines and ground-handlers. Despite consolidation, regulatory scrutiny limits megadeals, encouraging alliances and joint ventures such as Japan Post’s pact with International Distributions Services to share long-haul uplift from Tokyo to London.
Technology partnerships amplify competitive positioning. UPS adopted an AI route-optimization engine that shaved minutes off each stop, promising lower emissions and driver overtime. FedEx rolled out a carbon-neutral premium lane in Europe, bundling sustainable aviation fuel credits with electric terminal handling. DHL’s tie-up with Microsoft to deploy predictive analytics across supply-chain touchpoints illustrates the strategic shift toward data-driven differentiation, ensuring that customer-experience metrics—on-time performance, proactive alerting, and invoice accuracy—remain core battlegrounds in the international express service market.
International Express Service Industry Leaders
DHL Group
FedEx
La Poste Group
SF Express (KEX-SF)
United Parcel Service of America, Inc. (UPS)
- *Disclaimer: Major Players sorted in no particular order

Recent Industry Developments
- September 2025: FedEx and Qatar Free Zones Authority inaugurated a regional logistics facility at Ras Bufontas to link Asia, Europe, and North America.
- April 2025: DHL allotted EUR 2 billion (USD 2.20 billion) over five years for life-sciences infrastructure, half earmarked for the Americas.
- March 2025: Dubai South and UPS agreed to open a new facility that deepens the carrier’s UAE presence and supports wider MEA growth plans.
- October 2024: Otto Group opened a EUR 100 million (USD 110 million) automated hub in Poland to accelerate cross-border capacity for Central Europe.


Global International Express Service Market Report Scope
Heavy Weight Shipments, Light Weight Shipments, Medium Weight Shipments are covered as segments by Shipment Weight. Inter-Region, Intra-Region are covered as segments by Route. E-Commerce, Financial Services (BFSI), Healthcare, Manufacturing, Primary Industry, Wholesale and Retail Trade (Offline), Others are covered as segments by End User Industry. Africa, Asia Pacific, Europe, GCC, North America, South America are covered as segments by Region.| Heavy Weight Shipments |
| Light Weight Shipments |
| Medium Weight Shipments |
| Inter-Region |
| Intra-Region |
| E-Commerce |
| Financial Services (BFSI) |
| Healthcare |
| Manufacturing |
| Primary Industry |
| Wholesale and Retail Trade (Offline) |
| Others |
| Asia-Pacific | By Country | Australia |
| China | ||
| India | ||
| Indonesia | ||
| Japan | ||
| Malaysia | ||
| Pakistan | ||
| Philippines | ||
| Thailand | ||
| Vietnam | ||
| Rest of Asia-Pacific | ||
| Europe | By Country | Albania |
| Bulgaria | ||
| Croatia | ||
| Czech Republic | ||
| Denmark | ||
| Estonia | ||
| Finland | ||
| France | ||
| Germany | ||
| Hungary | ||
| Iceland | ||
| Italy | ||
| Latvia | ||
| Lithuania | ||
| Netherlands | ||
| Norway | ||
| Poland | ||
| Romania | ||
| Russia | ||
| Slovak Republic | ||
| Slovenia | ||
| Spain | ||
| Sweden | ||
| Switzerland | ||
| United Kingdom | ||
| Rest of Europe | ||
| Middle East and Africa | By Country | Egypt |
| Nigeria | ||
| Qatar | ||
| Saudi Arabia | ||
| South Africa | ||
| GCC | ||
| UAE | ||
| Rest of Middle East and Africa | ||
| North America | By Country | Canada |
| Mexico | ||
| United States | ||
| Rest of North America | ||
| South America | By Country | Argentina |
| Brazil | ||
| Chile | ||
| Rest of South America | ||
| Rest of World |
| Shipment Weight | Heavy Weight Shipments | ||
| Light Weight Shipments | |||
| Medium Weight Shipments | |||
| Route | Inter-Region | ||
| Intra-Region | |||
| End User Industry | E-Commerce | ||
| Financial Services (BFSI) | |||
| Healthcare | |||
| Manufacturing | |||
| Primary Industry | |||
| Wholesale and Retail Trade (Offline) | |||
| Others | |||
| Region | Asia-Pacific | By Country | Australia |
| China | |||
| India | |||
| Indonesia | |||
| Japan | |||
| Malaysia | |||
| Pakistan | |||
| Philippines | |||
| Thailand | |||
| Vietnam | |||
| Rest of Asia-Pacific | |||
| Europe | By Country | Albania | |
| Bulgaria | |||
| Croatia | |||
| Czech Republic | |||
| Denmark | |||
| Estonia | |||
| Finland | |||
| France | |||
| Germany | |||
| Hungary | |||
| Iceland | |||
| Italy | |||
| Latvia | |||
| Lithuania | |||
| Netherlands | |||
| Norway | |||
| Poland | |||
| Romania | |||
| Russia | |||
| Slovak Republic | |||
| Slovenia | |||
| Spain | |||
| Sweden | |||
| Switzerland | |||
| United Kingdom | |||
| Rest of Europe | |||
| Middle East and Africa | By Country | Egypt | |
| Nigeria | |||
| Qatar | |||
| Saudi Arabia | |||
| South Africa | |||
| GCC | |||
| UAE | |||
| Rest of Middle East and Africa | |||
| North America | By Country | Canada | |
| Mexico | |||
| United States | |||
| Rest of North America | |||
| South America | By Country | Argentina | |
| Brazil | |||
| Chile | |||
| Rest of South America | |||
| Rest of World | |||


Market Definition
- Courier, Express, and Parcel - The Courier, Express, and Parcel services, often called as CEP Market, refers to the logistics and postal service providers which specialize in moving small goods (parcels/packages). It captures the overall market size (USD) and market volume (number of parcels) of (1) the shipments/parcels/packages which are under 70kgs/ 154lbs weight, (2) Business Customer packages viz. Business-to-Business (B2B) & Business-to-Consumer (B2C) as well as private customer packages (C2C), (3) non-express parcel delivery services (Standard and Deferred) as well as express parcel delivery services (Day-Definite-Express and Time-Definite-Express), (4) domestic as well as international shipments.
- Demographics - To analyse total addressable market demand, population growth & forecasts have been studied and presented in this industry trend. It represents population distribution across categories like gender (male/female), development area (urban/rural), major cities among other key parameters like population density and final consumption expenditure (growth and share % of GDP). This data has been used for assessing the fluctations in demand & consumption expenditure, and the major hotspots (cities) of potential demand.
- Domestic Courier Market - Domestic Courier Market refers to the CEP shipments wherein the origin and destination is within the boundary of the geography studied (country or region as per the scope of report). It captures the market size (USD) and market volume (number of parcels) of (1) the shipments/parcels/packages which are under 70kgs/ 154lbs weight, including light weight shipments, medium weight shipments and heavy weight shipments (2) Business Customer packages viz. Business-to-Business (B2B) & Business-to-Consumer (B2C) as well as private customer packages (C2C), (3) non-express parcel delivery services (Standard and Deferred) as well as express parcel delivery services (Day-Definite-Express and Time-Definite-Express).
- E-Commerce - This end user industry segment captures the external (outsourced) logistics expenditure incurred by the e-tailers, through online sales channel, on Courier, Express, and Parcel (CEP) services. The scope includes (i) the supply chain of a company's online customer orders being fulfilled, (ii) the process of getting a product from the point of manufacturing to the point at which it is delivered to consumers. It involves managing inventory (deferred as well as time critical), shipping, and distribution.
- Export Trends and Import Trends - Overall logistics performance of an economy is positively and significantly (statistically) correlated to its trade performance (exports and imports). Hence, in this industry trend, total value of trade, major commodities/ commodity groups and the major trade partners, for the studied geography (country or region as per the scope of report) have been analysed alongside the impact of major trade/logistics infrastructure investments & regulatory environment.
- Financial Services (BFSI) - This end user industry segment captures the external (outsourced) logistics expenditure incurred by the BFSI players, on Courier, Express, and Parcel (CEP) services. CEP is important to the financial services industry in shipping of confidential documents and files. The establishments in this sector are engaged in (i) financial transactions (that is, transactions involving the creation, liquidation, or change in ownership of financial assets) or in facilitating financial transactions, (ii) financial intermediation, (iii) the pooling of risk by underwriting annuities and insurance, (iv) providing specialized services that facilitate or support financial intermediation, insurance and employee benefit programs, and (v) monetary control - the monetary authorities.
- Fuel Price - Fuel price spikes can cause delays and diruption for logistics service providers (LSPs), while drops in the same can result in higher short-term profitability and increased market rivalry to offer consumers with the best deals. Hence, the fuel price variations have been studied over the review period and presented along with the causes as well as market impacts.
- GDP Distribution by Economic Activity - Nominal Gross Domestic Product and distribution of the same, across major economic sectors in the geography studied (country or region as per scope of the report) have been studied and presented in this industry trend. As GDP is positively related to the profitability and growth of logistics industry, this data has been used in adjunction to the input-output tables/ supply-use tables for analyzing the potential major contributing sectors towards the logistics demand.
- GDP Growth by Economic Activity - Growth of Nominal Gross Domestic Product across major economic sectors, for the geography studied (country or region as per scope of the report) have been presented in this industry trend. This data has been utilized for assessing the growth of logistics demand from all the market end users (economic sectors considered here).
- Healthcare - This end user industry segment captures the external (outsourced) logistics expenditure incurred by the Healthcare players (Hospitals, clinics, mrdical centres) , on Courier, Express, and Parcel (CEP) services. The scope includes CEP services involved in the defrerred as well time critical movement of medical goods & supplies (surgical supplies and instruments, including gloves, masks, syringes, equipment). The establishments in this sector (i) include the ones providing medical care exclusively (ii) deliver services by trained professionals (iii) involve processes, including labor inputs of health practitioners with the requisite expertise (iv) are defined based on the educational degree held by the practitioners included in the industry.
- Inflation - Variations in both Wholesale Price Inflation (YoY change in producer price index) and Consumer Price Inflation have been presented in this industry trend. This data has been used to assess the inflationary environment as it plays a vital role in smooth functioning of the supply chain, directly impacting the logistics operational cost components e.g., pricing of tyres, driver wages & benefits, energy/fuel prices, maintenace costs, toll charges, warehousing rents, custom brokerage, forwarding rates, courier rates etc. hence impacting the overall freight and logistics market.
- Infrastructure - As infrastructure plays a vital role in an economy's logistics performance, variables like length of roads, distribution of road length by surface category (paved v/s unpaved), distribution of road length by road classification (expressways v/s highways v/s other roads), rail length, volume of containers handled by major ports and tonnage handled by major airports have been analysed and presented in this industry trend.
- International Express Service Market - International Express Service Market refers to the CEP shipments wherein the origin or destination is not within the boundary of the geography studied (country or region as per the scope of report). It captures the market size (USD) and market volume (number of parcels) of (1) the shipments/parcels/packages which are under 70kgs/ 154lbs weight, including light weight shipments, medium weight shipments and heavy weight shipments (ii) Inter-Region as well as Intra-Region Shipments
- Key Industry Trends - The report section named "Key Industry Trends" include all the key variables/parameters studied to better analyze the market size estimates and forecasts. All the trends have been presented in the form of data points (time series or latest available data points) along with analysis of the paramter in the form of concise market relevant commentary, for the geography studied (country or region as per the scope of report).
- Key Strategic Moves - The action taken by a company to differentiate from its competitor or used as a general strategy is referred to as a key strategic move (KSM). This includes (1) Agreements (2) Expansions (3) Financial Restructuring (4) Mergers and Acquisitions (5) Partnerships, and (6) Product Innovations. Key players (Logistics Service Providers, LSPs) in the market have been shortlisted, their KSM have been studied and presented in this section.
- Logistics Performance - Logistics Performance and Logistics Costs are the backbone of trade, and influences trade costs, making countries compete globally. Logistics performance is influenced by market wide adopted supply chain management strategies, government services, investments & policies, fuel/ energy costs, inflationary environment etc. Hence, in this industry trend, the logistics performance of the geography studied (country/ region as per the scope of report) has been analysed and presented over the review period.
- Manufacturing - This end user industry segment captures the external (outsourced) logistics expenditure incurred by the Manufacturing industry (including Hi-Tech/Technology) players, on Courier, Express, and Parcel (CEP) services. The end user players considered are the establishments primarily engaged in the chemical, mechanical or physical transformation of materials or substances into new products. Logistics Service Providers (LSPs) play a crucial role in maintaining a smooth flow of raw materials across the supply chain, enabling timely delivery of finished goods to distributors or end customers and storing & supplying the raw materials to clients for just-in-time manufacturing.
- Other End Users - Other end user segment captures the external (outsourced) logistics expenditure incurred by the construction, real estate, educational services, and professional services (administrative, waste management, legal, architectural, engineering, design, consulting, scientific R&D), on Courier, Express, and Parcel (CEP) services. Logistics Service Providers (LSPs) plays a crucial role in the reliable movement of time critical supplies and documents to/from these industries such as transporting any equipment or resources required, shipping confidential documents and files.
- Primary Industry - This end user industry segment captures the external (outsourced) logistics expenditure incurred by the AFF (Agriculture, Fishing, and Forestry) and Extraction indsutry (Oil &Gas, Quarrying and Mining) players, on Courier, Express, and Parcel (CEP) services. The end user players considered are the establishments (i) primarily engaged in growing crops, raising animals, harvesting timber, harvesting fish & other animals from their natural habitats and providing related support activities; (ii) that extract naturally occurring mineral solids, such as coal and ores; liquid minerals, such as crude petroleum; and gases, such as natural gas. Herein, Logistics Service Providers (LSPs) (i) play a crucial role in acquisition, storage, handling, transportation, and distribution activities for the optimal & continuous flow of inputs (seeds, pesticides, fertilizers, equipment, and water) from manufacturers or suppliers to the producers and smooth flow of output (produce, agro-goods) to distributors/ consumers; (ii) cover entire phases from upstream to downstream and play a crucial role in the transportation of machinery, drilling equipments, extracted minerals, crude oil & natural gas and refined/ processed products from one place to another. This includes both termperature controlled and non-temperature controlled logistics, as and when required according to the shelf life of goods being transported or stored.
- Producer Price Inflation - It indicates inflation from viewpoint of the producers viz. the average selling price received for their output over a period of time. Annual change (YoY) of producer price index is reported as wholesale price inflation in the "Inflation" industry trend. As WPI captures dynamic price movements in most comprehensive way, it is widely used by governments, banks, industry, business circles and is deemed important in formulation of trade, fiscal and other economic policies. The data has been used in adjunction to consumer price inflation for better understanding the inflationary environment.
- Segmental Revenue - Segmental Revenue has been triangulated or computed and presented for all the major players in the market. It refers to the courier, express, and parcel (CEP) market specific revenue earned by the company, over the base year of study, in the geography studied (country or region as per the scope of report). It is computed through the study and analysis of major parameters like financials, service portfolio, employee strength, fleet size, investments, number of countries present in, major economies of concern, etc. that have been reported by the company in its annual reports, webpage. For companies having scarce financial disclosures, paid databases like D&B Hoovers, Dow Jones Factiva have been resorted to and verified through industry/expert interactions.
- Transport and Storage Sector GDP - Value and growth of Transport and Storage Sector GDP has a direct relation to the freight and logistics market size. Hence, this variable has been studied and presented over the review period, in value terms (USD) and as share % of total GDP, in this industry trend. The data has been supported by concise and relevant commentary around the investments, developments, and current market scenario.
- Trends in E-Commerce Industry - Enhanced internet connectivity and boom in smartphone penetration, coupled with increasing disposable incomes, has led to a phenomenal growth in the e-commerce market globally. Online shoppers require fast and efficient delivery of their orders leading to an increase in the demand for logistics services especially e-commerce fulfilment services. Hence, the Gross Merchandise Value (GMV), historial and projected growth, breakup of major commodity groups in e-commerce industry for the studied geography (country or region as per scope of the report) have been analysed and presented in this industry trend.
- Trends in Manufacturing Industry - Manufacturing industry involves the transformation of raw materials into finished products, while logistics industry ensures the efficient flow of raw materials to the factory, and the transport of manufactured products to the distributors & consumers. Demand-Supply of both industries are highly cross-linked and critical for a seamless supply chain. Hence, the Gross Value Added (GVA), breakup of GVA into major manufacturing sectors, and growth of manufacturing industry over the review period have been analysed and presented, in this industry trend.
- Wholesale and Retail Trade (Offline) - This end user industry segment captures the external (outsourced) logistics expenditure incurred by the wholesalers and retailers, through offline sales channel, on Courier, Express, and Parcel (CEP) services. The end user players considered are the establishments primarily engaged in wholesaling or retailing merchandise, generally without transformation, and rendering services incidental to the sale of merchandise. Logistics Service Providers (LSPs) plays a crucial role in the reliable movement of supplies to and finished products from production houses to the distributors and finally to the end customer covering activites like material sourcing, transportation, order fulfillment, warehousing & storage, demand forecasting, inventory management etc.
| Keyword | Definition |
|---|---|
| Axle Load | The axle load refers to the total load (weight) bearing on the roadway through wheels connected to a given axle. Across the globe, there are systems in place to ensure axle load monitoring, wherein surpassing the defined limits set by the concerned regulatory authority can lead to penalty/fine. For transportation of goods via road this can be an important determinant of costs as knowledge about the axle load limits can be used to (i) load the vehicle optimally for maximizing profits (ii) avoid exceeding the same and hence the probable fines associated (iii) avoid wear and tear of the vehicle (iv) avoid damage to pavement resulting in noticeable public maintenance and repair costs (v) achieve better turnaround time. |
| Back Haul | Backhaul is the return movement of a transport vehicle from its original destination to its original point of departure, and can include full, partial, or empty truck loads (all or part of the way) depending on the visibility of the local freight ecosystem. In this regard, transportation of empty containers to the point of origin, known as deadheading is also a significant factor, considering the supply/container shortages across the geographies, resulting in cost escalation and under optimized profit potential attainment. Generally, the carriers offer discounts on the backhaul, to secure freight for the trip. |
| Bill of Lading (BOL) | A bill of lading is a legal contract document issued by a carrier to a shipper to acknowledge reception of their cargo, and is evidence for the contract of carriage between the two parties. Broadly it details the (i) type, quantity, and other specifications of the goods being carried (ii) destination, and terms & conditions of the shipment (iii) carrier and drivers with all the necessary information to process the shipment, which can be used for insurance and customs clearance purposes (iv) assurance that the consignment is damage-free and ready to be shipped to the consignee. In this regard, a house bill of lading (HBL) is a document issued by a freight forwarder or a non-vessel operating common carrier (NVOCC) to acknowledge receipt of items for shipment (to a shipper). If shipments from several shippers are involved a master bill of lading (MBL) might be involved which is a consolidated version of the same for all the shipments being taken care of by the carrier (to a common destination) and might be issued by the carrier to the freight forwarder or the shipper (depending on who books the transport). |
| Bunkering | Bunkering is the process of supplying fuel to power the propulsion system of a ship. It includes the logistics of loading and distributing the fuel among available shipboard tanks. In this regard, (i) Bunker fuel is technically any type of fuel oil used aboard ships. It gets its name from the containers on ships and in ports that it is stored in; in the days of steam they were coal bunkers but now they are bunker-fuel tanks, (ii) Bunker refers to the spaces (Tank) on board a vessel to store fuel, (iii) Bunker trader refers to a person dealing in trade of bunker (fuel), (iv) Bunker call is made when a cargo ship anchors or berths in a port to take on bunker oil or supplies, (v) Bunkering service is the supply of a requested quality and quantity of bunkers to a ship. Bunkering is signficant from point of view of freight rates applicable to the shipper as Bunker Contribution (BUC)/ Fuel Adjustment Factor (FAF)/ Bunker Adjustment Factor (BAF) are applied by shipping lines to offset the effect of fluctuations in the cost of bunkers. |
| Cabotage | Transport by a vehicle registered in a country, performed on the national territory of another country. Cabotage law may restrict domestic cargo traffic to be carried in its own nationally registered, and sometimes built and crewed vehicles, though regulations vary across industries/commodity groups/countries and sometimes specify maximum allowable percentage of cabotage that can be serviced by foreign registered fleet. |
| C-commerce | Collaborative commerce (also known as C-commerce), (i) describes electronically enabled business interactions among an enterprise’s internal personnel, business partners and customers throughout a trading community (industry, industry segment, supply chain or supply chain segment); (ii) is the optimization of supply and distribution channels to capitalize on the global economy by using new technology efficiently. Advantages of C-commerce, to detail few include (i) maximization of organization's efficiency and profitability (ii) technology integration with physical channels to allow companies to work together (iii) increased information exchange such as inventory and product specifications, using the web as an intermediary (iv) increased competitiveness by reaching a broader audience. Examples of C-commerce, also known as peer-to-peer commerce, include (i) companies that allow consumers to rent things from each other, or marketplaces, such as Meta (formerly Facebook) Marketplace, that allow the sale of used goods; (ii) DoorDash teamed up with many national brands, such as McDonald’s and Chipotle, to offer fast food delivery, building their business model on c-commerce. They have since expanded their delivery service from restaurants to retailers and even offer 'fleets' of drivers to businesses. |
| Courier | A business/company that delivers packages/parcels/shipments (upto 70 kgs) including quick door to door pickup and delivery service for goods or documents, domestically or internationally, on a commercial contract basis. Example, DHL Group, FedEx, United Parcel Service of America, Inc., USPS, International Distributions Services, J&T Express, SF Express among several others |
| Cross docking | Cross docking is a practice in logistics management that includes unloading incoming delivery vehicles and loading the materials directly into outbound delivery vehicles, omitting traditional warehouse logistical practices and saving time and money. It requires close synchronization of both inbound and outbound movements. It is highly significant in reduction of costs pertaining to warehousing & storage (and the associated Value Added Services). |
| Cross Trade | International transport between two different countries performed by a vehicle registered in a third country. A third country is a country other than the country of loading/embarkation and the country of unloading/disembarkation. Cross Trade law may restrict international cargo traffic to be carried by respective country's registered vehicles, and sometimes built and crewed vehicles, though regulations vary across industries/commodity groups/countries and sometimes specify maximum allowable percentage of cross trade that can be serviced by foreign registered fleet. |
| Customs Clearance | The process of declaring and clearing cargoes through customs. It includes the procedures involved in getting cargo released by Customs through designated formalities such as presenting import license/permit, payment of import duties and other required documentations by the nature of the cargo. In this regard, a customs broker is a person or company licensed by the respective department of the country to act on behalf of freight importers and exporters. |
| Dangerous Goods | Dangerous goods (or hazardous materials or HAZMAT) include flammable liquids/solids, gases (compressed, liquified, dissolved under pressure), corrosives, oxidising substances, explosive substances and articles, substances which on contact with water emit flammable gasses, organic peroxides, toxic substances, infectious substances, radioactive materials, miscellaneous dangerous goods and articles. |
| First mile Delivery | First mile delivery refers to the (i) first stage of the freight/shipment/cargo/courier transportation (ii) the transportation of goods from a merchant’s premises or warehouse to the next fulfillment centre/warehouse/hub from where the goods are forwarded (iii) shipping goods from local distribution centers to stores (For retailers) (iv) transportation of finished goods from a plant or a factory to a distribution center (For manufacturers), (v) pick up of goods from the end-customer’s home or store followed by movement to a warehouse or storage location (movers and packers), (vi) process where goods are picked up from a retailer and then transferred to third-party logistics providers or courier service providers to be delivered to the end-consumer (e-commerce). Once the package reaches the next warehouse or the courier’s hub, it is then sorted and transported further until it reaches the customer’s doorstep. Example, if one chooses UPS as a courier, first-mile delivery will be the product being delivered from manufacturer's/retailer's warehouse to the UPS’s warehouse/ fulfilment centre. |
| Last Mile Delivery | Last mile delivery refers to the very last step of the delivery process when a parcel is moved from a transportation hub (warehouse or a distribution center or fulfillment centre) to its final destination, which usually is a personal residence/retail store/ business, or parcel locker. It accounts for around half of the total cost involved in entire process of first mile, middle mile, and last mile delivery, though it can vary shipment to shipment, based on commodity, business model and similar factors. |
| Milkrun | A Milk Run is a delivery method used to transport mixed loads from various suppliers to one customer, using lean management principles applied to logistics. Instead of each supplier sending a truck every week to meet the needs of one customer, one truck (or vehicle) visits the suppliers to pick up the loads for that customer. This method of transport got its name from the dairy industry practice, where one tanker used to collect milk from several dairy farms for delivery to a milk processing company. A milk run can be a more efficient way to handle logistics but require proper planning. If the route involves products from different companies, there is need for an agreement about cost-sharing and other aspects of the cooperative delivery arrangement. Once the group settles these issues, this delivery method can save time and money for everyone by pooling operation costs and resources. |
| Multi country consolidation | Multi-Country Consolidation (MCC) is a cost-effective solution that consolidates one's cargo from different countries of origin to build Full Container Loads (FCL). MCC is most suitable for companies that import light volumes of goods from multiple countries but want to take advantage of the more economic FCL freight rates. Apart from costing some of the other advantages include (i) flexibility to choose suppliers from a wider range of origin countries without worrying about the logistics to final destination from each origin, (ii) ability to pick the most suitable suppliers from many different countries for one's business operations. The increase in one's sourcing options by MCC provides the kind of flexibility needed in competitive global markets. |
| Q-commerce | Q-commerce, also referred to as quick commerce, is a type of e-commerce where emphasis is on quick deliveries, typically in less than an hour. The companies providing Q-Commerce services might have vertically intergrated model or might be using third party delivery platforms (outsourced logistics). It has advantages like (i) competitve USP, (ii) potential to earn greater profit margins, (iii) better customer experience, (iv) guaranteed availability of products, (v) traceability, and (vi) scaleability. |
| ReverseLogistics | Reverse logistics is a type of supply chain management that moves goods from customers back to the sellers or manufacturers and may involve ciruclar economy principles (3Rs) viz. recycling, reuse (repurposing, reselling), reducing or repairing. In this regard, reverse commerce (or Recommerce) is the selling of previously owned items through physical or online marketplaces/distribution channels to buyers who reuse, recycle or resell them. |


Research Methodology
Mordor Intelligence follows a four-step methodology in all our reports.
- Step-1: Identify Key Variables: In order to build a robust forecasting methodology, the variables and factors identified in Step-1 are tested against available historical market numbers. Through an iterative process, the variables required for market forecast are set and the model is built on the basis of these variables.
- Step-2: Build a Market Model: Market-size estimations for the forecast years are in nominal terms. Inflation is considered to be a part of the pricing, and the average selling price (ASP) is varying throughout the forecast period for each country
- Step-3: Validate and Finalize: In this important step, all market numbers, variables and analyst calls are validated through an extensive network of primary research experts from the market studied. The respondents are selected across levels and functions to generate a holistic picture of the market studied.
- Step-4: Research Outputs: Syndicated Reports, Custom Consulting Assignments, Databases & Subscription Platforms


