Express Delivery Market Size and Share
Market Overview
| Study Period | 2020 - 2031 |
|---|---|
| Market Size (2026) | USD 272.17 Billion |
| Market Size (2031) | USD 361.26 Billion |
| Growth Rate (2026 - 2031) | 5.83% CAGR |
| Fastest Growing Market | Asia Pacific |
| Largest Market | North America |
| Market Concentration | Medium |
Major Players
*Disclaimer: Major Players sorted in no particular order Image © Mordor Intelligence. Reuse requires attribution under CC BY 4.0. |
|
Express Delivery Market Analysis by Mordor Intelligence
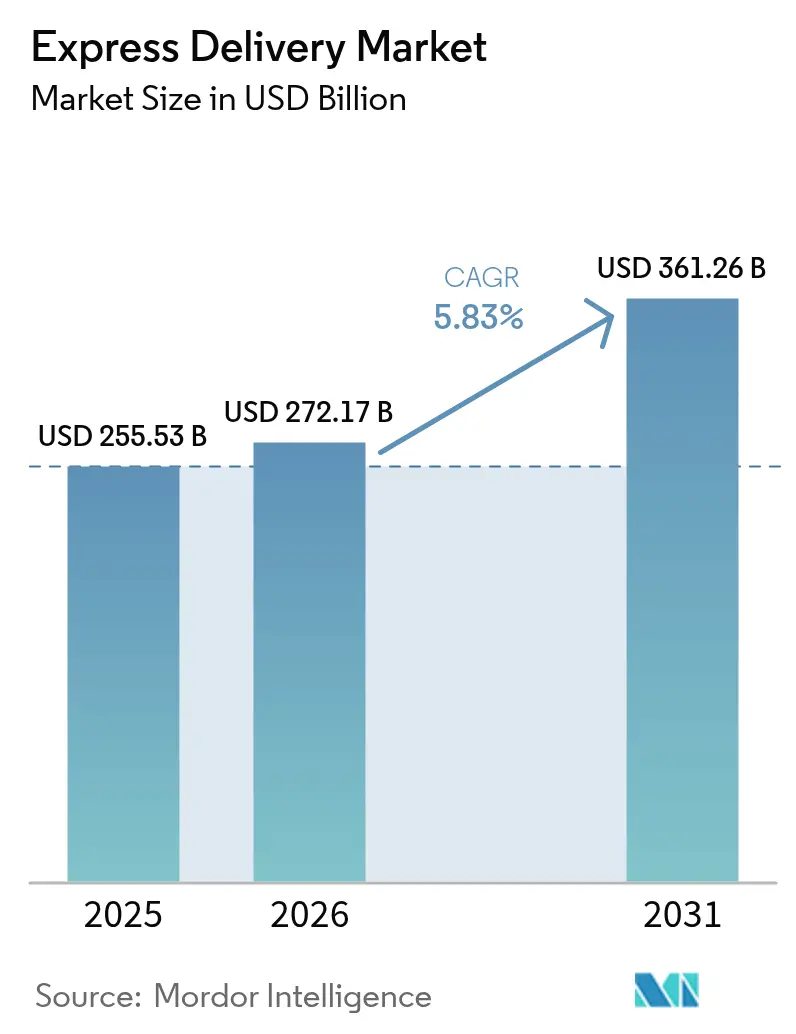
The Express Delivery Market size was valued at USD 255.53 billion in 2025 and is estimated to grow from USD 272.17 billion in 2026 to reach USD 361.26 billion by 2031, at a CAGR of 5.83% during the forecast period (2026-2031).
The global express delivery market is growing steadily, driven by rising consumer demand for faster deliveries and the rapid expansion of cross-border e-commerce. Growth is supported by increasing investments in automation and last-mile infrastructure, such as FedEx’s USD 9.2 billion acquisition of InPost to strengthen parcel locker networks and enhance delivery efficiency. While North America remains the largest market due to mature fulfillment ecosystems, Asia-Pacific is the fastest-growing region, supported by surging parcel volumes and digital commerce adoption. At the same time, workforce constraints and regulatory complexities are accelerating the shift toward automation, real-time tracking, and more agile, technology-driven delivery networks.
Key Report Takeaways
- By destination, domestic shipments led with 65.71% market share in 2025, while international flows are projected to expand at a 7.32% CAGR through 2026-2031.
- By shipment weight, lightweight parcels captured 64.23% of the express delivery market share in 2025, whereas medium-weight consignments are forecast to grow at a 6.91% CAGR between 2026-2031.
- By model, B2C accounted for 46.21% market share of the express delivery market in 2025.
- By end user, e-commerce held a 33.21% share of the express delivery market size, and healthcare logistics is poised to expand at a 6.49% CAGR through 2026-2031.
- By mode, road transport dominated with a 47.98% share in 2025, whereas air cargo is the fastest-growing segment at a 6.82% CAGR.
- By geography, North America led with 35.17% revenue share in 2025, but Asia-Pacific is forecast to register a 7.47% CAGR between 2026-2031.
Note: Market size and forecast figures in this report are generated using Mordor Intelligence’s proprietary estimation framework, updated with the latest available data and insights as of 2026.
Global Express Delivery Market Trends and Insights
Drivers Impact Analysis*
| Driver | (~) % Impact on CAGR Forecast | Geographic Relevance | Impact Timeline |
|---|---|---|---|
| Expansion of cross-border online shopping activities | +1.5% | Asia-Pacific to North America/Europe corridors | Medium term (2-4 years) |
| Rising consumer demand for same-day and next-day delivery | +1.2% | North America, Western Europe, urban Asia-Pacific | Short term (≤ 2 years) |
| Automation and robotics in fulfillment centers | +1.0% | North America, Europe, China, Japan | Long term (≥ 4 years) |
| Growth in B2B urgent shipment requirements | +0.9% | Manufacturing hubs worldwide | Medium term (2-4 years) |
| Integration of advanced tracking and real-time visibility | +0.8% | Global | Medium term (2-4 years) |
| Retail-carrier partnerships for faster delivery | +0.7% | North America, Europe, select Asia-Pacific | Short term (≤ 2 years) |
| Source: Mordor Intelligence | |||
Rising Consumer Demand for Same-Day and Next-Day Delivery
Same-day and next-day promises have become a decisive purchase factor, with survey data showing that 61% of North American and European shoppers in 2024 expected delivery within 24 hours.[1]“International Transport Forum, “The Future of Last-Mile Delivery,” itf-oecd.orgRetailers offering these options reported materially higher cart conversion rates, compelling carriers to seed micro-fulfillment nodes in major metros. While Amazon extended same-day coverage to more than 90 U.S. cities by mid-2025, the economics remain challenging because same-day costs run 40-60% higher per parcel than next-day due to low stop density. Autonomous vans and drones are not yet a silver bullet because regulations and unit costs still lag readiness. As a workaround, carriers blend in crowdsourced gig drivers during peak surges, trading cost flexibility for new labor-classification risks. Balancing speed, cost, and compliance is now central to competitive positioning in the express delivery market.
Expansion of Cross-Border Online Shopping Activities
Cross-border parcels accounted for 23% of all express shipments in 2024, driven by easy digital payments and consumer appetite for niche imports. China’s outbound volumes alone surpassed 4 billion items as Customs Announcement 167/2024 slashed paperwork and inspection times.[2]“China State Council Customs Administration, “Announcement 167/2024,” gov.cn Yet looming policy shifts such as U.S. plans to remove the USD 800 de minimis threshold could double clearance times and costs for millions of low-value parcels. Europe is digitizing customs, but enforcement remains uneven, encouraging shippers to route via faster gateways and congesting those nodes. These frictions underscore why network resiliency and bonded-warehouse capacity are decisive levers for carriers chasing cross-border growth in the express delivery market.
Integration of Advanced Tracking and Real-Time Visibility Technologies
Real-time visibility has gone from a nice-to-have to a must-have, with 78% of B2B shippers willing to switch carriers if the update frequency falls below hourly. FedEx’s Surround platform aggregates feeds from 17 million IoT devices and trimmed misroutes by 18% year over year in 2025. UPS invested USD 1.2 billion in 2024 to blanket its network with RFID, boosting sort accuracy and supporting weekend delivery to 95% of U.S. households. Regional carriers lacking scale are tapping shared platforms, a move that may commoditize visibility and shift rivalry toward reliability and pricing. Capital intensity, cybersecurity exposure, and data-sharing norms will shape how visibility continues to differentiate players within the express delivery industry.
Expansion of Automated Sorting and Robotics in Fulfillment Centers
Robotics rolled out rapidly: MIT found that 42% of Western fulfillment sites hosted at least one robotic cell by 2024. DHL’s Leipzig hub now sorts 130,000 parcels per hour with 60% fewer workers, and SF Express operates more than 3,000 mobile sort robots across China. Payback is quickest in high-wage regions, yet software glitches can paralyze operations, as PostNL discovered in 2024 when downtime stranded 1.2 million parcels. Carriers increasingly retain manual fallback capacity, tempering headline cost savings. Even so, rising labor scarcity makes automation an inevitable pillar of long-term competitiveness in the express delivery market.
Restraints Impact Analysis*
| Restraint | (~) % Impact on CAGR Forecast | Geographic Relevance | Impact Timeline |
|---|---|---|---|
| Driver and courier workforce shortages | –1.1% | North America, Western Europe, Japan | Short term (≤ 2 years) |
| Regulatory barriers in international shipping and customs | –0.9% | U.S., EU, China borders | Medium term (2-4 years) |
| Failed delivery attempts and reverse logistics costs | –0.7% | High-density urban markets worldwide | Medium term (2-4 years) |
| Peak-season capacity constraints | –0.6% | North America, Europe, select Asia-Pacific | Short term (≤ 2 years) |
| Source: Mordor Intelligence | |||
Regulatory Barriers in International Shipping and Customs
Divergent customs regimes mean that 34% of cross-border parcels in 2024 faced clearance delays of over 48 hours, eroding service reliability. Elimination of the U.S. de minimis rule would funnel 2 million additional parcels a day into full inspection, overwhelming gateways already stretched during the holiday season. China’s reforms now require real-time data feeds into its Single Window, compelling carriers to upgrade IT pipelines. Within the EU, clearance times still range from six hours in Rotterdam to 36 hours in Naples, nudging shippers toward the fastest ports and feeding new chokepoints. Until global standards converge, regulatory drag will continue to shave growth off the express delivery market.
Driver and Courier Workforce Shortages in Key Markets
Courier employment in the United States slipped 3.2% in 2024, even as parcel demand climbed 8.1%. Median pay of USD 38,200 has not stemmed attrition, with turnover topping 40% as drivers migrate to gentler roles. Europe faces similar gaps: 18% of courier posts in Germany, France, and the Netherlands stayed vacant for more than 90 days in 2024. Japan’s demographic crunch is worse; nearly half of Yamato’s drivers are 50 or older. Carriers respond with autonomous vehicles, parcel lockers, and crowdsourced fleets, but scaling such fixes takes time, intensifying labor headwinds across the express delivery market.
*Our forecasts treat driver/restraint impacts as directional, not additive. The impact forecasts reflect baseline growth, mix effects, and variable interactions.
Segment Analysis
By Destination: Cross-Border Flows Outpace Domestic Growth
Domestic parcels accounted for 65.71% of 2025 revenue, as dense last-mile networks kept transit times short and customs paperwork nonexistent. International consignments, while smaller, are advancing at a 7.32% CAGR thanks to platforms that match global merchants with buyers and to regulatory softening in export powerhouses such as China. Carriers emphasize bonded hubs and data-driven pre-clearance to curb border delays and defend yields within the express delivery market.
Yet looming U.S. tariff changes, fragmented EU rollout of digital customs, and varied enforcement standards temper the outlook. Some merchants hedge by near-shoring inventory, which could siphon volume from long-haul lanes. Even so, Asia-to-Europe express routes grew 14% in 2024, triple intra-European gains, underscoring the structural pull of dispersed manufacturing and consumer demand for cross-border variety.


By Shipment Weight: Lightweight Parcels Dominate, Medium-Weight Gains Traction
Light parcels weighing under 2 kilograms accounted for 64.23% of revenue in 2025, as direct-to-consumer brands ship single SKUs to minimize inventory and packaging costs. The average Chinese parcel now weighs 1.3 kilograms, down from 1.8 kilograms in 2020. Medium-weight items are growing 6.91% a year as manufacturers rely on just-in-time replenishment, and subscription box firms bundle multiple goods.
For carriers, lightweight freight yields lower absolute revenue but higher per-kilo margins because handling is faster, whereas mid-weight freight commands premium pricing for time-sensitive B2B applications. This barbell forces operators to carefully balance the network mix to optimize the size of the express delivery market at each depot.
By Model: B2C Leads, C2C Emerges as High-Growth Segment
B2C remained the largest slice at 46.21% in 2025, powered by Amazon, Alibaba, and myriad D2C labels. C2C traffic, however, is sprinting at 6.45% CAGR as resale apps normalize peer-to-peer trade. Returns in C2C lanes cost carriers up to 40% more because pickups occur at scattered homes rather than consolidated depots.
Carriers counter this dilution by stitching dense drop-off networks with convenience stores and parcel lockers, aligning stop density with cost targets. High-margin, time-critical B2B flows continue to fund capex in automation, cementing their role as a stabilizer within the express delivery market.

By End-User Industry: E-Commerce Dominates, Healthcare Accelerates
E-commerce accounted for 33.21% of 2025 revenue, yet healthcare is the breakout vertical, with a 6.49% CAGR through 2031, as biologics and cell-and-gene therapies demand GDP-compliant cold chains. Specialty pharma already represents 45% of global drug revenue, and carriers have invested heavily in temperature-controlled networks to capture this premium niche.
Manufacturing and wholesale trade rely on just-in-time spares to dodge production halts, maintaining steady demand for expedited freight. Financial services deploy express couriers for payment cards and sensitive documents where digital alternatives remain non-compliant. Collectively, these verticals diversify revenue and shield the express delivery market from consumer demand swings.
By Mode of Transport: Road Dominates, Air Gains Share in Premium Segments
Road transport supplied 47.98% of 2025 shipments thanks to network flexibility and cost lineage. Airfreight, though more expensive, is growing at 6.82% CAGR as pharmaceutical cargo and urgent international orders soak up capacity. Dedicated freighter fleets—Amazon runs 110 aircraft—provide schedule control and peak elasticity unavailable in belly hold networks.
Intermodal pairings (air-to-truck, rail-to-truck) are gaining traction on transcontinental corridors, trading a marginal speed loss for cost relief. Nonetheless, driver scarcity and volatile diesel prices continue to pressure road margins, motivating trials of electric and autonomous vehicles across the express delivery market.
Geography Analysis
North America captured 35.17% of global revenue in 2025, anchored by dense fulfillment infrastructure and consumers willing to pay a premium for speed. Canada Post’s parcel share slid to 24% in 2024 as private operators outpaced its legacy labor model.[3]"Canada Post, “2024 Annual Report,” canadapost-postescanada.ca Near-shoring in Mexico is widening cross-border lanes, although customs chokepoints at Laredo and Otay Mesa keep dwell times high.
Asia-Pacific is the growth engine of the express delivery market, with a 7.47% CAGR. China alone processed 175.08 billion parcels in 2024, equal to roughly two-thirds of global traffic. India’s second-tier cities now receive two-day service from Delhivery, and Southeast Asian volumes are climbing as fintech unlocks remote retail. Japan and South Korea rely on automation and parcel lockers to counter shrinking labor pools, while Australia levies rural surcharges to offset outback delivery costs.
Europe’s mature markets grow slowly under stringent emissions and labor rules. Germany, the U.K., and France remain pivotal, but Central Europe is rising faster on the back of InPost’s 20,000-unit locker grid. Middle East and Africa traffic is concentrated in the Gulf, where Aramex and Emirates Post expand regional hubs. South America’s growth skews toward Brazil, Argentina, and Chile, yet infrastructure deficits keep lead times longer than North American benchmarks, pressing operators to blend air charters with road line-haul.
Mordor Intelligence provides coverage of the express delivery market across other key regional markets. Detailed country-level analysis extends to Germany, United States, and Vietnam incorporating local coverage and market participation, as required.


Competitive Landscape
The global express delivery market has moderate concentration. Global integrators focus on margin stability by rationalizing their networks, streamlining operations, and investing heavily in technology to enhance efficiency and resilience. Their strategies often emphasize automation, digital tracking, and optimized hub‑and‑spoke systems to balance costs against service reliability.
Amazon’s vertical build-out, which now includes 110 freighters and more than 400 fulfillment nodes, compresses order-to-door times and forces incumbents to retool automation roadmaps. UPS spent USD 1.2 billion in 2024 on RFID and AI-driven sort, matching FedEx, whose Surround platform shaved misroutes by 18% in 2025. Chinese carriers continue a volume-over-price gambit; SF held pricing at RMB 13.12 per parcel even as peers cut tariffs by up to 9% to stoke growth.
White-space opportunities center on healthcare cold chain and C2C logistics, both capital-intensive niches that deter low-cost entrants. Asset-light tech brokers have yet to dent reliability-driven express business, underscoring the enduring importance of owned networks. Scale in data, automation, and route density is set to widen competitive gaps across the express delivery industry.
Express Delivery Industry Leaders
-
Aramex PJSC
-
Australian Postal Corporation
-
Canada Post Corporation (Including Purolator, Inc.)
-
China Post
-
CJ Logistics
- *Disclaimer: Major Players sorted in no particular order


Recent Industry Developments
- February 2026: In a strategic move, FedEx, in collaboration with Advent International, inked a deal to acquire InPost S.A. for a whopping USD 9.2 billion. This acquisition seamlessly integrates FedEx's expansive global network with InPost's impressive portfolio of over 61,000 automated parcel lockers spread across nine European nations, bolstering their last-mile delivery prowess.
- February 2026: In a bid to supercharge its operational efficiency, FedEx rolled out Berkshire Grey's cutting-edge, fully autonomous robotic trailer unloader
- January 2026: In a move underscoring its commitment to automation, Grab Holdings snapped up Infermove, a Chinese AI robotics firm, for an estimated USD 50 million. This acquisition aims to bolster Grab's automated delivery capabilities, both at the first and last mile, across Southeast Asia, leveraging advanced autonomous driving systems and innovative sidewalk delivery robots.
- November 2025: Kroger, in a bid to amplify its online sales, deepened its collaborations with major players like Instacart, DoorDash, and Uber Eats. This expansion aims to harness a hybrid e-commerce model, effectively blending in-store offerings, third-party partnerships, and automated fulfillment solutions.


Global Express Delivery Market Report Scope
The Global Express Delivery Market Report is Segmented by Destination (Domestic, International), by Shipment Weight (Heavy, Light, Medium), by Model (B2B, B2C, C2C), by End User (E-Commerce, BFSI, and More), by Mode of Transport (Road, Air, Others), and by Geography (Asia-Pacific, Europe, Middle East & Africa, North America, South America). Market Forecasts are Provided in Terms of Value (USD).
| Domestic |
| International |
| Heavy Weight Shipments |
| Light Weight Shipments |
| Medium Weight Shipments |
| Business-to-Business (B2B) |
| Business-to-Consumer (B2C) |
| Consumer-to-Consumer (C2C) |
| E-Commerce |
| Financial Services (BFSI) |
| Healthcare |
| Manufacturing |
| Primary Industry |
| Wholesale and Retail Trade (Offline) |
| Others |
| Road |
| Air |
| Others |
| Asia-Pacific | Australia |
| China | |
| India | |
| Indonesia | |
| Japan | |
| Malaysia | |
| Philippines | |
| Thailand | |
| Vietnam | |
| Rest of Asia-Pacific | |
| Europe | France |
| Germany | |
| Italy | |
| Netherlands | |
| Spain | |
| United Kingdom | |
| Nordics | |
| Central and Eastern Europe (CEE) | |
| Rest of Europe | |
| Middle East and Africa | Qatar |
| Saudi Arabia | |
| United Arab Emirates | |
| Egypt | |
| Nigeria | |
| South Africa | |
| Rest of Middle East and Africa | |
| North America | Canada |
| Mexico | |
| United States | |
| Rest of North America | |
| South America | Argentina |
| Brazil | |
| Chile | |
| Rest of South America |
| Destination | Domestic | |
| International | ||
| Shipment Weight | Heavy Weight Shipments | |
| Light Weight Shipments | ||
| Medium Weight Shipments | ||
| Model | Business-to-Business (B2B) | |
| Business-to-Consumer (B2C) | ||
| Consumer-to-Consumer (C2C) | ||
| End User Industry | E-Commerce | |
| Financial Services (BFSI) | ||
| Healthcare | ||
| Manufacturing | ||
| Primary Industry | ||
| Wholesale and Retail Trade (Offline) | ||
| Others | ||
| Mode of Transport | Road | |
| Air | ||
| Others | ||
| Geography | Asia-Pacific | Australia |
| China | ||
| India | ||
| Indonesia | ||
| Japan | ||
| Malaysia | ||
| Philippines | ||
| Thailand | ||
| Vietnam | ||
| Rest of Asia-Pacific | ||
| Europe | France | |
| Germany | ||
| Italy | ||
| Netherlands | ||
| Spain | ||
| United Kingdom | ||
| Nordics | ||
| Central and Eastern Europe (CEE) | ||
| Rest of Europe | ||
| Middle East and Africa | Qatar | |
| Saudi Arabia | ||
| United Arab Emirates | ||
| Egypt | ||
| Nigeria | ||
| South Africa | ||
| Rest of Middle East and Africa | ||
| North America | Canada | |
| Mexico | ||
| United States | ||
| Rest of North America | ||
| South America | Argentina | |
| Brazil | ||
| Chile | ||
| Rest of South America | ||


Key Questions Answered in the Report
How large is the global express delivery market in 2026?
The express delivery market size is USD 272.17 billion in 2026 and is forecast to reach USD 361.26 billion by 2031.
What is the expected CAGR for global express delivery through 2031?
The market is projected to expand at a 5.83% CAGR between 2026 and 2031.
Which region is growing fastest in express parcel volumes?
Asia-Pacific leads growth with a 7.47% CAGR, buoyed by China’s massive e-commerce parcel output.
Which end-user vertical offers the highest growth runway?
Healthcare logistics is advancing at a 6.49% CAGR as biologics and cell-and-gene therapies demand temperature-controlled transport.
How are carriers addressing workforce shortages?
Operators are accelerating automation, expanding parcel locker networks, and piloting autonomous and crowdsourced delivery models.
What mode of transport is gaining share in premium services?
Air cargo is growing at a 6.82% CAGR as carriers add dedicated freighters for time-critical and cold-chain shipments.
Page last updated on:


