
Inductive Proximity Sensor Market Size and Share
Market Overview
| Study Period | 2020 - 2031 |
|---|---|
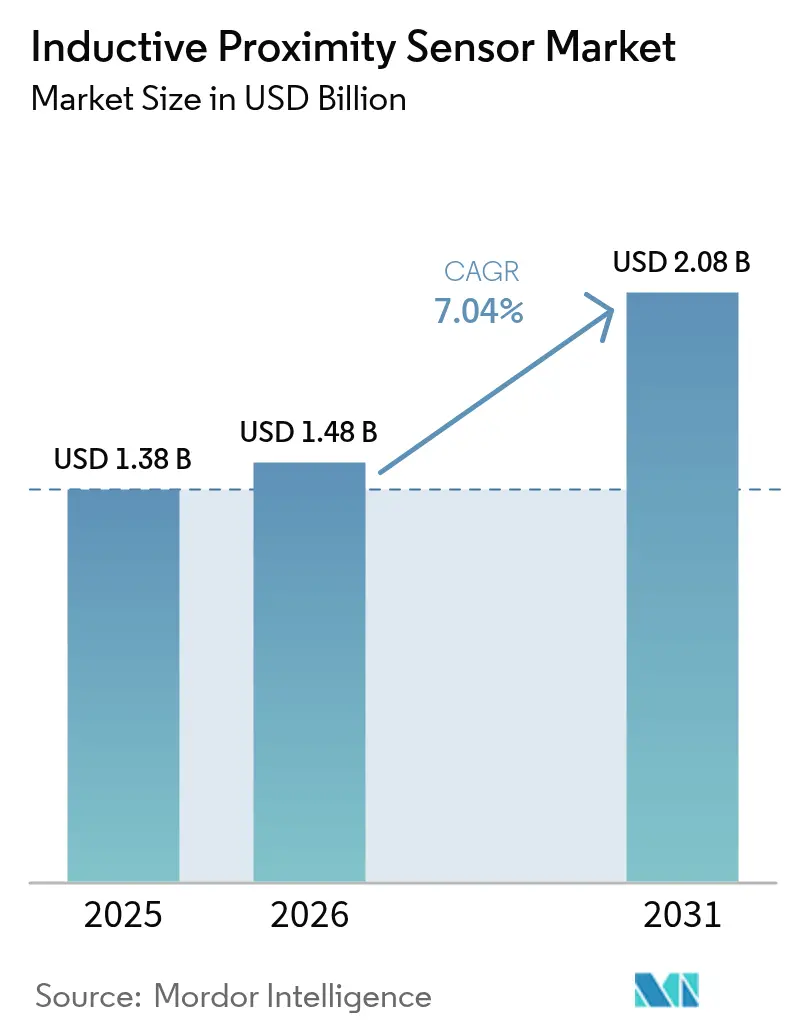
| Market Size (2026) | USD 1.48 Billion |
| Market Size (2031) | USD 2.08 Billion |
| Growth Rate (2026 - 2031) | 7.04 % |
| Fastest Growing Market | Middle East and Africa |
| Largest Market | Asia-Pacific |
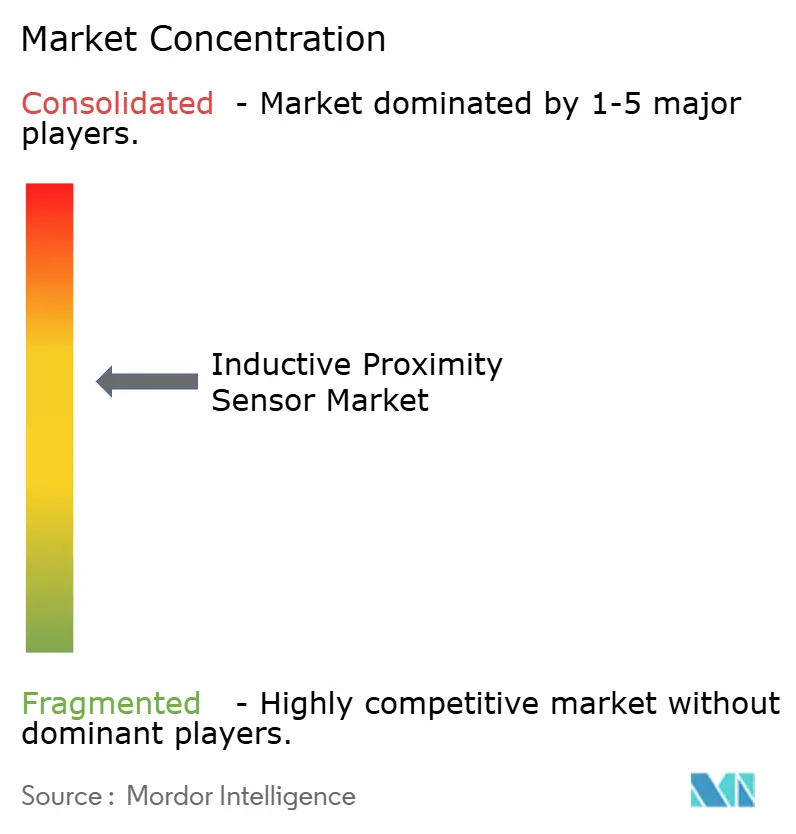
| Market Concentration | Medium |
Major Players *Disclaimer: Major Players sorted in no particular order Image © Mordor Intelligence. Reuse requires attribution under CC BY 4.0. | |
Inductive Proximity Sensor Market Analysis by Mordor Intelligence
The global inductive proximity sensors market size is expected to grow from USD 1.38 billion in 2025 to USD 1.48 billion in 2026 and is forecast to reach USD 2.08 billion by 2031 at 7.04% CAGR over 2026-2031. Intensive investment in Industry 4.0 upgrades, the shift from mechanical to contact-less detection, and the need for rugged components that keep working amid dust, oil, vibration, and temperature swings are the core drivers. OEM platform strategies now favor sensors with embedded IO-Link or comparable digital protocols to feed big-data analytics engines that minimize downtime. At the same time, supply-chain realignment in Asia-Pacific is reshaping the vendor landscape as regional players gain scale and push down average selling prices without compromising reliability. Finally, the transition to electric mobility, renewable power generation, and compact collaborative robots is widening the application base and anchoring long-term demand for high-performance inductive detection technology.
Key Report Takeaways
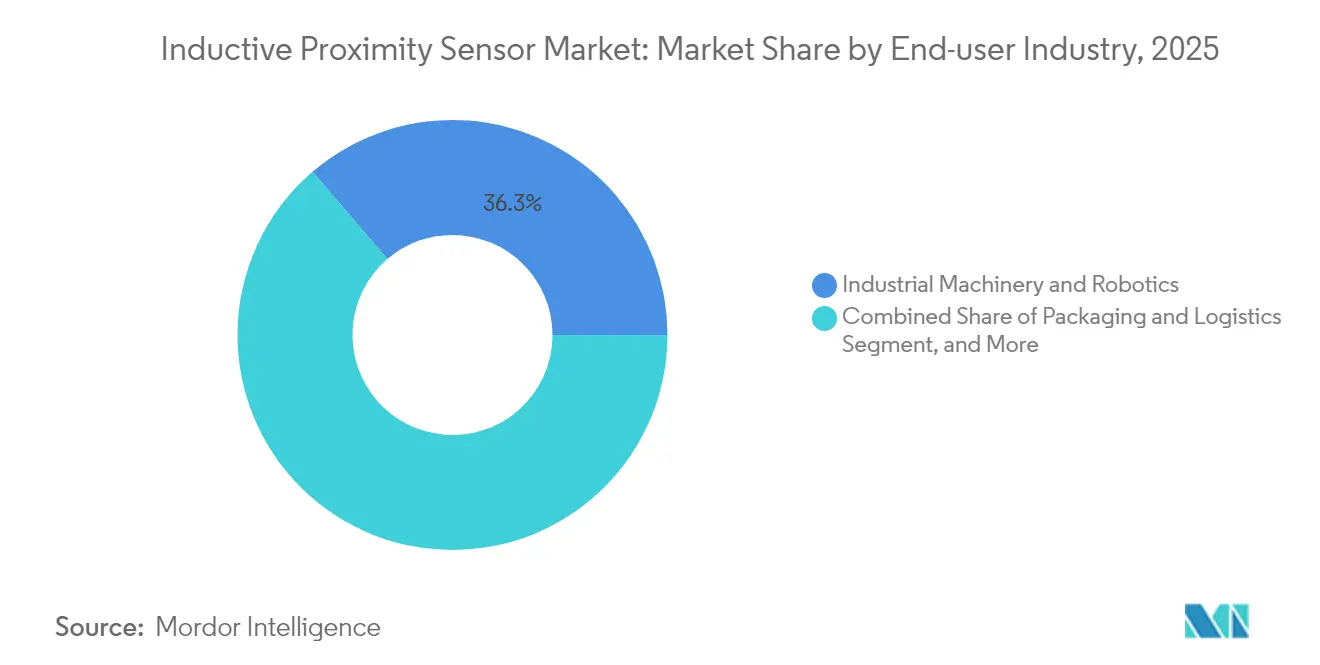
- By end-user industry, Industrial Machinery and Robotics led with 36.29% of the inductive proximity sensors market share in 2025; Energy and Utilities is advancing at a 7.21% CAGR through 2031.
- By sensing range, medium-range devices captured 45.27% of the inductive proximity sensors market size in 2025 and are projected to expand at an 8.54% CAGR to 2031.
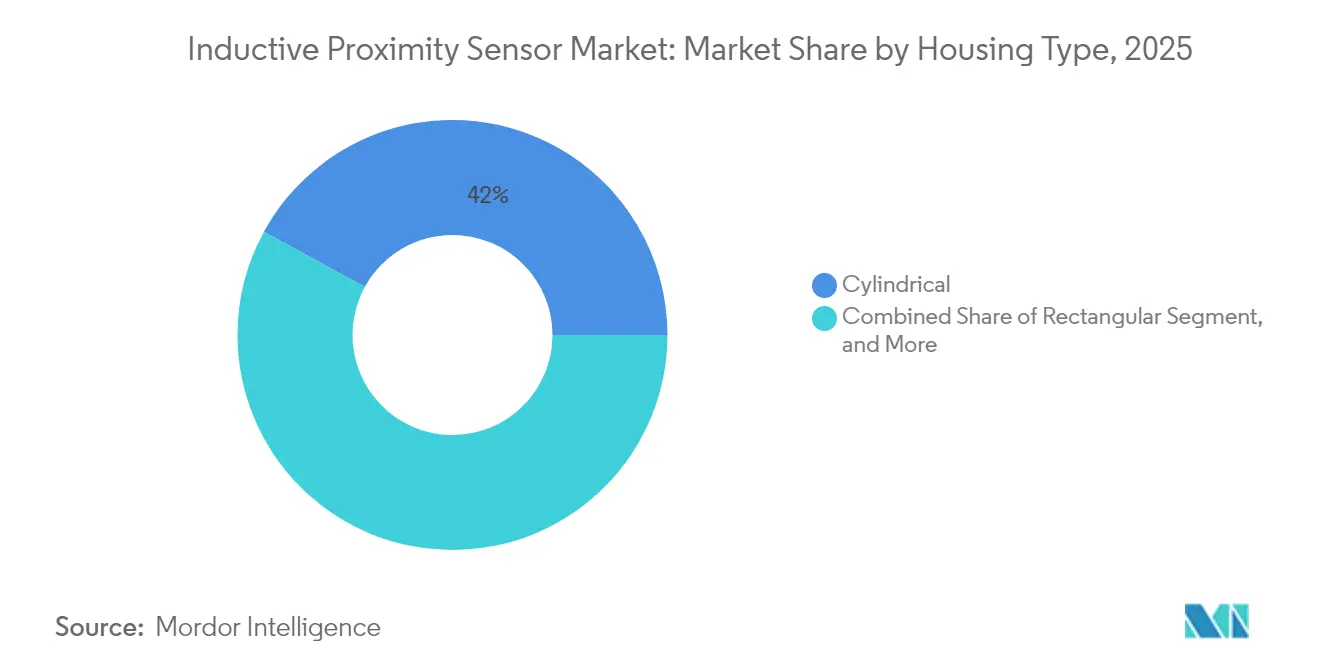
- By housing type, cylindrical designs accounted for 42.02% revenue in 2025, while rectangular formats are set to grow fastest at a 7.74% CAGR during 2026-2031.
- By installation type, flush / shielded units commanded a 56.18% share of the inductive proximity sensors market size in 2025 and will lead growth at an 8.62% CAGR through 2031.
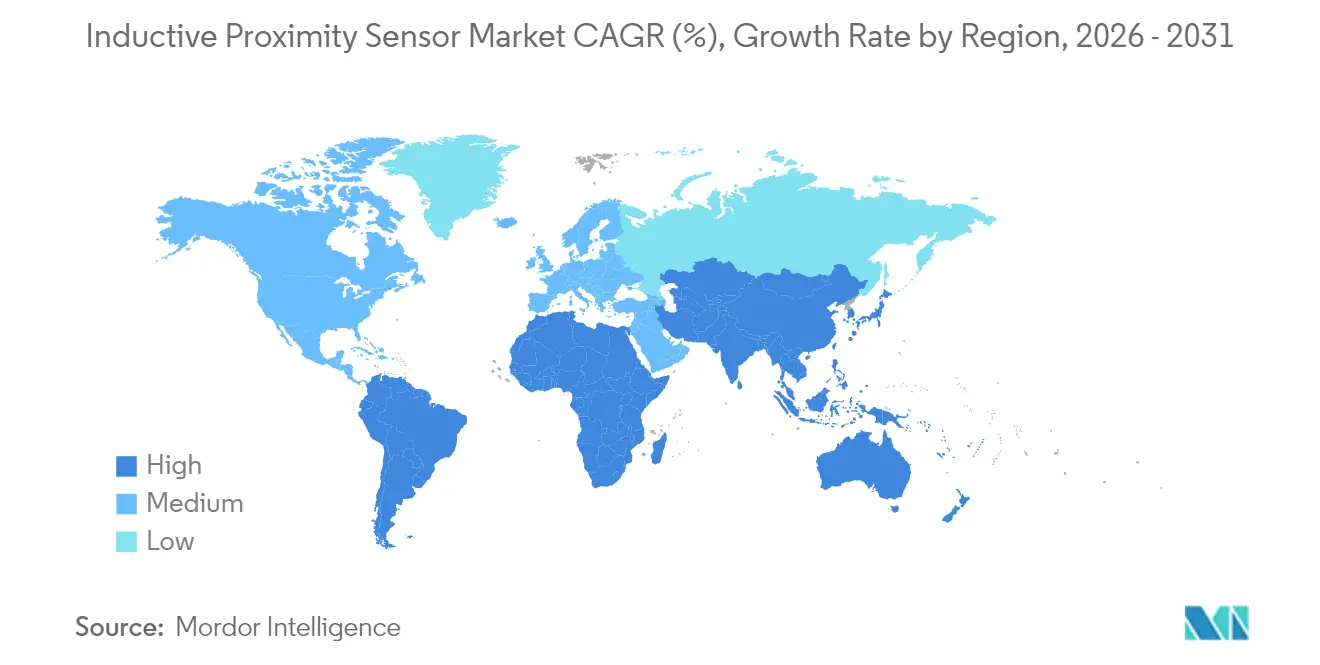
- Asia-Pacific held 38.37% regional share in 2025; the Middle East and Africa segment is poised for the highest 7.96% CAGR to 2031.
Note: Market size and forecast figures in this report are generated using Mordor Intelligence’s proprietary estimation framework, updated with the latest available data and insights as of 2026.
Global Inductive Proximity Sensor Market Trends and Insights
Drivers Impact Analysis*
| Driver | (~) % Impact on CAGR Forecast | Geographic Relevance | Impact Timeline |
|---|---|---|---|
| Accelerating Industry 4.0-led factory automation adoption | +1.8% | Global with Asia-Pacific leadership | Medium term (2-4 years) |
| Rising automotive production integrating inductive sensors | +1.2% | Asia-Pacific core, spill-over to NA and EU | Short term (≤ 2 years) |
| Growing demand for contact-less position sensing in harsh environments | +0.9% | Global, heavy industries | Long term (≥ 4 years) |
| Miniaturized ASIC designs enabling integration into cobots | +0.7% | NA and EU, widening to Asia-Pacific | Medium term (2-4 years) |
| Adoption in smart agriculture machinery for precision depth sensing | +0.5% | NA and EU farm belts | Long term (≥ 4 years) |
| OEM preference for IO-Link-enabled sensors for predictive maintenance | +0.6% | Global, led by German standards | Medium term (2-4 years) |
| Source: Mordor Intelligence | |||
Accelerating Industry 4.0-Led Factory Automation Adoption
Fully digital production lines now deploy hundreds of inductive sensors per cell for part presence, tool position, and conveyor speed monitoring, supplying time-stamped data that manufacturing execution systems convert into actionable insights for schedule optimization and scrap reduction. Siemens reported 30% productivity gains in 2024 after scaling such architectures across its flagship electronics assembly plants. The ability to withstand lubricants, coolants, and stray electromagnetic fields while delivering sub-millimeter precision keeps inductive detection at the heart of the smart-factory toolkit. Demand spikes most sharply in Asia-Pacific, where government incentives accelerate technology refresh cycles across automotive, consumer electronics, and general machinery facilities.
Rising Automotive Production Integrating Inductive Sensors
The record EV build-out in 2024 pushed leading producers to adopt thousands of inductive sensors per body-in-white or battery module line, replacing mechanical limit switches that suffered early wear. Tesla’s Gigafactory lines, for example, rely on more than 2,000 units per line to verify battery alignment, module seating, and robotic welding torch position with zero contact-related downtime. [1]Tesla Inc., “Gigafactory Production Line Automation Systems,” tesla.com The automotive case underscores how high-throughput, continuous-operation plants value maintenance-free designs that survive elevated heat near curing ovens and the magnetic fields surrounding high-current battery subsystems.
Growing Demand for Contact-Less Position Sensing in Harsh Environments
Steel mills, cement kilns, and oil refineries expose control components to abrasive dust, corrosive chemicals, and extreme temperatures. In these settings, optical or mechanical devices fail rapidly, whereas inductive proximity sensors continue switching for billions of cycles without drift. Heavy-duty equipment manufacturers report double-digit replacement of older sensing technologies with inductive nodes to meet stricter uptime guarantees demanded under service-level contracts. Emerging markets in the Middle East adopt similar philosophies within large-scale desalination and petrochemical complexes, locking in future revenue for rugged sensor variants.
Miniaturized ASIC Designs Enabling Integration into Cobots
Cobots must remain lightweight, space-efficient, and intrinsically safe, creating intense pressure to shrink every embedded component. ABB introduced 8 mm-diameter inductive devices that integrate on-chip signal processing and temperature compensation, providing positional feedback without external amplifiers. [2]ABB Ltd., “Collaborative Robotics Integration Solutions,” abb.com The smaller footprint allows builders to recess sensors inside joints or grippers, reducing snag risk and preserving robot reach. ASIC-level integration also cuts power draw, critical for battery-driven autonomous mobile robots roaming factories and warehouses.
Restraints Impact Analysis*
| Restraint | (~) % Impact on CAGR Forecast | Geographic Relevance | Impact Timeline |
|---|---|---|---|
| Limited sensing distance versus photoelectric alternatives | -0.8% | Global, long-range use cases | Long term (≥ 4 years) |
| Price pressures due to commoditization in Asian supply base | -0.6% | Asia-Pacific factory clusters | Short term (≤ 2 years) |
| Electromagnetic interference in high-frequency inverter environments | -0.4% | Global industrial sites | Medium term (2-4 years) |
| Supply-chain volatility for high-permeability ferrite cores | -0.3% | Global electronics hubs | Short term (≤ 2 years) |
| Source: Mordor Intelligence | |||
Limited Sensing Distance Versus Photoelectric Alternatives
Electromagnetic induction physics caps reliable ranges near 40 mm for mainstream SKUs, forcing designers of pallet shuttles, high-bay storage cranes, or outdoor conveyor lines to deploy photoelectric or ultrasonic sensors able to detect objects across meters. Banner Engineering notes that warehouse automation projects routinely bypass inductive solutions once travel distances exceed 100 mm, citing single-device simplicity and lower wiring complexity. Integrators sometimes compensate by clustering multiple inductive nodes, yet the tactic inflates I/O count and control cabinet footprints, limiting uptake in applications where long-reach visibility is paramount.
Electromagnetic Interference in High-Frequency Inverter Environments
Variable-speed drives and fast-switching power inverters emit broadband noise that couples into inductive sensor coils, causing missed or phantom triggers if shielding, grounding, and filtering are insufficient. IEEE field studies identify welding stations, high-power charging depots, and solar inverters operating above 20 kHz as hotspots where false activation rates rise sharply. [3]Institute of Electrical and Electronics Engineers, “Electromagnetic Interference in Industrial Environments,” ieee.org Although premium vendors offer frequency-hopping or multi-coil designs to mitigate interference, budget-conscious factories in developing regions often default to lower-cost, less-robust versions, resulting in unexpected maintenance calls and slower return on automation investments.
*Our forecasts treat driver/restraint impacts as directional, not additive. The impact forecasts reflect baseline growth, mix effects, and variable interactions.
Segment Analysis
By End-user Industry: Industrial Machinery Dominance Faces Energy-Sector Disruption
Industrial Machinery and Robotics held 36.29% of the inductive proximity sensors market share in 2025, reflecting how CNC lines, gantry loaders, and pick-and-place cells depend on contact-less position verification for around-the-clock output. The segment consumed the largest portion of the inductive proximity sensors market size in absolute revenue and remains a testing ground for miniaturization, multi-frequency immunity, and rapid refill logistics. Energy and Utilities is forecast to post a 7.21% CAGR to 2031, converting wind turbine yaw-control, solar tracker, and smart-grid switchgear projects into lucrative new revenue pools.
Automotive plants sustained sizeable sensor replenishment programs during 2024-2025 model-year changeovers, while food-grade stainless-steel units gained traction in beverage bottling lines that undergo aggressive wash-down cycles. Aerospace and Defense specified hermetically sealed, vibration-resistant variants for actuators and landing-gear modules. Packaging and Logistics integrators adopted sensors with reinforced M12 connectors and fault-diagnostics LEDs to speed maintenance on unstaffed night shifts.



By Sensing Range: Medium-Range Optimization Drives Market Leadership
Medium-range devices spanning 5-15 mm accounted for 45.27% of the inductive proximity sensors market size in 2025 and will expand fastest at an 8.54% CAGR, demonstrating the sweet spot between coil diameter, housing length, and target-material tolerance. Their universal compatibility lowers inventory overhead for OEMs standardizing across machine families while giving system designers freedom to allocate comfortable mounting tolerances.
Short-range SKUs below 5 mm enjoy steady pull from micro-electronics assembly, surgical-instrument production, and laboratory automation, where micrometer accuracy outranks standoff distance. Long-range units above 15 mm remain indispensable in steel mills and forging presses for hot-metal detection, where thermal expansion widens the necessary air gap. Vendors continue experimenting with hybrid resonant circuits and higher excitation currents to bridge the historic performance gap with optical sensors.
By Housing Type: Cylindrical Leadership Challenged by Rectangular Innovation
Cylindrical threaded models retained 42.02% revenue share in 2025 thanks to familiarity among installers, IP-rated sealing options, and effortless retrofit into existing brackets. Yet rectangular bodies top the growth leaderboard at 7.74% CAGR because laser-cut machine frames, cobot wrists, and carton erectors crave slimline packages that nestle flush with surfaces.
Ring-style sensors remain niche yet vital for slip-ring assemblies and spindle-speed feedback, whereas slot designs outperform on conveyor counting tasks by providing a through-beam profile immune to product color variations. Standards such as ISO 14119 indirectly boost rectangular adoption by encouraging integrated safeguarding that blends sensor and guard functions within tight enclosures.
By Installation Type: Flush / Shielded Dominance Reflects EMI Concerns
Flush / shielded construction captured 56.18% of the inductive proximity sensors market share in 2025, up from 54% in 2023, and is forecast to grow 8.62% annually to 2031 as engineers prioritize electromagnetic immunity and snag-free exteriors. Shield rings, ferrite backings, and brass sleeves concentrate the magnetic field for heightened accuracy without extending beyond mounting holes, a key advantage in robot collars or palletizer columns.
Non-flush versions maintain relevance in textile machinery and light-duty packaging lines where obstacle-free distance maximizes switch tolerance. However, widespread migration to variable-frequency motor drives tilts future demand decisively toward shielded architectures capable of deflecting conducted and radiated noise.
Geography Analysis
Asia-Pacific controlled 38.37% of 2025 revenue in the inductive proximity sensors market, powered by China’s USD 1.4 trillion “Made in China 2025” stimulus, Japan’s Society 5.0 focus on human-machine collaboration, and India’s Production-Linked Incentive bursts in electronics and EV production. Regional OEMs consume high-density IO-Link arrays to satisfy just-in-time logistics and automate quality gates under lean-manufacturing mandates.
North America and Europe present mature landscapes where Brownfield retrofits dominate; factories retrofit legacy PLC islands with sensor hubs to comply with ISO 13374 predictive-maintenance reporting and OSHA machine-safety updates. Automotive electrification revives fresh capital spending in motor-stator and battery-module lines that need hundreds of temperature-rated inductive nodes.
The Middle East and Africa segment will log the swiftest 7.96% CAGR to 2031, riding Saudi Arabia’s USD 500 billion Vision 2030 industrial blueprint and UAE smart-city rollouts that embed distributed sensor networks inside utilities, logistics, and construction sites. South America trails but secures pockets of growth from Brazil’s vehicle platform expansions and Chilean mining automation that favors robust, non-contact detection in abrasive pits.

Regulatory Landscape
Inductive proximity sensors sold into industrial automation commonly align to IEC 60947-5-2:2019, which specifies key requirements for proximity switches, including test, marking, and performance expectations that feed OEM qualification processes and third-party conformity assessment routes. In Europe, the IECEx system is also used for market access where hazardous-area use is relevant, while machine builders often reference functional-safety concepts (SIL/PL) when inductive sensing is used in safety-related architectures.
Regulatory focus is also widening from electrical safety to cybersecurity for connected sensing. The EU Cyber Resilience Act (Regulation (EU) 2024/2847) entered into force on 10 December 2024, establishing horizontal cybersecurity requirements for products with digital elements, which becomes relevant when inductive sensors incorporate IO-Link or other digital interfaces. On 20 January 2026, the European Commission proposed updates to the European Cybersecurity Certification Framework and ENISA tasks, and on 6 May 2026 EU negotiators reached a provisional agreement on the Digital Omnibus on AI to streamline overlap between the EU Machinery Regulation (EU) 2023/1230 and the EU AI Regulation (Regulation (EU) 2024/1689), affecting compliance planning for sensor-enabled machinery and connected automation stacks.
Value Chain Analysis
The value chain begins with raw materials and components, notably copper winding wire, ferrite cores, engineered plastics or stainless steel housings, connectors (for example, M8/M12), and integrated circuits for signal conditioning, increasingly delivered as application-specific ICs (ASICs) that support compact form factors and embedded diagnostics. Upstream electronics and magnetics sourcing can be a bottleneck, particularly for specialized ASIC front-ends, with some Chinese manufacturers relying on external suppliers in Europe or Taiwan for critical silicon and high-spec components.
Manufacturing and assembly are concentrated in established industrial clusters in Germany, Japan, and China, including the Yangtze River Delta and Pearl River Delta, enabling scale production of cylindrical and rectangular packages with standardized footprints. Midstream activities include calibration, environmental testing, and certification-aligned validation, while downstream channels typically route through automation distributors, regional stocking partners, and system integrators that bundle sensors into PLC and IO architectures for industrial machinery, robotics, packaging lines, and energy assets. Within this chain, IO-Link ecosystem compatibility and firmware or parameter support sit alongside traditional quality metrics (IP rating, temperature range, EMI immunity) as differentiators for global vendors such as Pepperl+Fuchs, SICK, Balluff, Omron, Keyence, and Turck, as well as for price-competitive Asian suppliers such as Autonics and China-based manufacturers.
Competitive Landscape
The inductive proximity sensors market features moderate fragmentation, with European specialists such as Pepperl+Fuchs, SICK, and Balluff vying against broad-portfolio giants Rockwell Automation, Omron, and Siemens for global contracts. Asian contenders Autonics, Keyence, and Delta Electronics intensify pricing pressure by scaling localized coil-winding and over-mold lines, trimming landed costs for regional integrators.
Technical differentiation pivots on ASIC consolidation, embedded IO-Link diagnostics, and advanced shielding geometries. Pepperl+Fuchs alone filed 23 relevant patents in 2024, addressing frequency-agile drive compensation and adaptive temperature-tracking calibration. Meanwhile, Rockwell’s Connected Components Workbench demonstrated 25% maintenance-cost cuts in pilot plants after linking sensor-health metadata to cloud dashboards.
End-users demand vendor stability, multi-year firmware support, and field-replaceable connector kits. Consequently, incumbents strengthen after-sales ecosystems via subscription-based analytics portals, while newcomers chase volume niches like budget sensor banks in solar farms or disposable units for bulk food conveyors. Strategic mergers, such as Rockwell’s 2025 harsh-environment sensor acquisition, reinforce vertical integration and broaden IP portfolios.
Inductive Proximity Sensor Industry Leaders
Pepperl+Fuchs SE
Rockwell Automation, Inc.
Panasonic Holdings Corporation (Panasonic Industry Co., Ltd.)
Eaton Corporation plc
SICK AG
- *Disclaimer: Major Players sorted in no particular order

Market Opportunities and Future Outlook
White-space is expanding around higher-value inductive sensing that combines rugged detection with digital connectivity and lifecycle diagnostics. OEM preference for IO-Link-enabled sensors creates opportunities for vendors that pair compact form factors with parameterization, device health data, and faster commissioning, particularly in brownfield retrofits where plants modernize legacy PLC islands rather than rebuild entire lines. At the same time, functional-safety use cases (SIL/PL-aligned architectures) widen demand for inductive sensing approaches that can be integrated into guarding, presses, and mobile automation cells, complementing conventional presence and position detection.
Capacity and footprint investments on the supply side also indicate where new sensor portfolios will be supported. In February 2026, Gefran announced a EUR 20 million investment to build a new 13,000 square meter production and technology hub in Provaglio d’Iseo, Italy, strengthening operational synergies in sensor manufacturing while maintaining emphasis on integrated production and engineering. On the demand side, growth in electrified mobility manufacturing, renewable power assets, and compact robotics expands the set of harsh-environment and space-constrained applications. Compliance shifts such as the EU Cyber Resilience Act (in force from 10 December 2024) further raise expectations for suppliers that embed digital interfaces and connectivity within proximity sensing devices used in connected automation.
Recent Industry Developments
- March 2026: Pepperl+Fuchs published guidance on inductive safety sensor applications aligned to SIL 2/PL d use cases across machine tools, presses, mobile cranes, and driverless transport systems. The disclosure reinforces the shift from basic switching toward safety-oriented architectures where inductive sensing is specified as part of validated safety functions.
- February 2026: Panasonic Industry highlighted industrial automation and IoT-oriented sensor solutions at Embedded World 2026 in Nuremberg (March 10-12, 2026). This visibility around connected sensing and integration workflows supports broader adoption of digitally enabled proximity sensing in embedded and factory automation designs.
- March 2025: Rockwell Automation issued an obsolescence notice for 871TM-DH 2-wire DC inductive proximity sensors, citing component availability and setting lifecycle transition actions for users. The end-of-life move pushes OEMs and end users toward redesigns or alternate qualified parts, influencing replacement demand and distributor inventory strategies.


Research Methodology Framework and Report Scope
Market Definition and Coverage
For this study, the market covers revenue generated from inductive proximity sensors used for non-contact detection of metallic objects in industrial and adjacent automation uses, counted at the point of sale from the sensor supplier into OEM and aftermarket channels across all regions.
Scope exclusions: We exclude non-inductive sensing technologies, and we also exclude broader automation hardware where the inductive sensor is only one bundled sub-component.
Segmentation Overview
- By End-user Industry
- Automotive and Transportation
- Food and Beverage Processing
- Aerospace and Defense
- Industrial Machinery and Robotics
- Packaging and Logistics
- Energy and Utilities
- Other End-user Industry
- By Sensing Range
- Short-range (≤5 mm)
- Medium-range (5–15 mm)
- Long-range (>15 mm)
- By Housing Type
- Cylindrical
- Rectangular
- Ring-style
- Slot-style
- Other Housing Type
- By Installation Type
- Flush / Shielded
- Non-flush / Unshielded
- By Geography
- North America
- United States
- Canada
- Mexico
- Europe
- Germany
- United Kingdom
- France
- Russia
- Rest of Europe
- Asia-Pacific
- China
- Japan
- India
- South Korea
- Australia
- Rest of Asia-Pacific
- Middle East and Africa
- Middle East
- Saudi Arabia
- United Arab Emirates
- Rest of Middle East
- Africa
- South Africa
- Egypt
- Rest of Africa
- Middle East
- South America
- Brazil
- Argentina
- Rest of South America
- North America
Data Sources, Market Sizing, and Validation
Desk Research
Desk research was used to set the structure of the model and to anchor a few hard-to-change reference points, before interviews were used to calibrate the softer variables. We relied on public sources such as US Census trade statistics, UN Comtrade, Eurostat, and national statistics offices to understand electronics and sensor trade flows alongside industrial production direction.
To keep the end-market demand logic grounded, we also reviewed sources such as the International Federation of Robotics (robot installations), ISO and IEC standard documentation relevant to industrial sensing, and peer-reviewed engineering journals that discuss inductive sensing design and practical performance limits. On top of this, we screened company filings, investor presentations, association websites, and reputable press coverage, and we also used paid subscriptions for company financials and intelligence plus patent databases to track product launches and technology claims over time. These examples are not exhaustive, and many other public and paid sources were also referred to for data collection, validation, and clarification.
Primary Interviews and Surveys
Primary work was carried out through expert interviews and structured surveys with sensor manufacturers, automation distributors, machine builders, and buyers from industrial and discrete manufacturing settings. Since this is a global market, we spread outreach across major manufacturing hubs so adoption assumptions, pricing direction, and channel mix could be cross-checked by region, and then used to fill gaps left by desk inputs.
Distribution of primary research fieldwork respondents
| Company type | Respondent position | Region |
|---|---|---|
| Top tier: 36% | CXOs: 13% | APAC: 49% |
| Mid tier: 50% | Functional/Unit leaders: 35% | EMEA: 33% |
| Smaller Players: 14% | Managers: 52% | Americas: 18% |
Market-Sizing & Forecasting
Sizing started with a top-down build where industrial production and automation investment signals were translated into an addressable demand pool for inductive sensing, and then filtered by application suitability and replacement cycles. The totals were then corroborated using selective bottom-up approximations, such as rolling up a sample of supplier revenues by region, plus channel checks on typical average selling prices multiplied by implied unit volumes, and then adjusted when the two views did not line up.
Key model inputs included factory automation spending direction, robot and automated cell deployments, machine-tool and discrete manufacturing output trends, sensor replacement rates in harsh-duty applications, and ASP progression by sensing range and housing format. Because pricing tends to move differently across standard cylindrical sensors versus more ruggedized designs, we treated ASP as a separate lever from unit growth, and it was sanity-checked with distributor feedback. Forecasting used scenario analysis supported by a simple multivariate regression, where the drivers were industrial output indicators, automation adoption signals, and the observed lag between capex cycles and sensor purchase patterns. Where bottom-up revenue coverage was incomplete, gaps were handled through region-level scaling factors that were validated in follow-up calls.
Data Validation & Update Cycle
Outputs were validated through a step-by-step triangulation process where model totals were checked against independent signals like trade direction, reported automation activity, and the implied sensor intensity per installed base. Outliers were flagged when growth rates, ASP moves, or regional splits broke expected patterns, and then the assumptions were revisited and, if needed, re-tested with an additional expert touchpoint.
Before sign-off, the work goes through multiple analyst reviews so definitions, currency treatment, and time-series continuity stay consistent, and the same logic is applied across regions. The report is refreshed annually, and interim updates are triggered when material events occur, such as large price moves in electronics supply chains or a sharp demand shift in a major manufacturing region. Right before delivery, a final analyst pass is done so the client receives the latest updated view.
Mordor Intelligence's Global Inductive Proximity Sensors Market Market Estimate Compared With Other Published Estimates
It is normal to see different market sizes published for inductive proximity sensors because the scope and the counting method are not always the same. Differences usually come from what is included as a sensor, which sales channels are counted, how pricing is averaged, and whether the time window is updated to reflect the latest industrial cycle.
A common gap driver in this market is that some estimates mix in adjacent proximity technologies or count integrated sensing blocks inside larger automation components, which lifts totals beyond stand-alone inductive sensor revenue. Another driver is ASP handling, where some studies assume flat pricing even though product mix can shift toward longer sensing range and harsher-duty housings, and currency conversion timing also changes the reported USD value. The spread in the table is mainly explained by stand-alone inductive sensor revenue being counted at supplier selling prices (and not as bundled automation value), a tighter scope choice applied by Mordor Intelligence.
Benchmark comparison
| Source | Market Size | Gaps in Research Methodology |
|---|---|---|
| Mordor Intelligence | USD 1.48 B (2026) | |
| Global Consultancy A | USD 1.29 B (2025) | Uses an earlier base year and a product-led view that can undercount late-cycle demand pickups, and it also applies a broader type mix that is not always aligned to stand-alone supplier revenue recognition. |
| Industry Publisher B | USD 1.48 B (2026) | Matches the headline year value but applies a more aggressive long-range growth case, with less visible checks on ASP progression by sensing range and housing type, which can widen the forward spread versus a demand-signal anchored build. |
Taken together, the comparison shows that year choice, scope boundaries around what is counted as an inductive sensor sale, and pricing treatment are the main reasons numbers move. By keeping inputs tied to observable automation activity and then stress-testing pricing and replacement assumptions with direct market feedback, we keep the estimate repeatable and easier to reconcile across regions and time.


Key Questions Answered in the Report
What is the global revenue for inductive proximity sensors in 2026?
The inductive proximity sensors market size stands at USD 1.48 billion in 2026.
Which application area is growing fastest through 2031?
Energy and Utilities shows the highest 7.21% CAGR as renewable energy assets integrate rugged sensors for position feedback.
Why do manufacturers prefer IO-Link versions?
IO-Link-enabled sensors allow continuous health diagnostics that cut maintenance costs by 25% in connected factories.
Which housing type is gaining momentum?
Rectangular models are expanding at a 7.74% CAGR because compact automation cells need slim, flush-mount packages.
How does sensing range influence adoption?
Medium-range (5-15 mm) units balance precision and mounting tolerance, accounting for 45.27% of 2025 revenue and leading future growth.
Which region will see the most rapid expansion by 2031?
The Middle East and Africa region is forecast to grow at a 7.96% CAGR due to large industrial diversification projects.
Page last updated on:





