
High Power Laser Systems Market Size and Share
Market Overview
| Study Period | 2020 - 2031 |
|---|---|
| Market Size (2026) | USD 12.56 Billion |
| Market Size (2031) | USD 16.46 Billion |
| Growth Rate (2026 - 2031) | 5.55 % |
| Fastest Growing Market | Middle East and Africa |
| Largest Market | Asia Pacific |
| Market Concentration | Medium |
Major Players *Disclaimer: Major Players sorted in no particular order Image © Mordor Intelligence. Reuse requires attribution under CC BY 4.0. | |
High Power Laser Systems Market Analysis by Mordor Intelligence
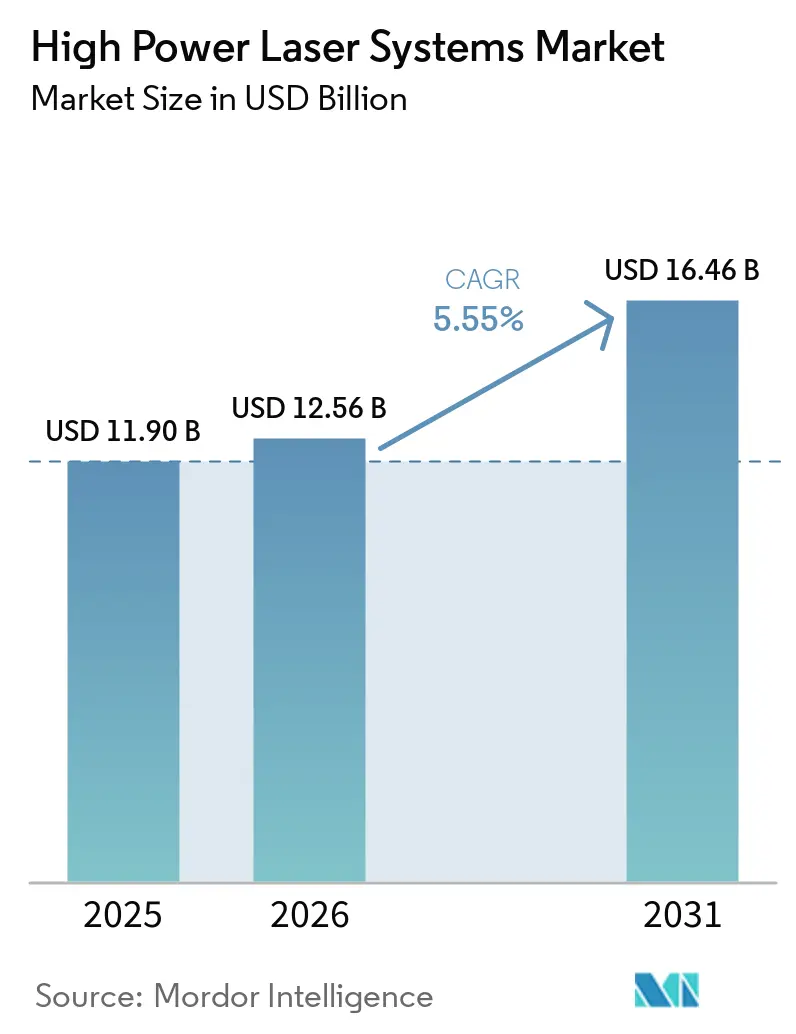
The high power laser systems market size is expected to grow from USD 11.9 billion in 2025 to USD 12.56 billion in 2026 and is forecast to reach USD 16.46 billion by 2031 at 5.55% CAGR over 2026-2031. Strong demand from electric-vehicle body-in-white lines, aerospace micro-welding, and defense high-energy laser (HEL) deployments underpins this expansion. Manufacturers favor fiber-based platforms that combine 50% wall-plug efficiency with sub-50 µm kerf precision, shifting capital toward high-power solutions that outpace conventional mechanical processing. Supply-chain reshoring initiatives funded by the CHIPS Act amplify domestic laser‐equipment investment, while EU incentives under the Net-Zero Industry Act accelerate adoption of laser cleaning to meet environmental targets. Defense modernization solidifies demand for systems above 100 kW as NATO allies formalize procurement of directed-energy platforms.
Key Report Takeaways
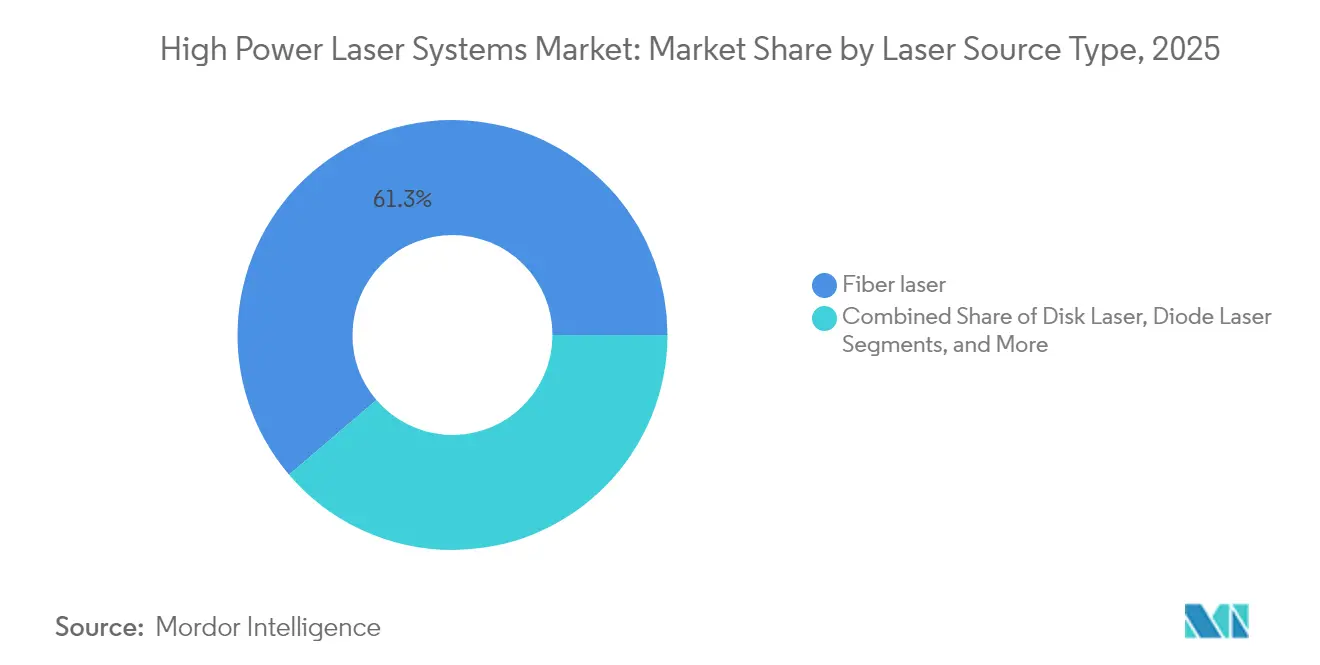
- By Laser Source Type, Fiber lasers accounted for 61.25% of the revenue in 2025, while ultrafast fiber lasers are projected to grow at a robust 6.95% CAGR through 2031.
- By Power Output, the 2–6 kW category dominated with 48.35% share in 2025, whereas output above 6 kW is expected to witness the fastest expansion at 7.12% CAGR by 2031.
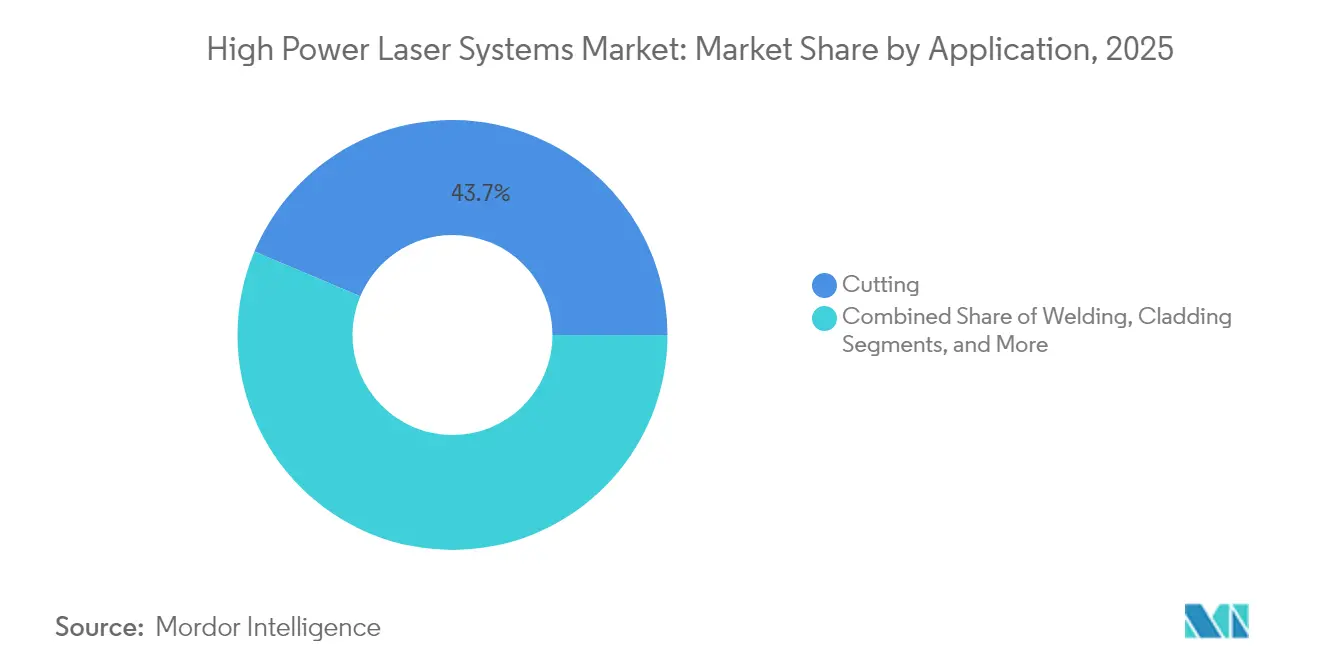
- By Application, cutting remained the top application with a 43.65% share in 2025, while cleaning and ablation are set to grow the fastest, registering an 8.31% CAGR through 2031.
- By End-Use Industry, Automotive captured the largest share at 29.45% in 2025, while aerospace and defense are anticipated to outpace others with an 8.05% CAGR growth by 2031.
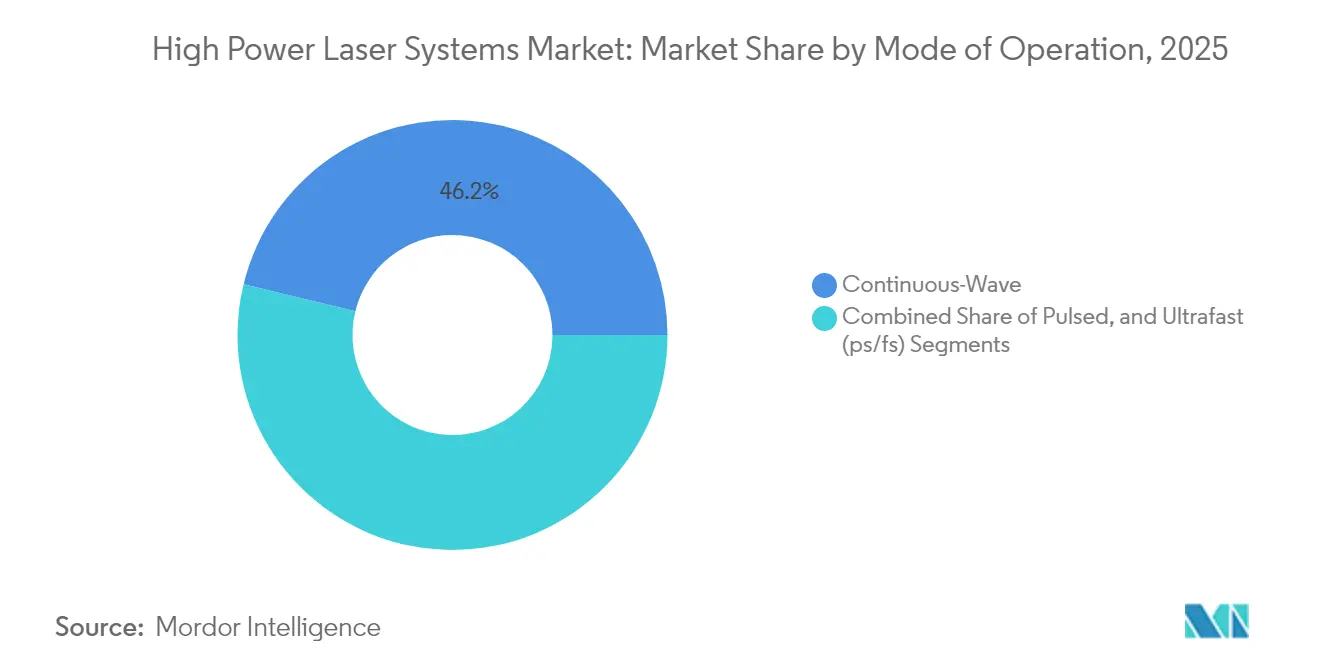
- By Mode of Operation, Continuous wave systems held 46.20% of the market in 2025, while ultrafast (fs/ps) lasers are forecast to expand rapidly at a 7.60% CAGR through 2031.
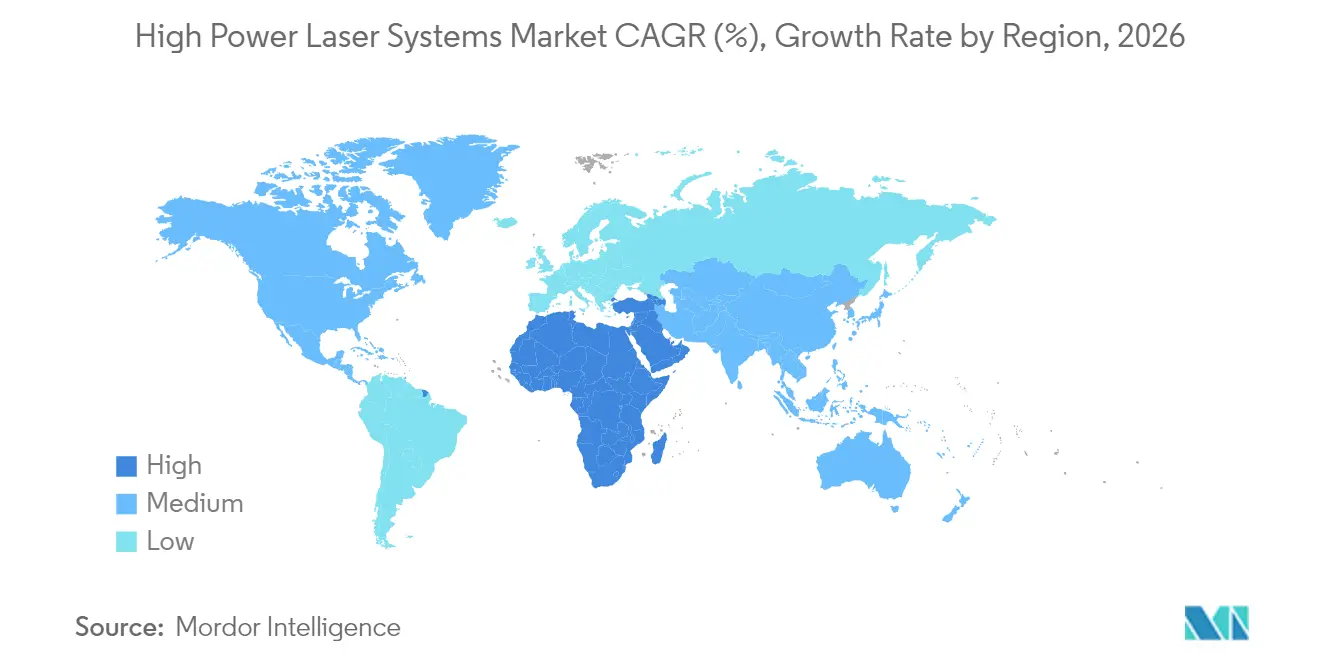
- By geography, Asia-Pacific held 38.60% revenue share in 2025; the Middle East and Africa are set to expand at 8.78% CAGR through 2031.
Note: Market size and forecast figures in this report are generated using Mordor Intelligence’s proprietary estimation framework, updated with the latest available data and insights as of 2026.
Market Trends and Insights
Drivers Impact Analysis of High Power Laser Systems Market*
| Driver | (~) % Impact on CAGR Forecast | Geographic Relevance | Impact Timeline |
|---|---|---|---|
| Shift-to-EV body-in-white ultra-high-power cutting lines | +1.20% | Global, with concentration in China, Germany, United States | Medium term (2-4 years) |
| Post-pandemic reshoring driving fiber-laser automation investments | +0.90% | North America & Europe, spill-over to Mexico | Short term (≤ 2 years) |
| Demand for sub-50 μm kerf aerospace micro-welding | +0.70% | North America, Europe, with emerging presence in APAC | Long term (≥ 4 years) |
| AI-enabled closed-loop beam tuning lowers scrap and energy costs | +0.80% | Global, early adoption in Germany, Japan, South Korea | Medium term (2-4 years) |
| Defense HEL upgrade programs (Greater than 100 kW) accelerate procurement | +0.60% | United States, with expansion to NATO allies | Long term (≥ 4 years) |
| EU "Net-Zero Industry Act" incentives for green laser processing | +0.40% | European Union, with influence on global standards | Medium term (2-4 years) |
| Source: Mordor Intelligence | |||
Shift-to-EV Body-in-White Ultra-High-Power Cutting Lines
Electric-vehicle platforms require aluminum space frames and mixed-material assemblies that demand laser accuracy of 0.1 mm while limiting thermal load near lithium-ion cells. Tesla’s Austin plant uses 6 kW+ fiber systems to weld battery enclosures at production speeds above 15 m/min.[1]Tesla, “Q4 2024 Shareholder Letter,” tesla.com Chinese makers BYD and CATL extend the trend, with BYD’s Blade Battery lines deploying 10 kW equipment for 3.2 mm steel housings. The resulting order flow locks in multi-year contracts for system integrators and diode suppliers.
Post-Pandemic Reshoring Driving Fiber-Laser Automation Investments
Global supply-chain shocks pushed semiconductor, aerospace, and medical manufacturers to reshore production. The CHIPS and Science Act directs USD 52 billion toward U.S. fab capacity, each facility integrating laser dicing, drilling, and welding cells.[2]U.S. Department of Commerce, “CHIPS and Science Act Implementation Update,” commerce.gov Coherent’s SmartSense+ platform delivers AI process monitoring that reduces operator intervention and supports consistent quality at higher throughput. Similar moves in Europe use laser automation to offset higher labor costs, sustaining equipment demand beyond initial plant buildouts.
Demand for sub-50 μm kerf aerospace micro-welding
Satellite builders and launch providers need kerf widths below 50 µm for antenna arrays and micro-via panels. SpaceX reports ±0.03 mm beam-positioning tolerance in Starlink antenna manufacturing, achievable only with ultrafast fiber sources tuned for cold ablation. ITER fusion components and NASA deep-space optics add long-cycle programs that keep laser suppliers engaged in high-value projects.[3]NASA, “James Webb Telescope Manufacturing Techniques,” nasa.gov
AI-enabled closed-loop beam tuning lowers scrap and energy costs
Machine-learning algorithms optimize power, speed, and focus in real time, cutting energy consumption 15-25% in production trials while improving edge quality consistency.[4]IEEE Photonics Society, “Machine Learning for Laser Processing,” photonicssociety.org FPGA controllers adjust parameters within microseconds, enabling high-mix lines to switch metals without lengthy setup. Reduced scrap and lower electricity bills improve ROI and widen adoption among small and medium enterprises despite high upfront costs.
Restraints Impact Analysis of High Power Laser Systems Market*
| Restraint | (~) % Impact on CAGR Forecast | Geographic Relevance | Impact Timeline |
|---|---|---|---|
| Cap-ex payback More than 4 yrs for SMEs in low-volume fabrication | -0.80% | Global, particularly affecting emerging markets | Short term (≤ 2 years) |
| High-power beam safety regulations tightening (IEC 60825-5) | -0.30% | Global, with stricter enforcement in EU and North America | Medium term (2-4 years) |
| Gallium-based diode supply volatility | -0.60% | Global, with acute impact on non-Chinese manufacturers | Short term (≤ 2 years) |
| Skilled laser-process engineering talent shortage | -0.50% | North America, Europe, with emerging challenges in APAC | Long term (≥ 4 years) |
| Source: Mordor Intelligence | |||
Cap-ex payback More than 4 yrs for SMEs in low-volume fabrication
Total turnkey costs for a 4 kW fiber cell approach USD 500,000, driving payback periods beyond 4 years when utilization falls below 60%. Financing programs from Bystronic and regional banks lower entry barriers by shifting payments to operating budgets, yet risk perceptions remain high in emerging markets where order visibility is limited.[5]BYD Company, “Blade Battery Manufacturing Note,” byd.com
Gallium-Based Diode Supply Volatility
China controls roughly 90% of gallium output and imposed export licensing in December 2024, slicing U.S. import volume by 40% and inflating diode prices. Strategic stockpiling and recycling offer interim relief, while research on gallium-free compounds and on-shore refining aims at long-term resilience for the high power laser systems market.
*Our forecasts treat driver/restraint impacts as directional, not additive. The impact forecasts reflect baseline growth, mix effects, and variable interactions.
High Power Laser Systems Market Segment Analysis
By Laser Source Type:
Fiber Dominance Drives InnovationFiber lasers captured 61.25% revenue in 2025 on the strength of 50% wall-plug efficiency and sealed-fiber reliability. Ultrafast fiber variants advance at a 6.95% CAGR, addressing semiconductor and medical components that require minimal heat-affected zones. CO₂ systems persist in thick non-metal and wood cutting, while disk lasers serve niche automotive welding, where top-hat beam profiles aid penetration. Diode direct-emission platforms grow in surface hardening lines, yet their 5 kW ceiling limits broader uptake. The high power laser systems market size for fiber platforms is expected to rise to USD 10.08 billion by 2031 as automation spreads beyond leading OEMs.
Competitive presses from Chinese vendors compress ASPs, but intellectual property in beam-combining, mode control, and real-time monitoring helps market leaders defend positions. Safety standards such as IEC 60825 favor fibers due to lower divergence, supporting factory-floor integration without large protective enclosures. Continuous R&D around kilowatt-class single-emitter diodes would unlock new source architectures, but commercialization is unlikely before 2027.



By Power Output:
Mid-Range Systems Balance Performance and CostSystems in the 2–6 kW window commanded 48.35% of the high power laser systems market share in 2025, fitting automotive steel gauges and delivering cut speeds above 15 m/min with stable edge quality. Above-6 kW units are projected to post a 7.12% CAGR to 2031 as shipbuilding, heavy equipment, and defense HEL programs require deeper penetration and thicker plate processing. Han’s Laser validated 150 kW multibeam products for ship subassembly panels, demonstrating the upper power limit in commercial deployment.
Thermal management remains a bottleneck beyond 10 kW, driving innovations in micro-channel coolers and phase-change materials that maintain beam quality. In contrast, 1–2 kW sources dominate electronics and medical tooling, where low heat input avoids component distortion. Technology roadmaps indicate continued power scaling paired with adaptive beam shaping that splits energy across multiple spots, enabling parallel processing and higher line takt times.
By Application:
Cutting Leads While Cleaning SurgesCutting retained 43.65% revenue in 2025 as it remains the baseline process across automotive, aerospace, and contract fabrication. Multiaxis robotic cells extend cutting to complex profiles that reduce part count and weight in vehicle structures. Cleaning and ablation, while starting from a smaller base, grow at 8.31% CAGR as laser removal replaces hazardous chemicals under tightening VOC rules in the European Union.
Welding benefits from EV battery pack assembly, where copper and aluminum joints require tight thermal control to avoid porosity. Cladding and hardening serve oil-and-gas refurbishment by applying wear-resistant overlays that extend tool life. Integration of AI vision systems quantifies cutting-edge roughness in real time, feeding closed-loop parameter optimization and pushing first-pass yield beyond 98%.
By End-User Industry:
Automotive Drives Volume, Aerospace Accelerates GrowthAutomotive lines accounted for 29.45% of 2025 demand, reflecting body-in-white economies of scale and standardized cycle times that justify multi-million-dollar investment. Volkswagen deployed identical 4 kW cells across three European plants, reducing engineering variance and spare-part inventory. Aerospace and defense, although smaller in absolute value, is forecast to expand at an 8.05% CAGR through 2031 as precision welding and HEL subsystems require custom high-power configurations.
Electronics segments call for sub-micron accuracy during wafer dicing and via drilling, relying on ultrafast pulses to avoid silicon heat damage. Medical device firms adopt laser welding for implantable components due to biocompatibility and limited contamination risk, aligning with expanding FDA guidance supporting the process. Energy sectors, including wind and hydrogen, create demand for thick-section cutting and corrosion-resistant cladding in turbine and pipeline fabrication.
By Mode of Operation:
Continuous-Wave Efficiency Versus Ultrafast PrecisionContinuous-wave (CW) operation held 46.20% revenue in 2025, delivering constant energy delivery that suits high-throughput steel cutting and welding lines. Fiber CW stability allows on-the-fly power modulation to accommodate thickness variation. Ultrafast modes, defined by pico- and femtosecond pulses, are projected to grow 7.60% CAGR through 2031 on the back of glass drilling for smartphone displays and precision polymer ablation in flexible electronics.
Pulsed nanosecond sources fill the middle ground for spot welding and thin-foil cutting, where heat input must be locally confined. Emerging burst-mode technologies stack femtosecond pulses within nanosecond envelopes, combining the throughput of CW with cold-processing fidelity, and are expected to challenge incumbent modes after 2026 in the high power laser systems industry.
Geography Analysis
APAC High Power Laser Systems Market
Asia-Pacific generated 38.60% of 2025 revenue, coupling China’s scale with Japan’s precision equipment capabilities. Beijing’s “Made in China 2025” agenda spurs adoption as domestic automakers electrify fleets, while Wuhan HG Laser and Raycus provide cost-effective platforms that shorten ROI for local fabricators. Japanese producers such as FANUC integrate advanced beam control that aligns with semiconductor lithography requirements, reinforcing regional leadership in ultrafast niches.
Europe High Power Laser Systems Market
Europe ranks second in value yet leads policy-driven segments. The Net-Zero Industry Act subsidizes laser cleaning and welding to reduce the environmental impact of chemicals, supporting uptake in Germany, France, and Italy. European defense agencies co-fund HEL demonstrators, creating spill-over to civilian manufacturing through shared supplier bases. Skilled-labor shortages remain a constraint, elevating interest in AI-assisted machines that reduce operator specialization.
MEA High Power Laser Systems Market
Middle East and Africa represent the fastest trajectory with a 8.78% CAGR to 2031. Saudi Arabia’s Vision 2030 pushes aviation, renewable energy, and local steel projects, each reliant on high-power laser systems market solutions for precision fabrication. The United Arab Emirates invests in maintenance-repair-overhaul hubs adopting laser cladding for turbine blade refurbishment. Limited domestic component supply urges partnerships with European and Asian integrators, shaping a hybrid ecosystem of imported machinery and localized service.

Regulatory Landscape
High power laser systems are governed primarily by laser product safety and workplace exposure rules that determine classification, labeling, interlocks, and protective-housing requirements for industrial cutting, welding, and cleaning equipment. A key anchor update is the publication of IEC 60825-1:2026 (7 May 2026), alongside IEC TS 60825-13:2026 (3 February 2026), which refresh hazard classification models and measurement guidance, prompting revalidation work for OEMs and integrators selling globally.
National frameworks commonly reference or accept IEC alignment. In the United States, FDA Laser Notice No. 56 enables conformance to IEC 60825-1 and IEC 60601-2-22 in lieu of portions of 21 CFR 1040.10/1040.11 for laser products, while OSHA maintains employer obligations for controlling laser hazards in workplaces. Canada administers requirements for laser products through the Radiation Emitting Devices Regulations (REDR), updated as of 9 October 2025. China implemented GB/T 7247.12-2026 effective 1 August 2026 for specified optical system security requirements, reinforcing the need for region-specific compliance documentation and labeling across shipments.
Value Chain Analysis
The value chain starts with upstream raw materials and photonic components, including gallium-dependent diode pump inputs, rare-earth dopants for active fibers, and high-purity fused silica and optical-coating materials for high-damage-threshold optics. Component specialization is concentrated, with a large share of epitaxial growth and chip packaging capacity located in Asia-Pacific, which raises lead-time and pricing sensitivity when export controls or material licensing disrupt flows, as reflected in the report context on gallium volatility.
Midstream players integrate pump diodes, fibers, beam delivery, cooling, power electronics, and controls into laser sources and complete systems (2D/3D cutters, welding cells, and cleaning platforms). They often pair these systems with AI monitoring and closed-loop beam tuning modules. Downstream, system integrators, robotics and automation partners, and end-user OEMs (automotive body-in-white, aerospace micro-welding, semiconductor and electronics, and defense HEL primes) drive application engineering, qualification, and service. Aftermarket service, spares, and process support are critical value pools because uptime and parameter libraries determine realized throughput, while workforce gaps in optical coatings and high-power optics constrain scale-up for custom high-energy configurations highlighted in directed-energy supply chain assessments.
Competitive Landscape
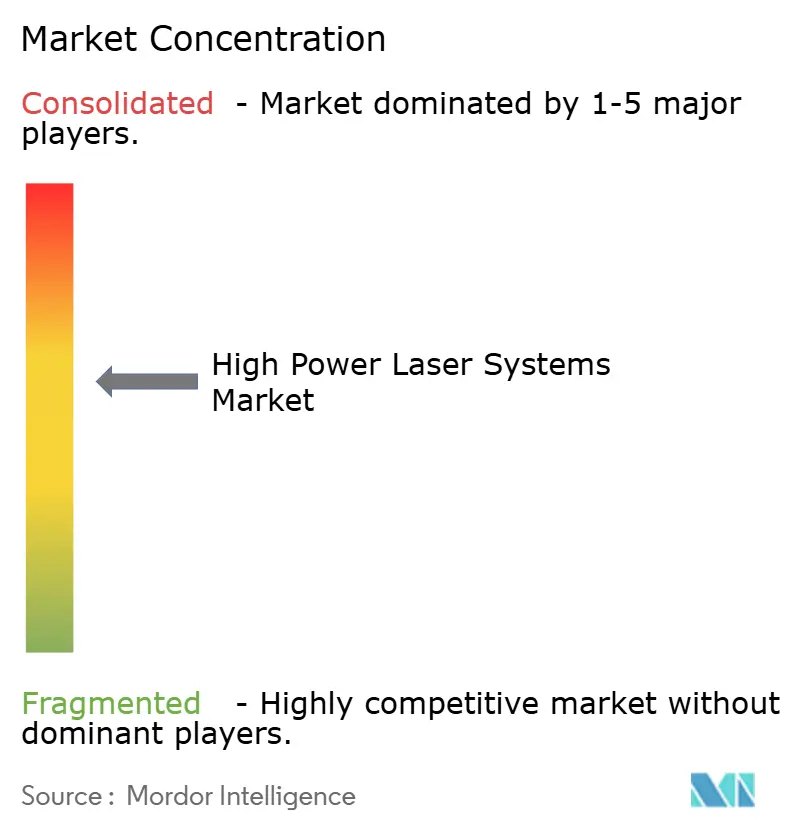
The high power laser systems market shows moderate fragmentation. German and U.S. incumbents TRUMPF, IPG Photonics, and Coherent control premium segments through end-to-end component integration, high R&D spend, and broad service footprints. Chinese firms Han’s Laser and HSG Laser undercut pricing, achieving rapid share gains in 2–6 kW cells for job shops and regional automotive tiers. Their domestic component ecosystems shorten lead times and facilitate aggressive upgrade cycles.
Strategic moves center on vertical alignment. IPG produces pump diodes and fiber delivery heads in-house, shielding margins from gallium volatility. TRUMPF’s TruDisk lasers integrate proprietary sensors that feed predictive-maintenance dashboards, reducing unplanned downtime. Coherent advances AI modules such as SmartSense+ that retrofit across legacy machines, extending life cycles and generating SaaS revenue.
Partnership patterns illustrate technology gaps. Lumentum collaborates with the U.K. Manufacturing Technology Centre on beam-combining optics for >50 kW sources, aiming at defense tenders. nLIGHT’s USD 171 million contract with the U.S. Army validates commercial high-power fiber arrays for field systems, bridging military and industrial roadmaps.
High Power Laser Systems Industry Leaders
Prima Industrie S.p.A.
IPG Photonics Corporation
Bystronic AG
Coherent Corp.
Preco Inc.
- *Disclaimer: Major Players sorted in no particular order
High Power Laser Systems Market Companies Covered in this Report
- TRUMPF SE + Co. KG
- IPG Photonics Corporation
- Coherent Corp.
- Han's Laser Technology Industry Group Co., Ltd.
- Bystronic AG
- Prima Industrie S.p.A.
- EL.EN. S.p.A.
- Preco Inc.
- HSG Laser
- Amada Co., Ltd.
- Mitsubishi Electric Corporation
- Wuhan HG Laser Engineering Co., Ltd.
- Raycus Fiber Laser Technologies Co., Ltd.
- nLIGHT, Inc.
- Lumentum Operations LLC
- Jenoptik AG
- Mazak Optonics Corp.
- FANUC Corporation
- Trotec Laser GmbH
- Universal Laser Systems, Inc.

Market Opportunities and Future Outlook
Defense-directed energy programs and industrial ultra-high-power scaling create whitespace for suppliers that can deliver ruggedized beam control, thermal management, and qualified optics at higher powers. In July 2026, the US Department of Defense awarded initial Joint Laser Weapon System (JLWS) contracts totaling USD 86 million to Lockheed Martin and nLIGHT Defense for containerized prototypes across ground and sea platforms. That award supports demand for scalable pump modules, beam combining, and high-reliability subsystems, which also spill into industrial platforms above 6 kW.
On the industrial side, power scaling and automation deepen adoption in shipbuilding, heavy equipment, and new-energy manufacturing, where thicker plate, higher duty cycles, and larger work envelopes are common. In April 2026, Wuhan Raycus announced mass production of a 220 kW continuous fiber laser, underscoring the commercialization push at very high power levels and expanding the addressable set of cutting and welding tasks that previously relied on multiple lower-power stations. A parallel opportunity sits in process-intelligence upgrades, where AI-enabled monitoring and closed-loop tuning (as referenced via platforms such as Coherent SmartSense+) supports retrofits and software-led service revenue for installed bases dealing with labor constraints and scrap reduction targets.
Recent Industry Developments in High Power Laser Systems Market
- July 2026: IPG Photonics announced a binding offer to acquire Lumibird Medical, extending its footprint in medical laser platforms. The announcement broadens exposure beyond industrial materials processing and supports shared component and manufacturing leverage across high-power and precision laser architectures.
- January 2026: Bystronic completed the acquisition of Coherent Corp.'s Tools for Materials Processing division and formed the Bystronic Rofin business unit. This consolidation expands Bystronic's technology stack and installed base in materials processing tools, strengthening its ability to bundle systems, software, and service.
- May 2024: IPG Photonics launched the LightWELD Cobot System, integrating a collaborative robot with a handheld laser welding platform. The product reduces automation barriers for smaller fabricators and supports faster adoption of standardized, turnkey laser welding cells in high-mix production.


High Power Laser Systems Market Report Scope and Research Methodology
Market Definition and Coverage
For this report, the market covers revenue generated from high power laser systems where the laser output is 1 kW or higher, sold for industrial and defense related uses across regions. The sizing follows system sales value in USD, counted at the point of sale to end users and integrators.
Scope exclusions: We exclude low power lasers below 1 kW, standalone laser components, and services such as maintenance-only contracts unless bundled with a system sale.
Segments Covered in This Report
- By Laser Source Type
- Fiber Laser
- Disk Laser
- Diode Laser
- CO₂ Laser
- Other Laser Source Types
- By Power Output
- 1 - 2 kW
- 2 - 6 kW
- Above 6 kW
- By Application
- Cutting
- Welding
- Cladding
- Hardening
- Cleaning and Ablation
- By End-user Industry
- Automotive
- Aerospace and Defense
- Electronics and Semiconductor
- Medical Devices
- Energy and Power
- Other End-user Industries
- By Mode of Operation
- Continuous-Wave
- Pulsed
- Ultrafast (ps/fs)
- By Geography
- North America
- United States
- Canada
- Mexico
- South America
- Brazil
- Argentina
- Colombia
- Rest of South America
- Europe
- United Kingdom
- Germany
- France
- Italy
- Spain
- Rest of Europe
- Asia-Pacific
- China
- Japan
- South Korea
- India
- Rest of Asia-Pacific
- Middle East and Africa
- Middle East
- Saudi Arabia
- United Arab Emirates
- Rest of Middle East
- Africa
- South Africa
- Egypt
- Rest of Africa
- Middle East
- North America
Data Sources, Market Sizing, and Validation
Desk Research
Desk work starts with building the addressable demand pool and the shipment context for where high power laser systems are actually used. We rely on public sources such as US Census Bureau manufacturing data, Eurostat industrial production series, World Bank and IMF macro indicators, and UN Comtrade trade statistics to gauge production intensity and cross-border equipment flows.
To translate those signals into laser system demand, we also review sources such as ISO and IEC standards references, patent databases for laser and beam delivery innovations, and defense procurement disclosures and budget documents where directed energy programs are referenced at a high level. Company filings, investor presentations, and credible industry press are used to cross-check capacity additions, pricing direction, and where new platforms are installed. In addition, we use paid subscriptions for company financials and intelligence, patent analytics, import-export shipment-level context, and defense related market information where it helps validate assumptions without overfitting the model. These desk sources are illustrative and not exhaustive, and many other references were used for data collection, validation, and clarification.
Primary Interviews and Surveys
Primary work is used to validate how high power laser systems are specified and purchased, and which applications account for the largest share of value in practice. We interview and survey OEM-side experts, system integrators, distributors, and end-user engineering and procurement teams across major regions, so gaps from desk findings can be closed and assumptions tested before finalizing the model.
Distribution of primary research fieldwork respondents
| Company type | Respondent position | Region |
|---|---|---|
| Top tier: 29% | CXOs: 15% | APAC: 49% |
| Mid tier: 53% | Functional/Unit leaders: 39% | EMEA: 30% |
| Smaller Players: 18% | Managers: 46% | Americas: 21% |
Market-Sizing & Forecasting
The market is sized using a combined approach, where the top-down view is built from manufacturing output and capex-linked demand signals to reconstruct likely system purchases in cutting, welding, and adjacent uses. That view is then corroborated through selective bottom-up checks, such as rolling up a sample of supplier revenues by region, validating channel mix with integrators, and stress-testing average selling price ranges against typical kW classes.
Inputs in the model include the mix shift across power bands (1-2 kW, 2-6 kW, and above 6 kW), adoption intensity in automotive body-in-white and general fabrication, defense directed-energy program timing, and the installed base replacement cycle for older systems. We also track utilization related cues, such as factory output swings, order backlogs discussed in filings, and major capacity expansions, because they influence near-term purchasing. Where bottom-up visibility is incomplete in smaller countries, we bridge gaps using import intensity, industrial output proxies, and expert-validated penetration rates rather than assuming uniform demand.
For forecasting, scenario analysis is used to translate the key drivers into a realistic range, and then a central case is chosen after primary feedback on pricing progression and capacity constraints. The final forecast is expressed in USD, with consistent currency timing and inflation handling so year-to-year comparisons remain readable.
Data Validation & Update Cycle
Validation is done in layers so unusual outputs are surfaced early. We compare the modeled totals against independent signals such as regional machine-tool spending direction, import patterns for laser-related industrial equipment, and the implied system volumes that the pricing bands would require.
When large variances show up, assumptions are revisited, and follow-up calls are triggered with the most relevant respondent type, for example integrators for application mix shifts or end users for replacement timing. Before sign-off, the dataset and calculations go through multi-step analyst reviews, followed by a final consistency check across regions and end-use logic. Reports are refreshed annually, and interim updates are made when material events occur, after which a fresh pre-delivery pass is completed so clients receive the latest view.
Mordor Intelligence's Global High Power Laser Systems Market Size Compared Against Other Published Estimates
Published market sizes for high power laser systems can look far apart even when the topic sounds similar, because the scope boundary and the unit of measurement are not handled the same way. Differences also come from how prices are trended, what year is treated as the current size, and whether the numbers are updated after meaningful shifts in industrial demand.
By tracking application-level demand cues and the power-band mix, Mordor Intelligence keeps the market total tied to 1 kW and above system sales, while some estimates expand the pool by blending in adjacent laser categories or counting component-only revenue as systems.
Benchmark comparison
| Source | Market Size | Gaps in Research Methodology |
|---|---|---|
| Mordor Intelligence | USD 12.56 B (2026) | |
| Trade Publisher A | USD 7.55 B (2025) | This estimate appears to use a narrower definition that can undercount full system value, and it may mix equipment with partial scope such as selected laser types or end uses, which reduces the comparable total. |
| Industry Report B | USD 3.89 B (2026) | The scope looks closer to a subset (for example, a specific laser type like CW fiber) rather than all high power laser systems, which makes the value materially smaller versus a full market view. |
The table indicates that the spread mainly comes from what is counted as a system and whether the scope covers the full high power laser system universe or a narrower slice by type or use case. Our approach stays traceable to clear power thresholds, application demand signals, and practical price bands, which makes the result easier to reproduce and explain.


Key Questions Answered in the Report
How large is the high power laser systems market in 2026?
It stands at USD 12.56 billion and is on track to reach USD 16.46 billion by 2031 at a 5.55% CAGR.
Which region contributes the most revenue?
Asia-Pacific holds 38.60% of 2025 turnover due to China;s manufacturing volume and Japan's precision applications.
What power range leads adoption in automotive production?
The 2-6 kW bracket secures 48.35% share as it balances throughput with cost for body-in-white steel and aluminum parts.
Why are laser cleaning systems gaining traction?
Environmental rules under the EU Industrial Emissions Directive favor chemical-free surface preparation, driving an 8.31% CAGR in cleaning and ablation units.
How is supply-chain risk affecting diode production?
Chinese control of 90% gallium supply and recent export licenses inflated diode prices and spurred research into alternative materials.
Which companies dominate the premium segment?
TRUMPF, IPG Photonics, and Coherent lead through integrated component production, advanced beam control, and global service networks.
Page last updated on:


 Your data is secure and never sold or shared.


