Market Overview
| Study Period | 2020 - 2031 |
|---|---|
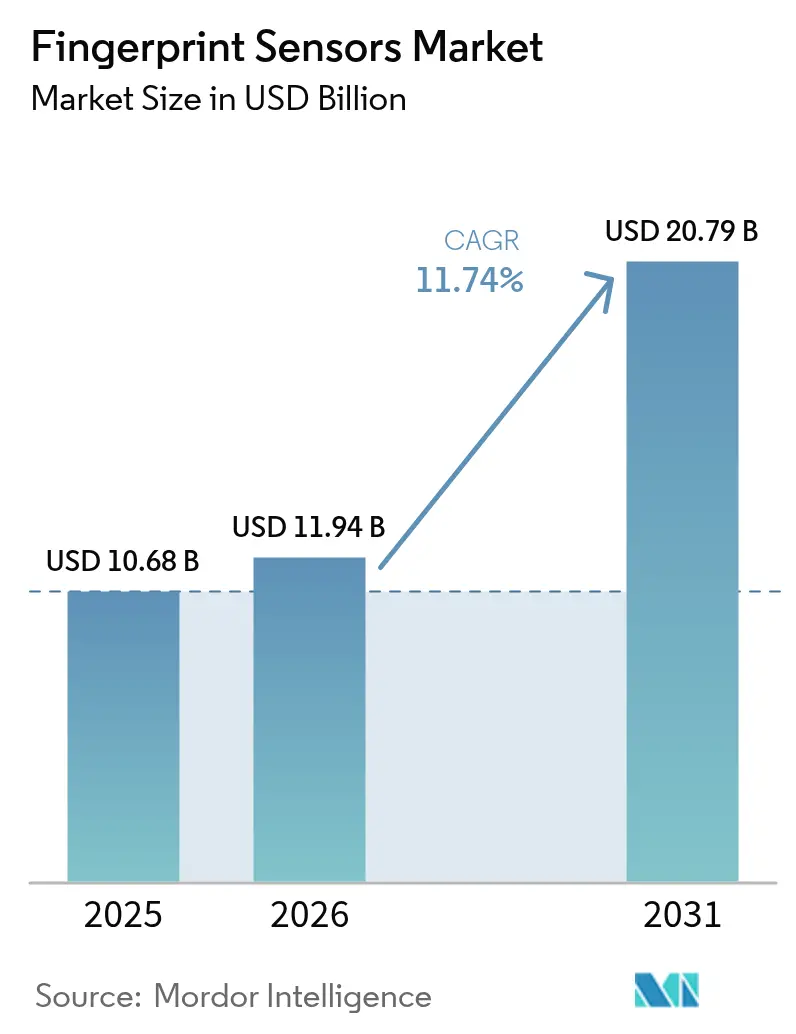
| Market Size (2026) | USD 11.94 Billion |
| Market Size (2031) | USD 20.79 Billion |
| Growth Rate (2026 - 2031) | 11.74% CAGR |
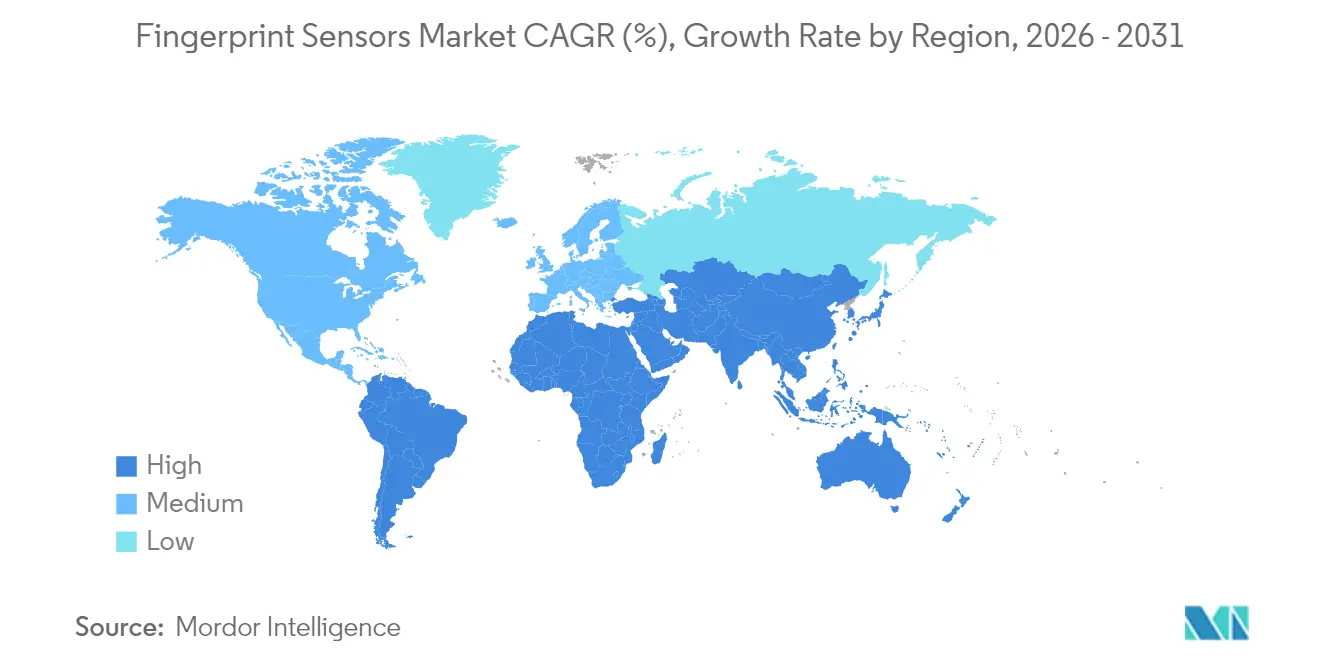
| Fastest Growing Market | Middle East and Africa |
| Largest Market | Asia-Pacific |
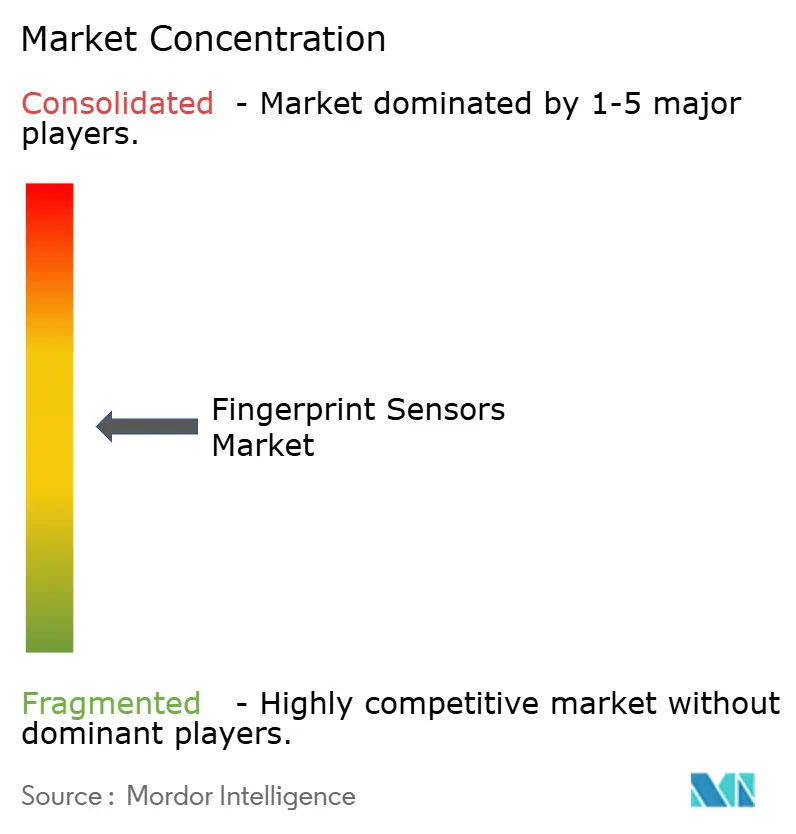
| Market Concentration | Medium |
Major Players *Disclaimer: Major Players sorted in no particular order Image © Mordor Intelligence. Reuse requires attribution under CC BY 4.0. | |
Fingerprint Sensors Market Analysis by Mordor Intelligence
The fingerprint sensors market size was valued at USD 10.68 billion in 2025 and estimated to grow from USD 11.94 billion in 2026 to reach USD 20.79 billion by 2031, at a CAGR of 11.74% during the forecast period (2026-2031). Expanding biometric mandates in consumer electronics, mobility, payments and government identity programs continue to widen the addressable base. Smartphone brands have turned to ultrasonic under-display solutions to deliver bezel-free designs without compromising spoof resistance, while payment-grade biometric cards enable card-present transactions that meet PSD3 and EMV requirements. Automotive suppliers are qualifying AEC-Q100 fingerprint ICs for keyless entry and in-cabin personalization and falling PMUT production costs are easing bill-of-materials pressures. Parallel improvements in AI-based liveness detection and edge processing further lift the reliability of fingerprint authentication, reinforcing its position in the wider multimodal security stack. [1]Nature Publishing Group, “High-SPL KNN PMUTs for Ultrasonic Imaging,” nature.com
Key Report Takeaways
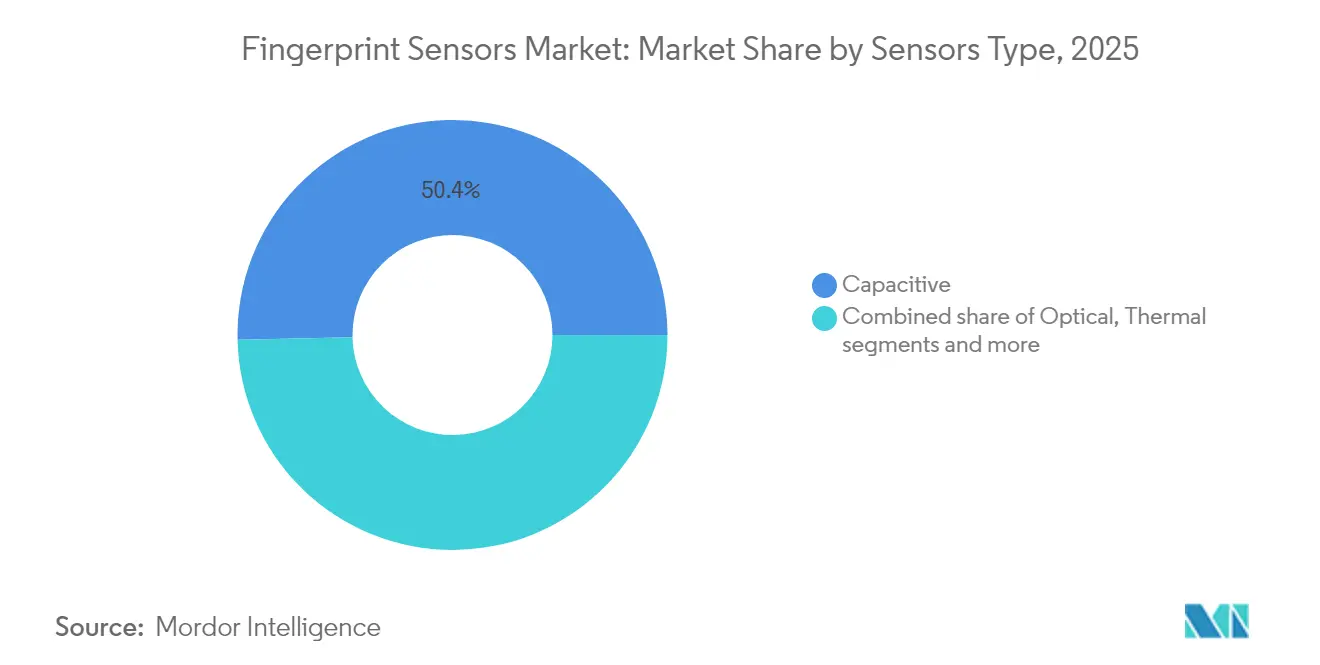
- By sensor type, capacitive sensors led with 50.35% revenue share in 2025, whereas ultrasonic sensors are forecast to expand at a 15.02% CAGR to 2031.
- By form factor, rear/front mount configurations captured 41.55% of revenue in 2025, while under-display ultrasonic units are projected to grow at 15.85% CAGR through 2031.
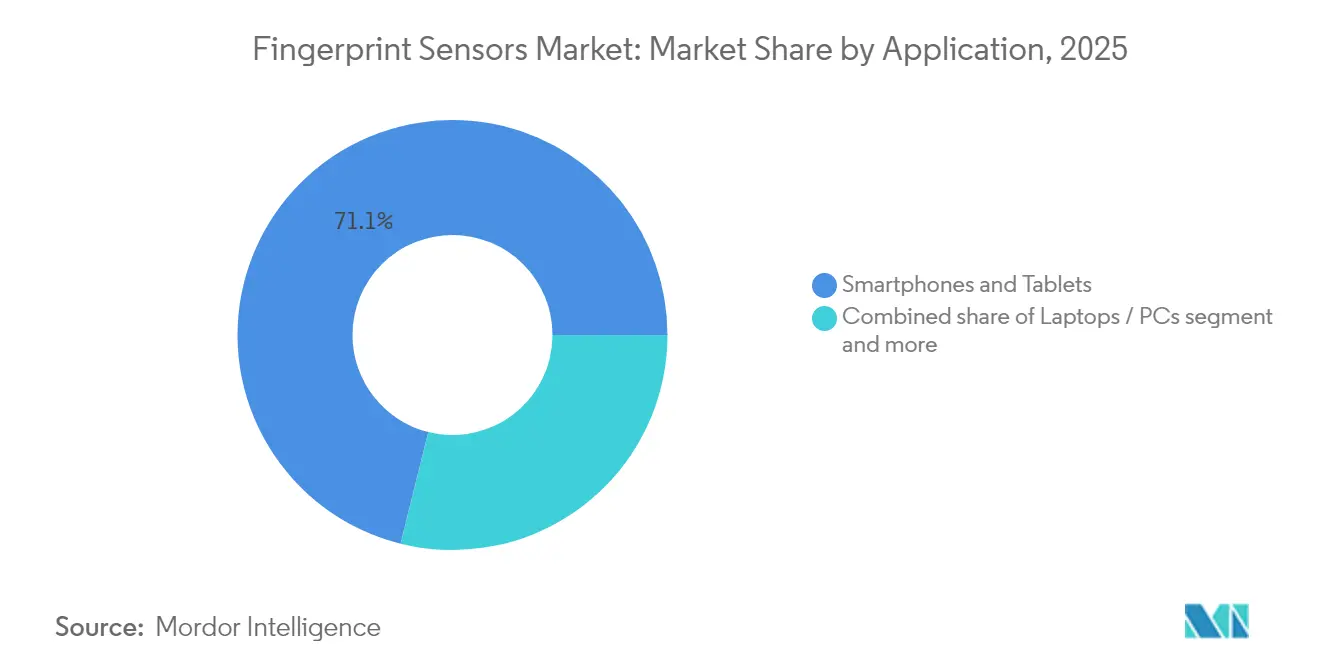
- By application, smartphones & tablets accounted for 71.12% share in 2025; smart cards & payment tokens are expected to post a 15.9% CAGR to 2031.
- By end-user industry, consumer electronics OEMs held 61.45% share in 2025, but automotive & mobility is anticipated to register an 17.95% CAGR to 2031.
- By geography, Asia-Pacific dominated with 45.60% share in 2025, whereas Middle East & Africa is projected to climb at a 14.95% CAGR through 2031.
Note: Market size and forecast figures in this report are generated using Mordor Intelligence’s proprietary estimation framework, updated with the latest available data and insights as of 2026.
Market Trends and Insights
Drivers Impact Analysis of Fingerprint Sensors Market*
| Driver | (~) % Impact on CAGR Forecast | Geographic Relevance | Impact Timeline |
|---|---|---|---|
| Smartphone OEM shift to under-display ultrasonic sensors | 2.10% | Global, led by Asia-Pacific | Medium term (2-4 years) |
| Government e-ID & e-Passport roll-outs accelerating demand | 1.80% | Middle East & Africa, South America | Long term (≥ 4 years) |
| Payment-grade biometric smart-card commercial launches | 1.40% | Europe, North America | Medium term (2-4 years) |
| Automotive in-cabin biometrics mandated for key-less access | 2.30% | North America, Europe, China | Long term (≥ 4 years) |
| AI-driven spoof-detection improving security certification | 1.20% | Global | Short term (≤ 2 years) |
| Falling cost/area of thin-film piezoelectric PMUT arrays | 1.70% | Global, manufacturing in Asia | Medium term (2-4 years) |
| Source: Mordor Intelligence | |||


Smartphone OEM Shift to Under-Display Ultrasonic Sensors
Ultrasonic under-display designs let handset makers preserve edge-to-edge OLED screens while retaining high-confidence biometric security. Qualcomm’s latest 3D Sonic Max transducer captures a 600 mm² image in 250 ms and sustains unlock even with damp or oily skin, outperforming optical modules in spoof testing. Samsung, Google and Xiaomi have committed flagship lines to ultrasonic implementations in 2025 product roadmaps, aligning with Android 16 biometric APIs that raise FAR/FRR certification thresholds. The resulting scale economies lower ASPs for tier-2 OEMs, accelerating volume growth across price bands and propelling the fingerprint sensors market into its next device cycle. [2]Qualcomm Technologies, “3D Sonic Max Specifications,” qualcomm.com
Government e-ID & e-Passport Rollouts Accelerating Demand
Digital identity programs from the UAE to South Africa now specify multi-factor biometrics, typically including fingerprint templates stored in secure elements. Mauritius issued its MNIC 3.0 card in February 2024, embedding match-on-card fingerprint authentication that enables wallet-based cross-border recognition. Papua New Guinea’s SevisPass pilot underscores how small economies leapfrog to biometric IDs without legacy infrastructure. Such schemes create multi-year procurement waves for trusted sensor modules, anchoring the fingerprint sensors market in the public-sector budget cycle.
Payment-Grade Biometric Smartcard Commercial Launches
EMV-compliant biometric cards eliminate PIN friction at the point of sale. IDEMIA’s F.CODE card integrates an FPC1323 sensor, an Infineon SLC39B secure element and a Renesas MCU, shipping in volume to European issuers since Q1 2025. Mastercard’s 2025 tokenization roadmap points to card-level biometrics as the preferred fallback when mobile wallets are offline. The growing installed base of contactless POS terminals — exceeding 90 million globally — ensures immediate acceptance, elevating smartcards to a high-growth slice of the fingerprint sensors market.
Automotive In-Cabin Biometrics Mandated for Keyless Access
New vehicle architectures increasingly place the start button, infotainment profile and digital wallets behind a fingerprint scan. Infineon’s AEC-Q100-qualified CYFP10020 sensor operates from −40 °C to +105 °C and endures 500 k cycles, satisfying OEM durability metrics. Continental’s CES 2025 demo coupled driver identification to ADAS settings, illustrating cross-domain value. With UNECE WP.29 cyber-security rules taking effect for 2025 models, OEMs see fingerprint authentication as a cost-effective layer for attack-surface reduction.
Restraints Impact Analysis of Fingerprint Sensors Market*
| Restraint | (~) % Impact on CAGR Forecast | Geographic Relevance | Impact Timeline |
|---|---|---|---|
| Rapid adoption of facial recognition in premium devices | -1.90% | Global, concentrated in premium segments | Medium term (2-4 years) |
| Data-privacy legislation limiting biometric data retention | -1.30% | Europe, North America, expanding globally | Long term (≥ 4 years) |
| Supply-chain reliance on high-end 8-inch CIS foundries | -1.60% | Global, manufacturing concentrated in Asia | Short term (≤ 2 years) |
| False-accept anxiety in wet-finger outdoor conditions | -0.80% | Global, particularly humid and outdoor environments | Medium term (2-4 years) |
| Source: Mordor Intelligence | |||
Rapid Adoption of Facial Recognition in Premium Devices
Apple’s iPhone 17 range and Samsung’s Galaxy Z7 Fold Pro both default to 3-D facial unlock, shifting biometric mindshare toward camera-based modalities. Yet 93% of handsets shipping in 2025 still carry a fingerprint reader, and under-display sensors are expected to return to the iPhone portfolio when technology meets Apple’s 0.002 % FAR target. Fingerprint methods remain preferred for wet environments, gloved usage and privacy-sensitive workflows such as banking apps that require on-device template storage, so cannibalization largely affects the premium tail rather than the bulk of the fingerprint sensors market. [3]Apple, “Face ID Security Overview,” apple.com
Data-Privacy Legislation Limiting Biometric Data Retention
The EU AI Act caps biometric template retention to “strictly necessary” periods, enforcing hardware-level match-on-sensor for government and workplace deployments. Colorado’s July 2025 rules mandate opt-in consent and breach notification within 30 days, pushing integrators to add secure enclaves and on-chip encryption engines. These measures raise compliance spend and slow pilot cycles, moderating the growth curve for the fingerprint sensors market in highly regulated regions.
*Our forecasts treat driver/restraint impacts as directional, not additive. The impact forecasts reflect baseline growth, mix effects, and variable interactions.
Fingerprint Sensors Market Segment Analysis
By Sensor Type:
Ultrasonic Technology Gains Premium PositioningCapacitive units retained a 50.35% share of the fingerprint sensors market in 2025 owing to mature cost curves and broad application reach. Ultrasonic chips, however, are set to climb at 15.02% CAGR and are projected to narrow the revenue gap by 2031 as OEMs migrate high-tier phones and automotive consoles toward volumetric imaging. The fingerprint sensors market size for ultrasonic devices is on track to surpass USD 4.37 billion by 2031, reflecting premium ASPs and automotive qualification margins. Research from Berkeley’s Sensor & Actuator Center shows KNN-based PMUT arrays generating 105.5 dB/V output, enhancing penetration through thick cover glass and gloves.
Performance advantages are translating into certification wins. Qualcomm’s 3D Sonic Max achieved FIDO Level-3 and BSI CC EAL 6+ in 2025, enabling German eID compliance. Optical sensors continue servicing cost-sensitive tiers and kiosk terminals, while thermal variants remain niche for harsh-environment and postmortem forensics. Altogether, technology diversity sustains the broader fingerprint sensors market even as ultrasonic leadership cements in premium segments.


By Form Factor:
Under-Display Integration Reshapes Design ParadigmsRear/front mounts generated 41.55% of 2025 revenue, helped by legacy handset designs and rugged handhelds. Yet under-display ultrasonic modules will post the fastest 15.85% CAGR, taking advantage of OLED substrate thinning and localized acoustic coupling layers. The fingerprint sensors market share for under-display formats is expected to reach 39.15% by 2031 as bezel-less design becomes ubiquitous among sub-USD 400 devices. Apple, Samsung and Oppo collectively placed orders exceeding 250 million under-display sensors die in H2 2024 production slots, signalling scale adoption.
Side-mounted capacitive strips remain popular in foldables and gaming phones that prioritize rapid tap detection, while on-button/home-key designs linger in enterprise notebooks where keyboard replacement cycles lag smartphones by 2–3 years. Sensor-in-OLED prototypes under test at BOE and Visionox merge fingerprint capture with heart rate photoplethysmography, hinting at multifunctional panels that could redefine the next chapter of the fingerprint sensors market.
By Application:
Smart-Cards Emerge as High-Growth OpportunitySmartphones & tablets accounted for 71.12% of shipments in 2025, underscoring their historic role in scaling the fingerprint sensors market. Nevertheless, the application’s CAGR moderates to 8.95% as handset growth plateaus. Smart cards & payment tokens eclipse all others with a 15.9% CAGR forecast. The fingerprint sensors market size for card applications is expected to exceed USD 1.78 billion by 2031, driven by EMVCo Level 2 certifications and European Digital Identity Wallet regulations.
Laptops/PCs sustain corporate demand for zero-trust endpoint security, whereas IoT locks and wearables supply incremental volume, particularly in hospitality and residential settings. Yale’s Z-Wave 800-equipped Assure Lock 2 Touch indicates consumer willingness to pay a USD 50 premium for fingerprint convenience. Industrial Internet gateways and healthcare tablets round out emerging use cases, reinforcing the diversified trajectory of the fingerprint sensors market.
By End-User Industry:
Automotive Sector Drives Fastest ExpansionConsumer electronics OEMs captured 61.45% of 2025 revenue but face mid-single-digit growth as smartphone refresh intervals elongate. Automotive & mobility shows the strongest upside at 17.95% CAGR, fuelled by EV platforms that integrate driver authentication with battery-swap payments. The fingerprint sensors market size linked to vehicles could exceed USD 2.24 billion by 2031 if current attach-rate projections hold. HID Global estimates that 60% of new-build charging pylons in North America will embed fingerprint recognition for payment authorization by 2027.
BFSI & fintech benefit from biometric-on-card deployments, while government & law-enforcement programs deliver predictable procurement cycles anchored to national ID renewal timetables. Military & defense contracts, although limited in unit volume, demand ruggedized form factors with IP68 sealing and chemical resistance, supporting higher-margin niches. In combination, these adoption fronts sustain a broad opportunity matrix within the fingerprint sensors market.
Geography Analysis
APAC Fingerprint Sensors Market
Asia-Pacific’s 45.60% revenue share reflects a unique integration of supply chain depth and end-market demand. China’s vertically aligned handset ecosystem, Korea’s AMOLED innovation and Japan’s piezo ceramics leadership collectively anchor a resilient regional value chain. India’s Aadhaar 2.0 roadmap and Indonesia’s e-KTP upgrade pipeline further underwrite multi-year domestic demand. Regional governments also sponsor local silicon fabrication incentives, lowering landed costs and reinforcing Asia-Pacific as the gravitational center of the fingerprint sensors market.
MEA Fingerprint Sensors Market
Middle East & Africa is projected to expand at 14.95% CAGR, the fastest worldwide. The UAE’s national biometric wallet and Saudi Arabia’s Nafath platform both require certified fingerprint modules for citizen onboarding, catalysing bulk card and kiosk orders. South Africa’s USD 2.5 million smart ID card tender aims for mass issuance before the 2029 elections, illustrating Africa’s leapfrogging toward digital identity infrastructures. With regional payment networks such as made and e-Fawateer shifting to biometric tokenization, supplier pipelines for sensors are tightening, underscoring the growth potential of the fingerprint sensors market in emerging economies.
North America and Europe Fingerprint Sensors Market
North America and Europe sustain mid-single-digit trajectories underpinned by automotive biometrics, enterprise security upgrades and stringent data-privacy compliance. The European Digital Identity Framework mandates wallet rollout by 2026, translating into 450 million residents requiring device or card-based fingerprint authentication. TSMC’s USD 40 billion Arizona fabs, due to open Phase 2 lines in 2026, will localize ultrasonic PMUT wafer starts for key U.S. handset accounts, strengthening onshore supply resilience and balancing the global distribution of the fingerprint sensors market.

Regulatory Landscape
Privacy and biometric security requirements are increasingly shaping how fingerprint sensors are implemented, with pressure toward on-device matching and stronger data minimization practices. In the United States, California Consumer Privacy Act regulations effective January 1, 2026 treat fingerprint-based device unlocking data as sensitive personal information, tightening opt-in consent, transparency, and handling rules for biometric identifiers across consumer and enterprise deployments.
Value Chain Analysis
The fingerprint sensor value chain covers materials and components, including CMOS/ASICs and piezoelectric films and PMUT stacks for ultrasonic solutions, along with packaging and cover materials. After that, module assembly combines the sensor with a controller and firmware, and the sensor is then integrated into end devices and credentials, including smartphones, laptops, access devices, smart locks, and biometric cards. As use cases move beyond unlock-only applications toward higher-assurance workflows, value capture is shifting toward integrated subsystems that bundle sensing, biometric processing, and security functions, such as pairing sensors with secure elements for match-on-card and protected template storage.
Competitive Landscape
The fingerprint sensors market is moderately fragmented, with technology specialization rather than pure scale defining leadership. Qualcomm, Goodix and Fingerprint Cards collectively control an estimated 38% of revenue, while Synaptics, Egis Tech and IDEX Biometrics address focused verticals. Qualcomm leverages GaAs PMUT IP and 7 nm control ASICs to defend the ultrasonic tier, whereas Goodix dominates optical solutions on AMOLED displays. Fingerprint Cards shifted toward IP licensing in 2024, diversifying risk away from smartphone cycles.
Strategic activity centers on ecosystem partnerships and vertical integration. Infineon bundles sensors with secure elements for card issuers, lowering certification friction and fostering lock-in. Synaptics collaborates with Google to embed TensorFlow Lite models on its Astra AI-native MCUs for voice-activated door locks, demonstrating the convergence of speech, vision and touch biometrics on a single edge platform. TDK’s MEMS sensor program links fingerprint capture with motion and environmental sensing for unified wearables stacks, appealing to fitness-focused OEMs.
New entrants pursue contactless capture, multimodal fusion and specialized forensics. IDloop’s 5 M-point 3-D scanner meets airport throughput constraints without physical touch, while NEC’s hybrid finger-vein/fingerprint module targets ATM retrofits in Japan. Patent filings related to acoustic holography and OLED-embedded photonics rose 24% YoY in 2024, signalling sustained R&D investment that will influence competitive dynamics in the fingerprint sensors market through the decade.
Fingerprint Sensors Industry Leaders
Goodix Technology Co., Ltd.
Fingerprint Cards AB
Qualcomm Technologies, Inc.
Synaptics Incorporated
Egis Technology Inc.
- *Disclaimer: Major Players sorted in no particular order
Fingerprint Sensors Market Companies Covered in this Report
- Apple Inc.
- AU Optronics Corp.
- CrucialTec Co., Ltd.
- Egis Technology Inc.
- Fingerprint Cards AB
- Goodix Technology Co., Ltd.
- HID Global Corporation
- IDEX Biometrics ASA
- Infineon Technologies AG
- NEC Corporation
- Next Biometrics ASA
- Qualcomm Technologies Inc.
- Samsung System LSI Business
- Shenzhen Chipone / Novatek (Biometric BU)
- Sonavation Inc.
- STMicroelectronics N.V.
- Synaptics Incorporated
- TDK Corporation (InvenSense)
- Thales Group
- TKH Group (Nedap)
- VKANSEE Technology Inc.

Market Opportunities and Future Outlook
Payments, digital identity, and device-to-cloud authentication broaden the addressable market beyond smartphones as standards and platforms codify higher-assurance fingerprint workflows. ISO/IEC 17839-1:2025 supports technical implementations for biometric system-on-card deployments, which can help issuers and integrators when deploying biometric payment cards and government credentials. The FIDO Alliance released CTAP v2.3 in February 2026, standardizing authenticator communication and reinforcing fingerprint sensors as a built-in user verification option for PCs, mobile devices, and security keys.
Recent Industry Developments in Fingerprint Sensors Market
- June 2026: Elementik launched the ByteSeal biometric hardware credential vault powered by Fingerprint Cards AB's AllKey, positioning fingerprint authentication as part of a bundled secure credential and key-storage workflow. This expands demand beyond standalone sensors toward integrated embedded-security solutions that combine hardware, software, and lifecycle management.
- December 2025: Goodix announced its touchscreen controller and side-key capacitive fingerprint solution was designed into Samsung's Galaxy Z TriFold. The design win reinforces side-mounted capacitive sensors as a key biometric placement in foldable form factors where under-display integration can be more complex.
- July 2024: Fingerprint Cards AB secured a major order for fingerprint sensor modules from a global FIDO solutions provider. The order points to continued commercialization of fingerprint-based authenticators and supports the channel for security keys and enterprise authentication devices.


Fingerprint Sensors Market Report Scope and Research Methodology
Market Definition and Coverage
For this methodology, the fingerprint sensor market covers revenues earned from fingerprint sensing components used to capture, match, and authenticate fingerprints across devices and access systems, measured at the point of sale from sensor and module suppliers into OEM and system channels.
Scope exclusions: We exclude downstream services and software-only biometric platforms that do not include fingerprint sensor hardware.
Segments Covered in This Report
- By Sensor Type
- Optical
- Capacitive
- Thermal
- Ultrasonic
- By Form Factor / Placement
- Rear/Front Mount
- Side-mounted
- Under-display (Optical)
- Under-display (Ultrasonic)
- On-button / Home-key
- By Application
- Smartphones and Tablets
- Laptops / PCs
- Smart-Cards and Payment Tokens
- IoT / Smart Locks and Wearables
- By End-user Industry
- Consumer Electronics OEM
- BFSI and FinTech
- Government and Law-Enforcement
- Military and Defense
- Automotive and Mobility
- By Geography
- North America
- United States
- Canada
- Mexico
- Europe
- United Kingdom
- Germany
- France
- Italy
- Rest of Europe
- Asia-Pacific
- China
- Japan
- India
- South Korea
- Rest of Asia-Pacific
- Middle East
- Israel
- Saudi Arabia
- United Arab Emirates
- Turkey
- Rest of Middle East
- Africa
- South Africa
- Egypt
- Rest of Africa
- South America
- Brazil
- Argentina
- Rest of South America
- North America
Data Sources, Market Sizing, and Validation
Desk Research
Desk research was used to build the demand map for fingerprint sensing, and then the assumptions were refined using field inputs. We relied on public data series and technical references such as ITU device connectivity indicators, World Bank macro and income data, UN Comtrade trade flows for relevant electronics categories, and USITC tariff schedules to understand shipment and pricing direction.
To keep the model grounded, we also reviewed sources such as USPTO patent disclosures for sensing and spoof-resistance trends, and standards and guidance notes from bodies such as NIST. We supplemented this with public materials like company annual reports, investor presentations, and credible electronics press coverage to track product cycle timing. Where public disclosures were limited, we used internal paid subscriptions for company financials, patent lookups, and shipment-level trade signals. These sources are illustrative and not exhaustive, and many other references were also used for data collection, validation, and research clarification.
Primary Interviews and Surveys
Primary work focused on interviews and short surveys with sensor suppliers, module integrators, OEM sourcing teams, channel partners, and domain experts who monitor smartphone, PC, automotive, and access control demand. For a global view, we balanced conversations across major consumption and manufacturing regions so that unit trends, average selling price (ASP) shifts, and mix changes by technology could be checked before finalizing assumptions.
Distribution of primary research fieldwork respondents
| Company type | Respondent position | Region |
|---|---|---|
| Top tier: 35% | CXOs: 13% | APAC: 43% |
| Mid tier: 45% | Functional/Unit leaders: 32% | EMEA: 32% |
| Smaller Players: 20% | Managers: 55% | Americas: 25% |
Market-Sizing & Forecasting
Market sizing was built by linking the addressable device pool to fingerprint sensor attach rates, and then converting units to value using realistic ASP bands by sensor type. In practice, a top-down build was done by reconstructing demand from device shipments and installed base indicators, and then adjusting for fingerprint penetration by application and region.
Selective bottom-up checks were used as guardrails, including supplier revenue sanity checks, sampled unit price quotes from the channel, and technology mix splits across optical, capacitive, and ultrasonic designs. Key inputs used in the model included device refresh cycles, the shift from rear and side sensors to under-display designs, regional manufacturing concentration, bill-of-materials pressure on entry models, and replacement demand patterns for access devices. Where gaps existed in public unit data, ranges were filled using expert-validated ratios and stress-tested so totals did not swing too much due to one input.
Forecasting used scenario analysis supported by simple multivariate relationships, where shipment outlook, penetration trajectory, and ASP erosion or uplift were varied together and then reconciled back to what experts expect in sourcing cycles.
Data Validation & Update Cycle
Outputs were checked in several steps to keep the final numbers consistent with market signals. We compared modeled totals against independent indicators such as regional device shipment direction, trade movement trends, and observed pricing steps when technology mix changed, and then reviewed and corrected unusual jumps.
Before sign-off, the model and key assumptions go through internal reviews, and re-contacts are triggered when a driver changes materially, such as a sharp ASP reset, a major design shift, or a macro event that impacts electronics demand. Reports are refreshed annually, with interim updates for material events, and a final pre-delivery check is completed so clients receive the latest updated view.
Mordor Intelligence's Global Fingerprint Sensor Market Sizing Compared With Other Published Estimates
Published market sizes for fingerprint sensors can look far apart, even when they reference similar end uses, because the timing and conversion choices behind the numbers are not the same. The largest differences usually come from when ASP drops are recognized, which year is treated as the current baseline, and how currency is converted for suppliers that sell in multiple regions.
Because refresh cadence, FX timing, and mix-linked ASP steps were cross-checked against device shipment signals before finalization, Mordor Intelligence aligns the value path more tightly to under-display adoption and regional demand turns than estimates that lock older price bands for longer.
Benchmark comparison
| Source | Market Size | Gaps in Research Methodology |
|---|---|---|
| Mordor Intelligence | USD 11.94 B (2026) | |
| Global Consultancy A | USD 4.20 B (2024) | Uses an earlier base year and tends to anchor value to a narrower device pool with older ASP assumptions, which can understate later uplift as under-display designs scale. |
| Industry Publisher B | USD 4.30 B (2024) | Shows a 2024 snapshot that appears to apply broad ASP erosion across the forecast window, and the FX conversion timing and unit-signal cross-checks are not clearly spelled out. |
Across the three figures, the spread mainly reflects base-year selection, how quickly ASP changes are rolled forward, and whether the model is re-checked against device and channel signals when mix shifts. By keeping the scope centered on fingerprint sensor hardware revenues and by using repeatable checks on units, penetration, and pricing steps, the estimate stays easier to trace and update when the market changes.


Key Questions Answered in the Report
What is the current size of the fingerprint sensors market?
The market is valued at USD 11.94 billion in 2026 and is projected to reach USD 20.79 billion by 2031, growing at an 11.74% CAGR.
Which sensor technology is growing fastest?
Ultrasonic fingerprint sensors lead growth with a 15.02% CAGR thanks to superior spoof resistance and under-display integration.
Why are biometric payment cards important for future demand?
EMV-compliant fingerprint cards remove PIN limits at contactless terminals, creating a 15.9% CAGR opportunity that diversifies revenue beyond smartphones.
How quickly is the automotive sector adopting fingerprint authentication?
Automotive applications are expanding at an 17.95% CAGR as OEMs embed fingerprint sensors for keyless access and in-cabin personalization.
Which region has the biggest share in Fingerprint Sensors Market?
Middle East & Africa is forecast to expand at 14.95% CAGR, driven by national digital identity programs and infrastructure modernization.
Will facial recognition replace fingerprint sensors?
Facial recognition is gaining in premium devices, but 93% of smartphones shipping in 2025 still include a fingerprint reader, indicating continued coexistence of modalities.
Page last updated on:


