Epoxy Grout Market Size and Share
Market Overview
| Study Period | 2020 - 2031 |
|---|---|
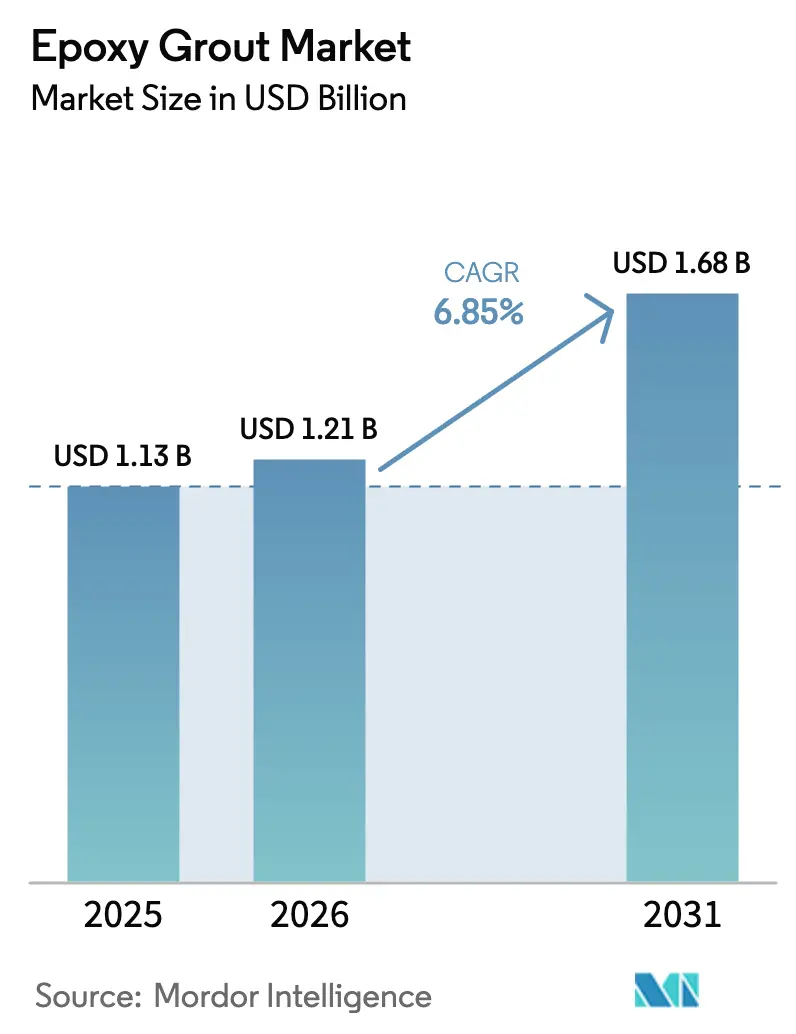
| Market Size (2026) | USD 1.21 Billion |
| Market Size (2031) | USD 1.68 Billion |
| Growth Rate (2026 - 2031) | 6.85% CAGR |
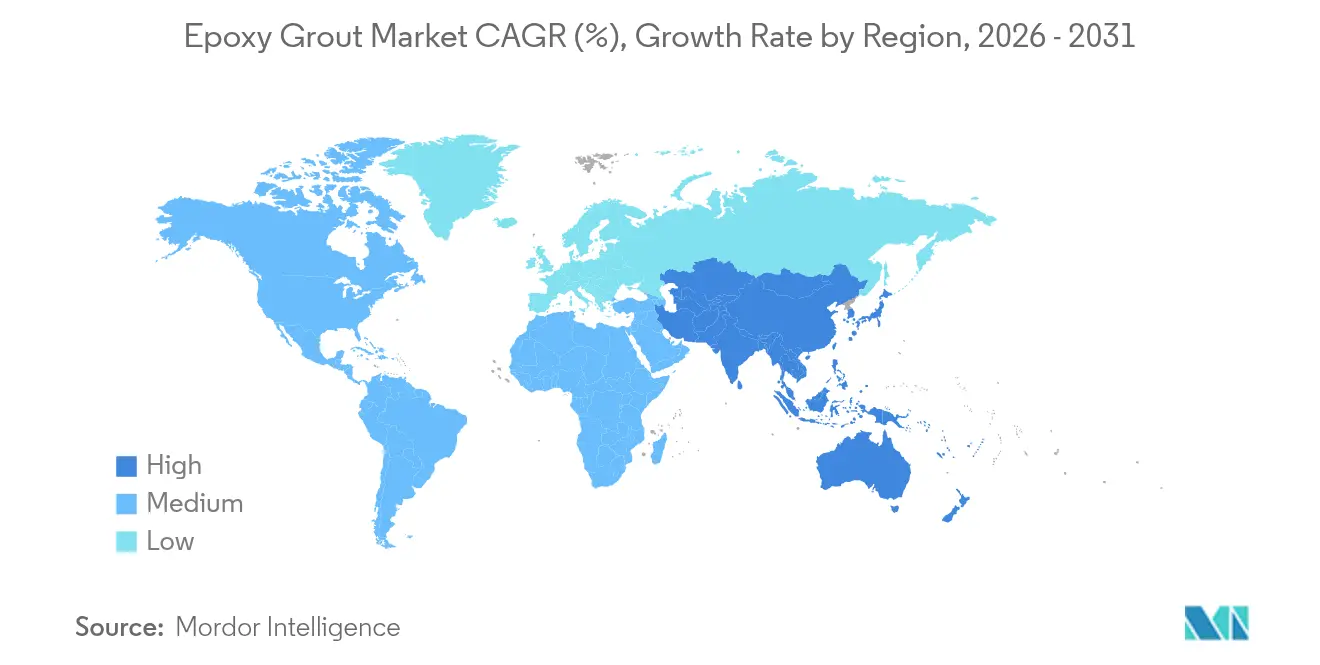
| Fastest Growing Market | Asia Pacific |
| Largest Market | Asia Pacific |
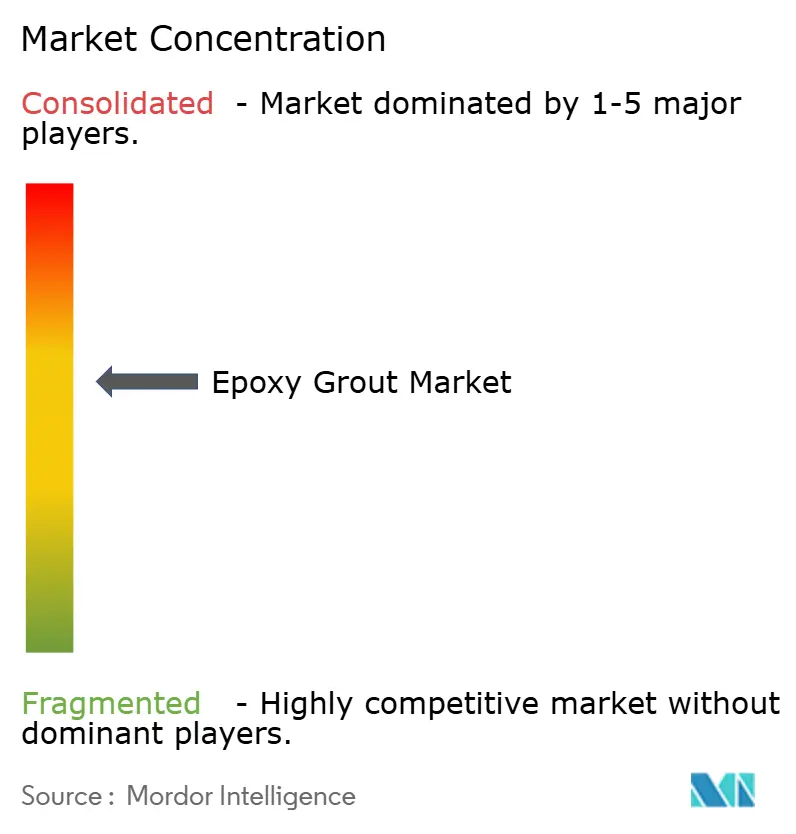
| Market Concentration | Medium |
Major Players *Disclaimer: Major Players sorted in no particular order Image © Mordor Intelligence. Reuse requires attribution under CC BY 4.0. | |
Epoxy Grout Market Analysis by Mordor Intelligence
The Epoxy Grout Market size was valued at USD 1.13 billion in 2025 and estimated to grow from USD 1.21 billion in 2026 to reach USD 1.68 billion by 2031, at a CAGR of 6.85% during the forecast period (2026-2031). Infrastructure modernization programs, premium flooring preferences, and tightening durability regulations together keep demand elevated across all major construction segments. The Asia-Pacific region leads the adoption of non-shrink, chemical-resistant formulations for public-sector megaprojects, including rail and highway works. In North America, federal outlays under the Infrastructure Investment and Jobs Act accelerate the replacement of aging water and transportation assets. Europe’s push toward green buildings favors long-life materials that improve life-cycle assessments and lower embodied carbon. The epoxy grout market continues to benefit from regulatory moves that penalize premature maintenance and reward extended service life, reinforcing its value proposition over cementitious alternatives.
Key Report Takeaways
- By resin type, pure epoxy captured 57.90% of the epoxy grout market share in 2025 while growing at a 7.45% CAGR through 2031.
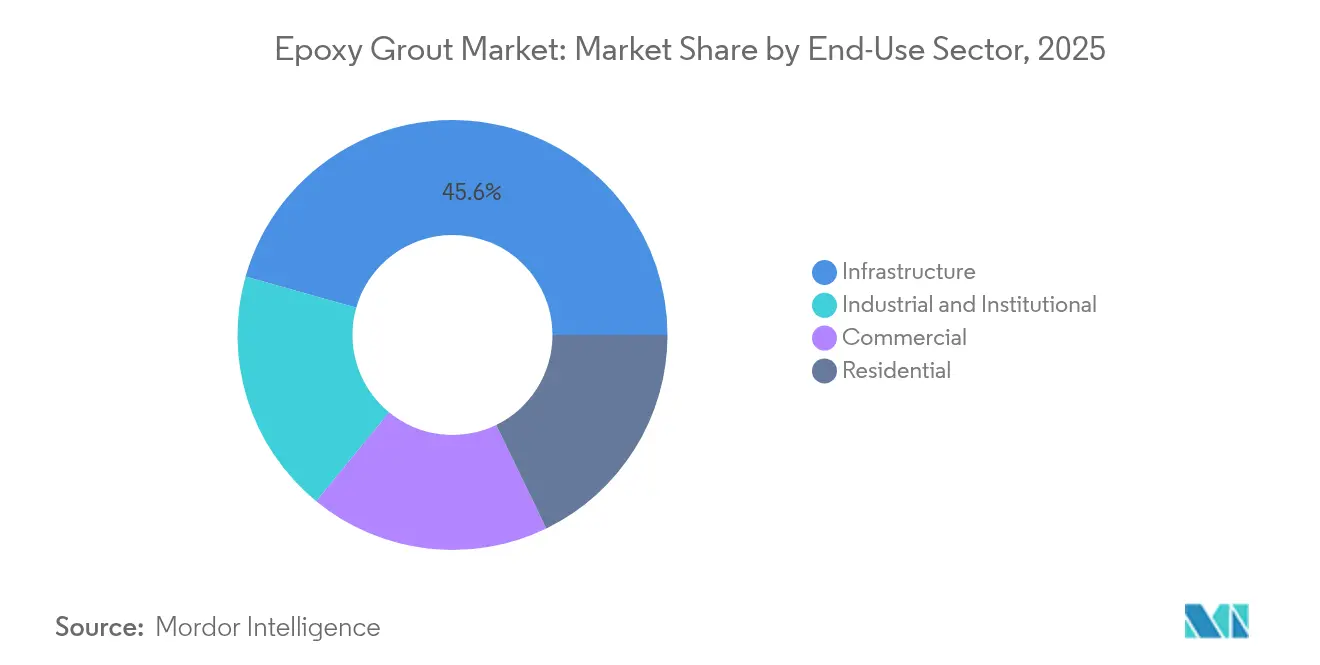
- By end-use sector, infrastructure accounted for 45.62% of the epoxy grout market size in 2025, and industrial and institutional is projected to expand at an 7.85% CAGR through 2031.
- By geography, the Asia-Pacific region commanded 39.20% of the 2025 global revenue and is expected to advance at a 7.15% CAGR through 2031.
Note: Market size and forecast figures in this report are generated using Mordor Intelligence’s proprietary estimation framework, updated with the latest available data and insights as of 2026.
Global Epoxy Grout Market Trends and Insights
Drivers Impact Analysis*
| Drivers | (~) % Impact on CAGR Forecast | Geographic Relevance | Impact Timeline |
|---|---|---|---|
| Rapid growth in rail and road construction projects in Asian countries | +1.8% | Asia-Pacific core, spill-over to MEA | Medium term (2-4 years) |
| Rising investments in wastewater treatment facilities | +1.2% | Global, with concentration in North America and EU | Long term (≥ 4 years) |
| Shift toward premium, stain-proof flooring finishes | +0.9% | North America and EU, expanding to APAC urban centers | Short term (≤ 2 years) |
| Government incentives for green buildings | +0.7% | Global, led by EU and California regulations | Medium term (2-4 years) |
| Niche demand from data-center facilities | +0.5% | North America and APAC technology hubs | Short term (≤ 2 years) |
| 3-D printed construction adopting epoxy-based grouts | +0.3% | Pilot projects in US, Netherlands, Singapore | Long term (≥ 4 years) |
| Source: Mordor Intelligence | |||


Rapid Growth in Rail and Road Construction Projects in Asian Countries
Rail and highway megaprojects reshape epoxy grout demand, as track-bed stabilization and tunnel lining require non-shrink, fatigue-resistant grouts. China’s Belt and Road corridors and India’s USD 1.4 trillion National Infrastructure Pipeline channel sustained funding toward high-speed corridors where dynamic loads exceed 250 km/h[1]Ministry of Finance India, “National Infrastructure Pipeline Update,” indiabudget.gov.in. Indonesia’s Jakarta–Bandung line, operational since 2024, adopted epoxy grouts for ballastless track construction, setting a technical precedent across Southeast Asia. Engineers now favor pure epoxy grades to extend maintenance intervals on viaduct decks and expansion joints, boosting repeat procurement of premium formulations. Contractors gain schedule advantages from rapid-cure variants that shorten track possession times. As trans-Asian connectivity plans mature, specification guidelines embed epoxy grout as the baseline material for long-life rail infrastructure.
Rising Investments in Wastewater Treatment Facilities
Municipal utilities worldwide are upgrading their treatment plants to meet stricter discharge norms, generating consistent demand for chemical-resistant grouts that can withstand exposure to pH levels ranging from 2 to 12. The United States directs USD 55 billion of federal funding to water infrastructure under the IIJA, encouraging state agencies to specify epoxy systems in clarifier tanks and digesters. The European Union’s revised Urban Wastewater Treatment Directive triggers retrofit programs that replace corroded joints with impermeable epoxies. Smaller decentralized plants in emerging markets adopt packaged epoxy kits that fit constrained budgets yet deliver life-cycle cost savings. System integrators also pair grout with antimicrobial sealants to combat biofilm formation, thereby strengthening the value propositions in public health-critical facilities.
Shift Toward Premium, Stain-Proof Flooring Finishes
Healthcare, hospitality, and high-end residential developers are increasingly requesting epoxy grouts for large-format tile installations, where cleaning chemicals would otherwise discolor cementitious joints. LEED v5 now awards durability points for finishes that last beyond standard occupancy cycles, elevating epoxy solutions in specification checklists. Retail chains strive for uniform aesthetics across their global outlets, and color-stable grouts meet brand guidelines even under intense UV exposure. Manufacturers introduce extended-pot-life variants to give installers more working time on expansive floor plates. The Asia-Pacific’s urban middle class drives premium home renovations, further expanding the installed base of decorative epoxies.
Government Incentives for Green Buildings
Durability gains intrinsic to epoxy grout align with policy frameworks that count material longevity toward carbon savings. The EU Taxonomy recognizes service life as a sustainability metric, prompting architects to substitute cementitious grouts with epoxy alternatives on public projects. California’s Title 24 incorporates maintenance frequency into lifecycle assessments, implicitly favoring high-performance grouts in commercial builds. Financial institutions now link green-bond eligibility to durable construction materials, broadening the funding pool for epoxy-specified developments. Emerging-market councils replicate these standards, gradually normalizing premium grout selection in fast-growing urban clusters.
Restraints Impact Analysis*
| Restraints | (~) % Impact on CAGR Forecast | Geographic Relevance | Impact Timeline |
|---|---|---|---|
| High material and installation costs compared to cementitious grouts | -1.4% | Global, most pronounced in price-sensitive emerging markets | Short term (≤ 2 years) |
| Volatility in bisphenol-A–based epoxy resin prices | -0.8% | Global supply chains, acute in Asia-Pacific manufacturing | Medium term (2-4 years) |
| Limited installer skill base in emerging markets | -0.6% | Emerging markets in APAC, MEA, Latin America | Long term (≥ 4 years) |
| Source: Mordor Intelligence | |||
High Material and Installation Costs Compared to Cementitious Grouts
Epoxy formulations sell at three to five times the price of cementitious products. Specialized mixers, shorter pot life, and mandatory surface preparation add labor overheads that strain project budgets in emerging economies. Contractors often pass on these premiums, slowing adoption in residential and low-spec commercial builds. Lifecycle savings offset initial outlays only when asset owners value reduced downtime over the course of decades. Municipal agencies are now piloting total-cost-of-ownership procurement to demonstrate long-term benefits, yet a widespread shift hinges on contractor training and financing models that amortize upfront expenses.
Volatility in Bisphenol-A–Based Epoxy Resin Prices
Feedstock swings and trade remedies inject cost uncertainty. Anti-dumping duties on Asian imports into the EU and the United States lead to spot price hikes of 15–25%[2]U.S. International Trade Commission, “Epoxy Resins from China and India,” usitc.gov . Smaller suppliers struggle to hedge exposure, prompting inventory build-ups that inflate working capital. Producers accelerate research and development in bio-based epoxies to diversify supply, but commercial volumes remain limited. Until alternative chemistries scale, cost pass-throughs could dampen demand among cost-sensitive segments and regions.
*Our forecasts treat driver/restraint impacts as directional, not additive. The impact forecasts reflect baseline growth, mix effects, and variable interactions.
Segment Analysis
By End-Use Sector: Infrastructure Projects Anchor Volume Growth
Infrastructure accounted for a commanding 45.62% share of global revenue in 2025, and the segment is projected to continue rising as national governments prioritize resilient transportation corridors. Bridges, tunnels, and port quays require high-strength, non-shrink grouts to withstand dynamic wheel loads and environmental attacks. Commercial buildings hold a significant share, largely due to premium flooring systems in malls, hospitals, and hotels, where stain resistance and hygiene are paramount. Industrial and institutional facilities experience the fastest growth rate of 7.85%, driven by chemical processing, pharmaceuticals, and hyperscale data centers that require electrostatic discharge control and tolerance to corrosive media. Residential uptake remains low in volume but grows in luxury condominiums and high-rise condos as homeowners demand seamless aesthetics and reduced maintenance.
Infrastructure owners are increasingly bundling grout supply with long-term service contracts that track joint integrity using sensors. Such performance-based models reward suppliers that can guarantee the retention of compressive strength over decades, pushing further research and development in nano-reinforced epoxies. Meanwhile, industrial users prioritize rapid turnaround as every hour of downtime impacts plant output, leading to strong interest in fast-cure blends that develop operational strength within 8 hours.


By Resin Type: Superior Performance Sustains Pure Epoxy Leadership
Pure epoxy leads 2025 revenues with 57.90% epoxy grout market share and maintains a 7.45% CAGR to 2031, reflecting unrivaled bond strength and chemical resistance in infrastructure and industrial settings. Engineers select these grades for anchor bolt bedding, crane rail alignment, and heavy-duty machinery foundations that are subjected to cyclic or impact loads. Modified epoxies address niche requirements like flexible joints or extended pot life. Innovations in bio-derived hardeners appeal to green-building advocates, though adoption remains incremental as performance parity improves. Suppliers differentiate themselves through proprietary filler blends that reduce exotherm while maintaining compressive strength, securing premium pricing in temperature-sensitive applications.
Second-generation hybrids combine epoxy and polyurethane blocks to strike a balance between elasticity and strength. These formulations gain traction in equipment pads within seismic zones where movement tolerance mitigates crack propagation. Manufacturers also promote conductive fillers for data-center flooring that dissipate static, opening new verticals at the intersection of construction and electronics. Growth potential in modified grades will accelerate once cost gaps narrow and field trials validate long-term durability.

Geography Analysis
Asia-Pacific leads with 39.20% of 2025 turnover and maintains a 7.15% CAGR through 2031, powered by expansive transport corridors and urban transit schemes in China, India, and Southeast Asia. National programs, such as India’s National Infrastructure Pipeline, funnel steady capital expenditures toward bridges, metros, and expressways that demand high-performance grouts. Standards bodies in the region are now adopting ASTM C881 and comparable specifications, raising performance baselines and increasing pure epoxy consumption.
North America follows as the second-largest market. The Infrastructure Investment and Jobs Act injects USD 550 billion in fresh federal spending to modernize roads, bridges, and water assets. Mature contractor ecosystems already possess the necessary installation skill sets, so adoption barriers are relatively low. Data-center growth in Silicon Valley, Northern Virginia, and Texas accelerates demand for conductive epoxy systems that safeguard sensitive servers.
Europe ranks third yet punches above its weight in sustainability-driven applications. The EU Taxonomy equates material longevity with lower embodied carbon, nudging developers toward epoxy solutions despite initial price premiums. Germany and France spearhead industrial uptake, particularly in chemical parks subject to stringent containment rules. Repairs of historic masonry also employ low-shrink epoxies to stabilize heritage structures without altering façades.
South America, the Middle-East, and Africa are generating emerging revenue streams as governments push for port and airport expansions. Adoption trails often lead regions because procurement often prioritizes upfront costs, yet technical consultancies increasingly present total-cost-of-ownership analyses that highlight epoxy advantages. International contractors active in Gulf megaprojects import tried-and-tested epoxy specifications, lifting regional product standards.

Competitive Landscape
The epoxy grout market is moderately consolidated. Suppliers compete on filler technology that reduces exotherm in deep pours, packaging formats that cut mixing errors, and on-site technical services that train installers in correct ratios. Distribution networks matter because many projects require just-in-time deliveries to remote infrastructure sites. Regional producers retain share by customizing formulations to local climate and labor conditions, while multinational players leverage global procurement to hedge resin price swings. New entrants face certification hurdles as ASTM C881 compliance and green-building labels demand capital-intensive testing.
Epoxy Grout Industry Leaders
Sika AG
MAPEI S.p.A.
Ardex Group
Saint-Gobain
LATICRETE International Inc.
- *Disclaimer: Major Players sorted in no particular order

Recent Industry Developments
- March 2025: BASF and Sika jointly introduced Baxxodur EC 151, a next-generation epoxy hardener designed to enhance sustainability and performance in construction applications, including epoxy grout systems. This innovative amine-based curing agent significantly reduces volatile organic compound (VOC) emissions by up to 90% compared to conventional hardeners, making it ideal for environmentally conscious flooring and grouting projects.
- February 2025: Saint-Gobain has finalized its acquisition of Fosroc, a prominent global player in construction chemicals, significantly enhancing its presence across India, the Middle East, and the Asia-Pacific region. This strategic move, announced in June 2024 and completed in February 2025, marks a pivotal expansion of Saint-Gobain’s construction chemicals portfolio, encompassing Nitotile Epoxy Grout.


Global Epoxy Grout Market Report Scope
Commercial, Industrial and Institutional, Infrastructure, Residential are covered as segments by End Use Sector. Asia-Pacific, Europe, Middle East and Africa, North America, South America are covered as segments by Region.| Commercial |
| Industrial and Institutional |
| Infrastructure |
| Residential |
| Pure Epoxy |
| Modified Epoxy |
| Asia-Pacific | Australia |
| China | |
| India | |
| Indonesia | |
| Japan | |
| Malaysia | |
| South Korea | |
| Thailand | |
| Vietnam | |
| Rest of Asia-Pacific | |
| North America | Canada |
| Mexico | |
| United States | |
| Europe | France |
| Germany | |
| Italy | |
| Russia | |
| Spain | |
| United Kingdom | |
| Rest of Europe | |
| South America | Argentina |
| Brazil | |
| Rest of South America | |
| Middle-East and Africa | Saudi Arabia |
| United Arab Emirates | |
| Rest of Middle-East and Africa |
| By End-Use Sector | Commercial | |
| Industrial and Institutional | ||
| Infrastructure | ||
| Residential | ||
| By Resin Type | Pure Epoxy | |
| Modified Epoxy | ||
| By Geography | Asia-Pacific | Australia |
| China | ||
| India | ||
| Indonesia | ||
| Japan | ||
| Malaysia | ||
| South Korea | ||
| Thailand | ||
| Vietnam | ||
| Rest of Asia-Pacific | ||
| North America | Canada | |
| Mexico | ||
| United States | ||
| Europe | France | |
| Germany | ||
| Italy | ||
| Russia | ||
| Spain | ||
| United Kingdom | ||
| Rest of Europe | ||
| South America | Argentina | |
| Brazil | ||
| Rest of South America | ||
| Middle-East and Africa | Saudi Arabia | |
| United Arab Emirates | ||
| Rest of Middle-East and Africa | ||


Market Definition
- END-USE SECTOR - Epoxy grouts consumed in the construction sectors such as commercial, residential, industrial, institutional, and infrastructure are considered under the scope of the study.
- PRODUCT/APPLICATION - Under the scope of the study, the consumption of epoxy grouts for various applications like tile installation and wall joints are considered.
| Keyword | Definition |
|---|---|
| Accelerator | Accelerators are admixtures used to fasten the setting time of concrete by increasing the initial rate and speeding up the chemical reaction between cement and the mixing water. These are used to harden and increase the strength of concrete quickly. |
| Acrylic | This synthetic resin is a derivative of acrylic acid. It forms a smooth surface and is mainly used for various indoor applications. The material can also be used for outdoor applications with a special formulation. |
| Adhesives | Adhesives are bonding agents used to join materials by gluing. Adhesives can be used in construction for many applications, such as carpet laying, ceramic tiles, countertop lamination, etc. |
| Air Entraining Admixture | Air-entraining admixtures are used to improve the performance and durability of concrete. Once added, they create uniformly distributed small air bubbles to impart enhanced properties to the fresh and hardened concrete. |
| Alkyd | Alkyds are used in solvent-based paints such as construction and automotive paints, traffic paints, flooring resins, protective coatings for concrete, etc. Alkyd resins are formed by the reaction of an oil (fatty acid), a polyunsaturated alcohol (Polyol), and a polyunsaturated acid or anhydride. |
| Anchors and Grouts | Anchors and grouts are construction chemicals that stabilize and improve the strength and durability of foundations and structures like buildings, bridges, dams, etc. |
| Cementitious Fixing | Cementitious fixing is a process in which a cement-based grout is pumped under pressure to fill forms, voids, and cracks. It can be used in several settings, including bridges, marine applications, dams, and rock anchors. |
| Commercial Construction | Commercial construction comprises new construction of warehouses, malls, shops, offices, hotels, restaurants, cinemas, theatres, etc. |
| Concrete Admixtures | Concrete admixtures comprise water reducers, air entrainers, retarders, accelerators, superplasticizers, etc., added to concrete before or during mixing to modify its properties. |
| Concrete Protective Coatings | To provide specific protection, such as anti-carbonation or chemical resistance, a film-forming protective coat can be applied on the surface. Depending on the applications, different resins like epoxy, polyurethane, and acrylic can be used for concrete protective coatings. |
| Curing Compounds | Curing compounds are used to cure the surface of concrete structures, including columns, beams, slabs, and others. These curing compounds keep the moisture inside the concrete to give maximum strength and durability. |
| Epoxy | Epoxy is known for its strong adhesive qualities, making it a versatile product in many industries. It resists heat and chemical applications, making it an ideal product for anyone needing a stronghold under pressure. It is widely used in adhesives, electrical and electronics, paints, etc. |
| Fiber Wrapping Systems | Fiber Wrapping Systems are a part of construction repair and rehabilitation chemicals. It involves the strengthening of existing structures by wrapping structural members like beams and columns with glass or carbon fiber sheets. |
| Flooring Resins | Flooring resins are synthetic materials applied to floors to enhance their appearance, increase their resistance to wear and tear or provide protection from chemicals, moisture, and stains. Depending on the desired properties and the specific application, flooring resins are available in distinct types, such as epoxy, polyurethane, and acrylic. |
| High-Range Water Reducer (Super Plasticizer) | High-range water reducers are a type of concrete admixture that provides enhanced and improved properties when added to concrete. These are also called superplasticizers and are used to decrease the water-to-cement ratio in concrete. |
| Hot Melt Adhesives | Hot-melt adhesives are thermoplastic bonding materials applied as melts that achieve a solid state and resultant strength on cooling. They are commonly used for packaging, coatings, sanitary products, and tapes. |
| Industrial and Institutional Construction | Industrial and institutional construction includes new construction of hospitals, schools, manufacturing units, energy and power plants, etc. |
| Infrastructure Construction | Infrastructure construction includes new construction of railways, roads, seaways, airports, bridges, highways, etc. |
| Injection Grouting | The process of injecting grout into open joints, cracks, voids, or honeycombs in concrete or masonry structural members is known as injection grouting. It offers several benefits, such as strengthening a structure and preventing water infiltration. |
| Liquid-Applied Waterproofing Membranes | Liquid-Applied membrane is a monolithic, fully bonded, liquid-based coating suitable for many waterproofing applications. The coating cures to form a rubber-like elastomeric waterproof membrane and may be applied over many substrates, including asphalt, bitumen, and concrete. |
| Micro-concrete Mortars | Micro-concrete mortar is made up of cement, water-based resin, additives, mineral pigments, and polymers and can be applied on both horizontal and vertical surfaces. It can be used to refurbish residential complexes, commercial spaces, etc. |
| Modified Mortars | Modified Mortars include Portland cement and sand along with latex/polymer additives. The additives increase adhesion, strength, and shock resistance while also reducing water absorption. |
| Mold Release Agents | Mold release agents are sprayed or coated on the surface of molds to prevent a substrate from bonding to a molding surface. Several types of mold release agents, including silicone, lubricant, wax, fluorocarbons, and others, are used based on the type of substrates, including metals, steel, wood, rubber, plastic, and others. |
| Polyaspartic | Polyaspartic is a subset of polyurea. Polyaspartic floor coatings are typically two-part systems that consist of a resin and a catalyst to ease the curing process. It offers high durability and can withstand harsh environments. |
| Polyurethane | Polyurethane is a plastic material that exists in various forms. It can be tailored to be either rigid or flexible and is the material of choice for a broad range of end-user applications, such as adhesives, coatings, building insulation, etc. |
| Reactive Adhesives | A reactive adhesive is made of monomers that react in the adhesive curing process and do not evaporate from the film during use. Instead, these volatile components become chemically incorporated into the adhesive. |
| Rebar Protectors | In concrete structures, rebar is one of the important components, and its deterioration due to corrosion is a major issue that affects the safety, durability, and life span of buildings and structures. For this reason, rebar protectors are used to protect against degrading effects, especially in infrastructure and industrial construction. |
| Repair and Rehabilitation Chemicals | Repair and Rehabilitation Chemicals include repair mortars, injection grouting materials, fiber wrapping systems, micro-concrete mortars, etc., used to repair and restore existing buildings and structures. |
| Residential Construction | Residential construction involves constructing new houses or spaces like condominiums, villas, and landed homes. |
| Resin Fixing | The process of using resins like epoxy and polyurethane for grouting applications is called resin fixing. Resin fixing offers several advantages, such as high compressive and tensile strength, negligible shrinkage, and greater chemical resistance compared to cementitious fixing. |
| Retarder | Retarders are admixtures used to slow down the setting time of concrete. These are usually added with a dosage rate of around 0.2% -0.6% by weight of cement. These admixtures slow down hydration or lower the rate at which water penetrates the cement particles by making concrete workable for a long time. |
| Sealants | A sealant is a viscous material that has little or no flow qualities, which causes it to remain on surfaces where they are applied. Sealants can also be thinner, enabling penetration to a certain substance through capillary action. |
| Sheet Waterproofing Membranes | Sheet membrane systems are reliable and durable thermoplastic waterproofing solutions that are used for waterproofing applications even in the most demanding below-ground structures, including those exposed to highly aggressive ground conditions and stress. |
| Shrinkage Reducing Admixture | Shrinkage-reducing admixtures are used to reduce concrete shrinkage, whether from drying or self-desiccation. |
| Silicone | Silicone is a polymer that contains silicon combined with carbon, hydrogen, oxygen, and, in some cases, other elements. It is an inert synthetic compound that comes in various forms, such as oil, rubber, and resin. Due to its heat-resistant properties, it finds applications in sealants, adhesives, lubricants, etc. |
| Solvent-borne Adhesives | Solvent-borne adhesives are mixtures of solvents and thermoplastic or slightly cross-linked polymers such as polychloroprene, polyurethane, acrylic, silicone, and natural and synthetic rubbers. |
| Surface Treatment Chemicals | Surface treatment chemicals are chemicals used to treat concrete surfaces, including roofs, vertical surfaces, and others. They act as curing compounds, demolding agents, rust removers, and others. They are cost-effective and can be used on roadways, pavements, parking lots, and others. |
| Viscosity Modifier | Viscosity Modifiers are concrete admixtures used to change various properties of admixtures, including viscosity, workability, cohesiveness, and others. These are usually added with a dosage of around 0.01% to 0.1% by weight of cement. |
| Water Reducer | Water reducers, also called plasticizers, are a type of admixture used to decrease the water-to-cement ratio in the concrete, thereby increasing the durability and strength of concrete. Various water reducers include refined lignosulfonates, gluconates, hydroxycarboxylic acids, sugar acids, and others. |
| Water-borne Adhesives | Water-borne adhesives use water as a carrier or diluting medium to disperse resin. They are set by allowing the water to evaporate or be absorbed by the substrate. These adhesives are compounded with water as a dilutant rather than a volatile organic solvent. |
| Waterproofing Chemicals | Waterproofing chemicals are designed to protect a surface from the perils of leakage. A waterproofing chemical is a protective coating or primer applied to a structure's roof, retaining walls, or basement. |
| Waterproofing Membranes | Waterproofing membranes are liquid-applied or self-adhering layers of water-tight materials that prevent water from penetrating or damaging a structure when applied to roofs, walls, foundations, basements, bathrooms, and other areas exposed to moisture or water. |


Research Methodology
Mordor Intelligence follows a four-step methodology in all our reports.
- Step-1: Identify Key Variables: The quantifiable key variables (industry and extraneous) pertaining to the specific product segment and country are selected from a group of relevant variables & factors based on desk research & literature review; along with primary expert inputs. These variables are further confirmed through regression modeling (wherever required).
- Step-2: Build a Market Model: In order to build a robust forecasting methodology, the variables and factors identified in Step-1 are tested against available historical market numbers. Through an iterative process, the variables required for market forecast are set and the model is built on the basis of these variables.
- Step-3: Validate and Finalize: In this important step, all market numbers, variables and analyst calls are validated through an extensive network of primary research experts from the market studied. The respondents are selected across levels and functions to generate a holistic picture of the market studied.
- Step-4: Research Outputs: Syndicated Reports, Custom Consulting Assignments, Databases & Subscription Platforms


