Market Overview
| Study Period | 2020 - 2031 |
|---|---|
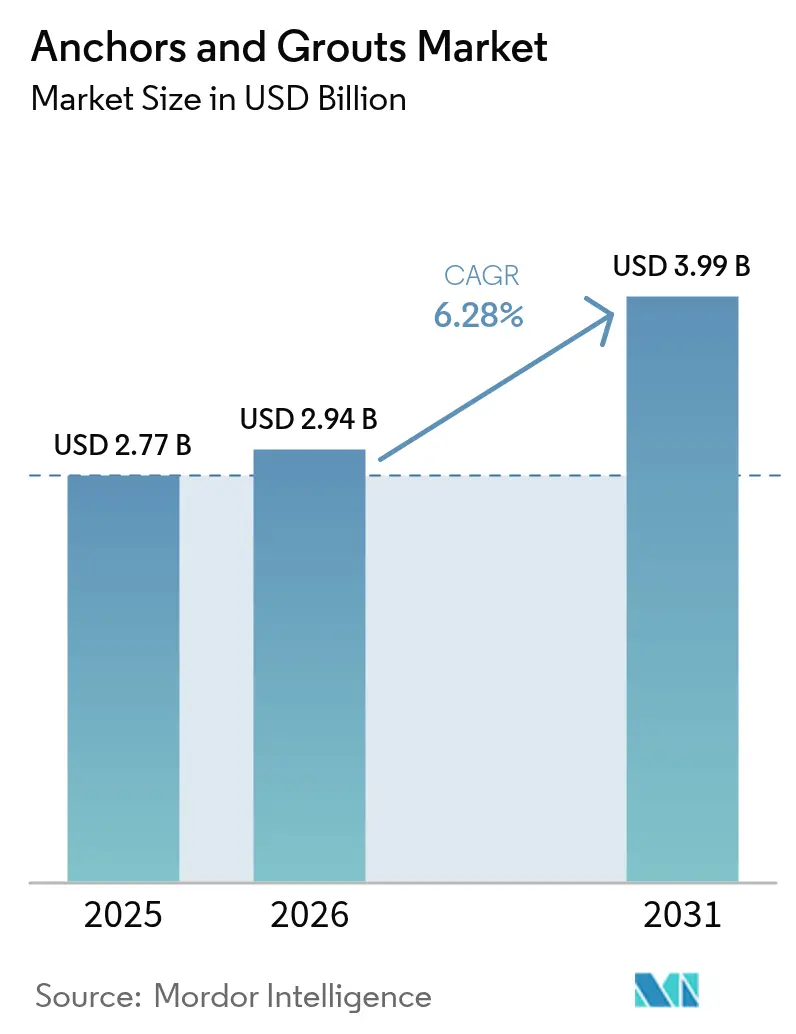
| Market Size (2026) | USD 2.94 Billion |
| Market Size (2031) | USD 3.99 Billion |
| Growth Rate (2026 - 2031) | 6.28% CAGR |
| Fastest Growing Market | Asia Pacific |
| Largest Market | Asia Pacific |
| Market Concentration | Medium |
Major Players *Disclaimer: Major Players sorted in no particular order Image © Mordor Intelligence. Reuse requires attribution under CC BY 4.0. | |
Anchors And Grouts Market Analysis by Mordor Intelligence
Anchors And Grouts market size in 2026 is estimated at USD 2.94 billion, growing from 2025 value of USD 2.77 billion with 2031 projections showing USD 3.99 billion, growing at 6.28% CAGR over 2026-2031. Robust public-sector infrastructure pipelines in the Asia-Pacific, seismic retrofit mandates in earthquake-prone regions, and offshore wind foundation projects are driving demand for high-performance injectable anchors that outperform mechanical fasteners in cracked concrete. Many national stimulus programs allocate a large share of transportation and renewable energy spending to projects that rely on resin fixing systems, encouraging producers to localize manufacturing and vertically integrate their raw material supplies. Volatility in epoxy and polyurethane feedstocks still pressures short-term margins, but operational-efficiency programs and backward integration into specialty resins have helped major suppliers protect EBITDA. Competitive intensity is rising as market leaders acquire regional formulators and invest in digital design tools that specify anchors with life-cycle cost data, service-life verification, and embedded sensors for asset management.
Key Report Takeaways
- By product type, resin fixing captured 61.40% of the Anchors and Grouts Market share in 2025. Moreover, the market share of this product type is expected to increase at the fastest CAGR of 6.58% during the forecast period (2026-2031).
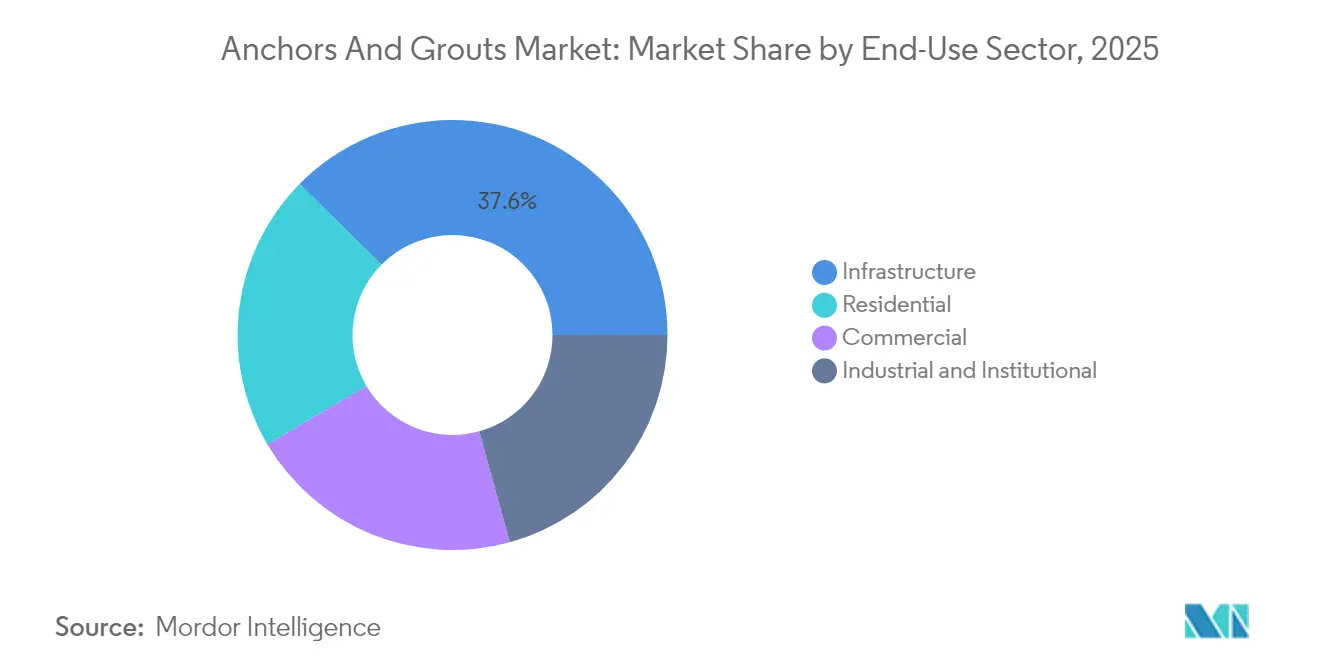
- By end-use sector, infrastructure accounted for 37.60% of the Anchors and Grouts Market size in 2025, and residential is forecasted to expand at a 6.72% CAGR through 2031.
- By geography, the Asia-Pacific region held 49.85% of the Anchors and Grouts Market size in 2025 and is expected to retain the fastest regional CAGR of 6.53% from 2026 to 2031.
Note: Market size and forecast figures in this report are generated using Mordor Intelligence’s proprietary estimation framework, updated with the latest available data and insights as of 2026.
Global Anchors And Grouts Market Trends and Insights
Drivers Impact Analysis*
| Driver | (~) % Impact on CAGR Forecast | Geographic Relevance | Impact Timeline |
|---|---|---|---|
| Surge in infrastructure spending across emerging markets | +1.8% | Asia-Pacific, Latin America, MEA | Medium term (2-4 years) |
| Growth in renovation activities in mature economies | +1.2% | North America, Europe | Short term (≤ 2 years) |
| Adoption of Anchors and Grouts for seismic-retrofitting codes | +0.9% | Global, concentrated in seismic zones | Long term (≥ 4 years) |
| Hybrid composite anchors for offshore-wind foundations | +0.6% | Europe, North America, Asia-Pacific coastal | Medium term (2-4 years) |
| Digital-twin-based predictive maintenance requiring injectable anchor repairs | +0.4% | Global, early adoption in developed markets | Long term (≥ 4 years) |
| Source: Mordor Intelligence | |||
Understand The Key Trends Shaping This Market
Download PDF
Surge in Infrastructure Spending Across Emerging Markets
Asia-Pacific governments have earmarked record budgets for highways, metros, ports, and energy projects for 2025–2028, and these projects require post-installed anchors for steel-to-concrete connections in piles, diaphragms, and precast elements[1]National Institution for Transforming India, “Infrastructure Vision 2025,” niti.gov.in. The localization of anchor manufacturing plants in India, Vietnam, and Indonesia is reducing lead times while creating jobs that align with national industrial policy goals. Formulators tailor epoxy viscosities to tropical climates, allowing anchors to cure quickly despite high humidity, thereby ensuring contractors meet aggressive project schedules. Regional suppliers are also standardizing European Technical Assessment (ETA) documentation to meet the due diligence requirements of international lenders, further accelerating the adoption of Anchor and Grout Markets. Multilateral agencies’ emphasis on climate resilience elevates demand for anchors certified for cracked concrete, cyclic loading, and water-filled drill holes.
Growth in Renovation Activities in Mature Economies
North American and European building-stock ages are approaching 50 years, prompting HVAC upgrades, façade retrofits, and structural reinforcements that depend on low-vibration installation. RPM International’s Construction Products Group reported USD 690.1 million Q2 2025 sales, up 4.3% year-over-year, largely from restoration projects that specify injectable anchors for hollow masonry and post-installed rebar. Contractors favor capsule and foil pack formats that minimize waste on small jobs. Digital inspection tools embedded in 3D scanning software identify anchor points and streamline pull-out testing, cutting field labor by 12% in pilot projects. The Anchors and Grouts Market benefits from this renovation wave because chemical systems reuse existing substrates rather than requiring costly demolition.
Adoption of Anchors and Grouts for Seismic-Retrofitting Codes
California, Japan, and Italy updated their building codes in 2024 to require anchors qualified under ACI 355.4 or ETAG 001, specifically seismic categories C1 or C2, for structural retrofits. Fischer’s FIS EM Plus epoxy mortar achieved 120-year service-life approval in cracked concrete filled with water, positioning it as a preferred solution for bridges and hospitals[2]Fischer Group, “FIS EM Plus ETA Documentation,” fischer.de. Insurance underwriters now provide premium discounts when owners specify anchors with documented seismic performance. Municipal grant programs reimburse up to 20% of retrofit costs, further boosting Anchors and Grouts Market penetration in older unreinforced masonry structures.
Hybrid Composite Anchors for Offshore-Wind Foundations
Monopile wind turbines scheduled for installation in the North Sea and U.S. Atlantic corridors require grout-filled sleeves secured with composite rods that resist corrosion in saltwater. Epoxy-acrylate hybrids with glass-flake reinforcement exhibit a bond strength that remains intact after 10,000 freeze-thaw cycles, thereby meeting the International Electrotechnical Commission (IEC) standards. Vessel day-rates above USD 300,000 incentivize fast anchor curing; thus, suppliers developed low-temperature systems that reach design strength in four hours at 5°C. Manufacturers anticipate that offshore-wind deployments alone could contribute USD 155 million to Anchors and Grouts Market size by 2030.
Restraints Impact Analysis*
| Restraint | (~) % Impact on CAGR Forecast | Geographic Relevance | Impact Timeline |
|---|---|---|---|
| Volatile epoxy and isocyanate feed-stock pricing | -1.1% | Global, concentrated in manufacturing hubs | Short term (≤ 2 years) |
| Skilled-labor shortages for specialty application | -0.8% | North America, Europe, developed markets | Medium term (2-4 years) |
| Fragmented standards on long-term performance testing | -0.5% | Global, varying by regional standards | Long term (≥ 4 years) |
| Source: Mordor Intelligence | |||
Volatile Epoxy and Isocyanate Feedstock Pricing
Benchmark Bisphenol-A and methylene diphenyl diisocyanate prices rose 17% between Q4 2024 and Q1 2025, squeezing margins for anchor formulators. Major producers responded by hedging propylene contracts and commissioning captive resin plants in Belgium and Texas to stabilize supply. Contracting parties now include raw-material escalation clauses, shifting some cost risk to project owners. Despite these measures, small and medium enterprises without purchasing leverage face liquidity pressure, which could slow new-product rollouts in the Anchors and Grouts Market.
Skilled Labor Shortages for Specialty Application
Associated Builders and Contractors estimates that the US construction sector will need 439,000 additional workers in 2025 to meet demand. Certified anchor installers earn 19% wage premiums, yet training pipelines lag. In response, Sika launched virtual-reality modules that teach drill-hole cleaning and resin injection sequences in eight languages, resulting in a 23% reduction in onsite error rates in pilot studies. Nevertheless, limited personnel could delay seismic-retrofit projects, tempering near-term growth in the Anchors and Grouts Market in developed economies.
*Our updated forecasts treat driver/restraint impacts as directional, not additive. The revised impact forecasts reflect baseline growth, mix effects, and variable interactions.
Segment Analysis
By Product Type: Resin Dominance Drives Innovation
Resin fixing systems accounted for 61.40% of the Anchors and Grouts Market share in 2025 and are expected to outpace cementitious systems with a 6.58% CAGR through 2031. High-load epoxy anchors can handle tension and shear loads exceeding 80 kN, meeting the specifications of bridges and nuclear plants. Vinyl ester blends offer rapid re-occupancy for commercial interiors by curing in 30 minutes at 20°C. Cementitious anchors remain cost-effective in fire-rated applications such as tunnel linings, yet lack the bond strength variance tolerance of resins. Manufacturers are incorporating recycled aggregates and bio-based hardeners, which lowers embodied carbon by 18% while retaining the same strength classes. The Anchors and Grouts Market size for resin systems is forecast to reach USD 2.55 billion in 2031, while the cementitious systems market is expected to plateau at near USD 1.44 billion.
R&D focuses on thixotropic control additives that prevent resin flow from overhead holes, boosting installation quality. Sika’s new hybrid epoxy-urethane technology increases Shore A hardness without compromising brittleness, thereby extending design flexibility to dynamic equipment anchoring. Smart capsules embedded with RFID (Radio-Frequency IDentification) tags enable inspectors to verify batch numbers and curing logs, supporting predictive maintenance and digital twin integration. These innovations extend resin leadership and raise the technical entry barrier for new entrants.

Note: Segment shares of all individual segments available upon report purchase
Get Detailed Market Forecasts at the Most Granular Levels
Download PDF
By End-Use Sector: Infrastructure Leadership Meets Residential Growth
Infrastructure projects accounted for 37.60% of the 2025 Anchors and Grouts Market size and are expected to expand at a 6.57% CAGR through 2031. Bridge deck expansions, metro stations, and hydropower dams require tens of thousands of anchor points, driving significant demand for bulk resin. Governments are increasingly adopting performance-based procurement that favors suppliers with Environmental Product Declarations (EPDs) and life-cycle assessments. Residential applications, though smaller in absolute volume, register the fastest 6.72% CAGR as homeowners in Europe and Japan retrofit energy-efficient façades and rooftop solar mounts. The Anchors and Grouts Market share of residential applications is expected to rise from 20.90% in 2025 to 23.10% by 2031.
Industrial facilities consistently require equipment pads and pipe-rack reinforcements. Pharmaceutical plants specify Anchors and Grouts due to vibration sensitivity and clean-room requirements. Commercial real estate retrofits utilize injectable anchors to upgrade double-skin façades without disrupting tenants. Together, these diversified end-uses mitigate cyclical risk and bolster revenue stability for anchor manufacturers.
Note: Segment shares of all individual segments available upon report purchase
Get Detailed Market Forecasts at the Most Granular Levels
Download PDF
Geography Analysis
Asia-Pacific’s 49.85% Anchors and Grouts Market share in 2025 underscores the region’s purchasing power and rapid urbanization. China’s 14th Five-Year Plan designates 102 digital-infrastructure clusters that standardize ETAG-approved anchors for data-center racks. India’s construction-chemical penetration sits under 50%, leaving runway for volume multiplication as contractor awareness grows. Australia enforces stringent AS 5216 anchor testing, encouraging the adoption of premium resin even in mid-rise residential projects. Southeast Asia’s coastal megacities are deploying corrosion-resistant anchors in elevated roadways to counteract saline fog.
Europe hosts a mature yet innovation-driven market. Germany records 99% chemical treatment in concrete anchors, demonstrating near-saturation but still requiring replacement cycles on aging autobahn bridges. The European Union Construction Products Regulation revision in 2024 expanded sustainability reporting, prompting suppliers to disclose global warming potential metrics for each cartridge. Scandinavian retrofit grants fund low-VOC formulations, while Italy’s Superbonus program extends seismic-retrofit tax credits through 2027, lifting anchor sales in historical masonry.
North America shows resilient growth amid labor shortages. The United States needs 439,000 additional construction workers, prompting greater use of pre-packaged cartridge systems that reduce installation time. Canada’s Trans Mountain pipeline expansion specifies high-bond epoxy anchors for pump-station equipment, and Mexico’s rail-freight upgrades demand fast-curing vinyl ester anchors that withstand high temperatures. Proximity to shale-based petrochemical feedstocks moderates resin costs for regional manufacturers, partially insulating them from global price swings.

Get Analysis on Important Geographic Markets
Download PDF
Competitive Landscape
The Anchors And Grouts Market is moderately consolidated.Market leaders pursue both horizontal and vertical integration to secure raw material supplies and expand their regional footprints. Technology differentiation centers on service-life certification and digital-jobsite support. Fischer offers cloud-based pull-test data logging that syncs with BIM models, shortening documentation cycles for structural engineers. Pricing strategies vary by region. In high-spec markets, suppliers bundle design software, field testing, and extended warranties to justify premiums. In emerging markets, tiered product lines allow budget options while preserving brand equity. The competitive equilibrium favors diversified portfolios and robust technical service networks that ensure correct installation.
Anchors And Grouts Industry Leaders
MAPEI S.p.A.
RPM International Inc.
Saint-Gobain
Sika AG
Ardex Group
- *Disclaimer: Major Players sorted in no particular order

Need More Details on Market Players and Competitors?
Download PDF
Recent Industry Developments
- April 2025: US Grout Incorporated, alongside its partner Avanti International, inaugurated a second production line at its Idaho facility. This new line will produce the Ultrafine VX and SD cementitious grouts.
- March 2025: Walplast, a manufacturer of construction material in India, launched Homesure TileEx Cementitious Tile Grout. With this polymer-modified cement-based grout, the company aims to provide a durable and aesthetically pleasing alternative for jointing tiles.
Global Anchors And Grouts Market Report Scope
Commercial, Industrial and Institutional, Infrastructure, Residential are covered as segments by End Use Sector. Cementitious Fixing, Resin Fixing are covered as segments by Sub Product. Asia-Pacific, Europe, Middle East and Africa, North America, South America are covered as segments by Region.By Product Type
| Cementitious Fixing | |
| Resin Fixing | Epoxy-based |
| Polyurethane-based | |
| Others |
By End-Use Sector
| Commercial |
| Industrial and Institutional |
| Infrastructure |
| Residential |
By Geography
| Asia-Pacific | Australia |
| China | |
| India | |
| Indonesia | |
| Japan | |
| Malaysia | |
| South Korea | |
| Thailand | |
| Vietnam | |
| Rest of Asia-Pacific | |
| North America | Canada |
| Mexico | |
| United States | |
| Europe | France |
| Germany | |
| Italy | |
| Russia | |
| Spain | |
| United Kingdom | |
| Rest of Europe | |
| South America | Argentina |
| Brazil | |
| Rest of South America | |
| Middle East and Africa | Saudi Arabia |
| United Arab Emirates | |
| Rest of Middle East and Africa |
| By Product Type | Cementitious Fixing | |
| Resin Fixing | Epoxy-based | |
| Polyurethane-based | ||
| Others | ||
| By End-Use Sector | Commercial | |
| Industrial and Institutional | ||
| Infrastructure | ||
| Residential | ||
| By Geography | Asia-Pacific | Australia |
| China | ||
| India | ||
| Indonesia | ||
| Japan | ||
| Malaysia | ||
| South Korea | ||
| Thailand | ||
| Vietnam | ||
| Rest of Asia-Pacific | ||
| North America | Canada | |
| Mexico | ||
| United States | ||
| Europe | France | |
| Germany | ||
| Italy | ||
| Russia | ||
| Spain | ||
| United Kingdom | ||
| Rest of Europe | ||
| South America | Argentina | |
| Brazil | ||
| Rest of South America | ||
| Middle East and Africa | Saudi Arabia | |
| United Arab Emirates | ||
| Rest of Middle East and Africa | ||
Need A Different Region or Segment?
Customize Now
Market Definition
- END-USE SECTOR - Anchors and grouts consumed in the construction sectors such as commercial, residential, industrial, institutional, and infrastructure are considered under the scope of the study.
- PRODUCT/APPLICATION - Under the scope of the study, the consumption of anchors and grouts such as cementitious fixing, resin fixing polyurethane, resin fixing epoxy, and other types are considered.
| Keyword | Definition |
|---|---|
| Accelerator | Accelerators are admixtures used to fasten the setting time of concrete by increasing the initial rate and speeding up the chemical reaction between cement and the mixing water. These are used to harden and increase the strength of concrete quickly. |
| Acrylic | This synthetic resin is a derivative of acrylic acid. It forms a smooth surface and is mainly used for various indoor applications. The material can also be used for outdoor applications with a special formulation. |
| Adhesives | Adhesives are bonding agents used to join materials by gluing. Adhesives can be used in construction for many applications, such as carpet laying, ceramic tiles, countertop lamination, etc. |
| Air Entraining Admixture | Air-entraining admixtures are used to improve the performance and durability of concrete. Once added, they create uniformly distributed small air bubbles to impart enhanced properties to the fresh and hardened concrete. |
| Alkyd | Alkyds are used in solvent-based paints such as construction and automotive paints, traffic paints, flooring resins, protective coatings for concrete, etc. Alkyd resins are formed by the reaction of an oil (fatty acid), a polyunsaturated alcohol (Polyol), and a polyunsaturated acid or anhydride. |
| Anchors and Grouts | Anchors and grouts are construction chemicals that stabilize and improve the strength and durability of foundations and structures like buildings, bridges, dams, etc. |
| Cementitious Fixing | Cementitious fixing is a process in which a cement-based grout is pumped under pressure to fill forms, voids, and cracks. It can be used in several settings, including bridges, marine applications, dams, and rock anchors. |
| Commercial Construction | Commercial construction comprises new construction of warehouses, malls, shops, offices, hotels, restaurants, cinemas, theatres, etc. |
| Concrete Admixtures | Concrete admixtures comprise water reducers, air entrainers, retarders, accelerators, superplasticizers, etc., added to concrete before or during mixing to modify its properties. |
| Concrete Protective Coatings | To provide specific protection, such as anti-carbonation or chemical resistance, a film-forming protective coat can be applied on the surface. Depending on the applications, different resins like epoxy, polyurethane, and acrylic can be used for concrete protective coatings. |
| Curing Compounds | Curing compounds are used to cure the surface of concrete structures, including columns, beams, slabs, and others. These curing compounds keep the moisture inside the concrete to give maximum strength and durability. |
| Epoxy | Epoxy is known for its strong adhesive qualities, making it a versatile product in many industries. It resists heat and chemical applications, making it an ideal product for anyone needing a stronghold under pressure. It is widely used in adhesives, electrical and electronics, paints, etc. |
| Fiber Wrapping Systems | Fiber Wrapping Systems are a part of construction repair and rehabilitation chemicals. It involves the strengthening of existing structures by wrapping structural members like beams and columns with glass or carbon fiber sheets. |
| Flooring Resins | Flooring resins are synthetic materials applied to floors to enhance their appearance, increase their resistance to wear and tear or provide protection from chemicals, moisture, and stains. Depending on the desired properties and the specific application, flooring resins are available in distinct types, such as epoxy, polyurethane, and acrylic. |
| High-Range Water Reducer (Super Plasticizer) | High-range water reducers are a type of concrete admixture that provides enhanced and improved properties when added to concrete. These are also called superplasticizers and are used to decrease the water-to-cement ratio in concrete. |
| Hot Melt Adhesives | Hot-melt adhesives are thermoplastic bonding materials applied as melts that achieve a solid state and resultant strength on cooling. They are commonly used for packaging, coatings, sanitary products, and tapes. |
| Industrial and Institutional Construction | Industrial and institutional construction includes new construction of hospitals, schools, manufacturing units, energy and power plants, etc. |
| Infrastructure Construction | Infrastructure construction includes new construction of railways, roads, seaways, airports, bridges, highways, etc. |
| Injection Grouting | The process of injecting grout into open joints, cracks, voids, or honeycombs in concrete or masonry structural members is known as injection grouting. It offers several benefits, such as strengthening a structure and preventing water infiltration. |
| Liquid-Applied Waterproofing Membranes | Liquid-Applied membrane is a monolithic, fully bonded, liquid-based coating suitable for many waterproofing applications. The coating cures to form a rubber-like elastomeric waterproof membrane and may be applied over many substrates, including asphalt, bitumen, and concrete. |
| Micro-concrete Mortars | Micro-concrete mortar is made up of cement, water-based resin, additives, mineral pigments, and polymers and can be applied on both horizontal and vertical surfaces. It can be used to refurbish residential complexes, commercial spaces, etc. |
| Modified Mortars | Modified Mortars include Portland cement and sand along with latex/polymer additives. The additives increase adhesion, strength, and shock resistance while also reducing water absorption. |
| Mold Release Agents | Mold release agents are sprayed or coated on the surface of molds to prevent a substrate from bonding to a molding surface. Several types of mold release agents, including silicone, lubricant, wax, fluorocarbons, and others, are used based on the type of substrates, including metals, steel, wood, rubber, plastic, and others. |
| Polyaspartic | Polyaspartic is a subset of polyurea. Polyaspartic floor coatings are typically two-part systems that consist of a resin and a catalyst to ease the curing process. It offers high durability and can withstand harsh environments. |
| Polyurethane | Polyurethane is a plastic material that exists in various forms. It can be tailored to be either rigid or flexible and is the material of choice for a broad range of end-user applications, such as adhesives, coatings, building insulation, etc. |
| Reactive Adhesives | A reactive adhesive is made of monomers that react in the adhesive curing process and do not evaporate from the film during use. Instead, these volatile components become chemically incorporated into the adhesive. |
| Rebar Protectors | In concrete structures, rebar is one of the important components, and its deterioration due to corrosion is a major issue that affects the safety, durability, and life span of buildings and structures. For this reason, rebar protectors are used to protect against degrading effects, especially in infrastructure and industrial construction. |
| Repair and Rehabilitation Chemicals | Repair and Rehabilitation Chemicals include repair mortars, injection grouting materials, fiber wrapping systems, micro-concrete mortars, etc., used to repair and restore existing buildings and structures. |
| Residential Construction | Residential construction involves constructing new houses or spaces like condominiums, villas, and landed homes. |
| Resin Fixing | The process of using resins like epoxy and polyurethane for grouting applications is called resin fixing. Resin fixing offers several advantages, such as high compressive and tensile strength, negligible shrinkage, and greater chemical resistance compared to cementitious fixing. |
| Retarder | Retarders are admixtures used to slow down the setting time of concrete. These are usually added with a dosage rate of around 0.2% -0.6% by weight of cement. These admixtures slow down hydration or lower the rate at which water penetrates the cement particles by making concrete workable for a long time. |
| Sealants | A sealant is a viscous material that has little or no flow qualities, which causes it to remain on surfaces where they are applied. Sealants can also be thinner, enabling penetration to a certain substance through capillary action. |
| Sheet Waterproofing Membranes | Sheet membrane systems are reliable and durable thermoplastic waterproofing solutions that are used for waterproofing applications even in the most demanding below-ground structures, including those exposed to highly aggressive ground conditions and stress. |
| Shrinkage Reducing Admixture | Shrinkage-reducing admixtures are used to reduce concrete shrinkage, whether from drying or self-desiccation. |
| Silicone | Silicone is a polymer that contains silicon combined with carbon, hydrogen, oxygen, and, in some cases, other elements. It is an inert synthetic compound that comes in various forms, such as oil, rubber, and resin. Due to its heat-resistant properties, it finds applications in sealants, adhesives, lubricants, etc. |
| Solvent-borne Adhesives | Solvent-borne adhesives are mixtures of solvents and thermoplastic or slightly cross-linked polymers such as polychloroprene, polyurethane, acrylic, silicone, and natural and synthetic rubbers. |
| Surface Treatment Chemicals | Surface treatment chemicals are chemicals used to treat concrete surfaces, including roofs, vertical surfaces, and others. They act as curing compounds, demolding agents, rust removers, and others. They are cost-effective and can be used on roadways, pavements, parking lots, and others. |
| Viscosity Modifier | Viscosity Modifiers are concrete admixtures used to change various properties of admixtures, including viscosity, workability, cohesiveness, and others. These are usually added with a dosage of around 0.01% to 0.1% by weight of cement. |
| Water Reducer | Water reducers, also called plasticizers, are a type of admixture used to decrease the water-to-cement ratio in the concrete, thereby increasing the durability and strength of concrete. Various water reducers include refined lignosulfonates, gluconates, hydroxycarboxylic acids, sugar acids, and others. |
| Water-borne Adhesives | Water-borne adhesives use water as a carrier or diluting medium to disperse resin. They are set by allowing the water to evaporate or be absorbed by the substrate. These adhesives are compounded with water as a dilutant rather than a volatile organic solvent. |
| Waterproofing Chemicals | Waterproofing chemicals are designed to protect a surface from the perils of leakage. A waterproofing chemical is a protective coating or primer applied to a structure's roof, retaining walls, or basement. |
| Waterproofing Membranes | Waterproofing membranes are liquid-applied or self-adhering layers of water-tight materials that prevent water from penetrating or damaging a structure when applied to roofs, walls, foundations, basements, bathrooms, and other areas exposed to moisture or water. |
Need More Details on Market Definition?
Ask a Question
Research Methodology
Mordor Intelligence follows a four-step methodology in all our reports.
- Step-1: Identify Key Variables: The quantifiable key variables (industry and extraneous) pertaining to the specific product segment and country are selected from a group of relevant variables & factors based on desk research & literature review; along with primary expert inputs. These variables are further confirmed through regression modeling (wherever required).
- Step-2: Build a Market Model: In order to build a robust forecasting methodology, the variables and factors identified in Step-1 are tested against available historical market numbers. Through an iterative process, the variables required for market forecast are set and the model is built on the basis of these variables.
- Step-3: Validate and Finalize: In this important step, all market numbers, variables and analyst calls are validated through an extensive network of primary research experts from the market studied. The respondents are selected across levels and functions to generate a holistic picture of the market studied.
- Step-4: Research Outputs: Syndicated Reports, Custom Consulting Assignments, Databases & Subscription Platforms

Get More Details On Research Methodology
Download PDF


