Market Overview
| Study Period | 2021 - 2031 |
|---|---|
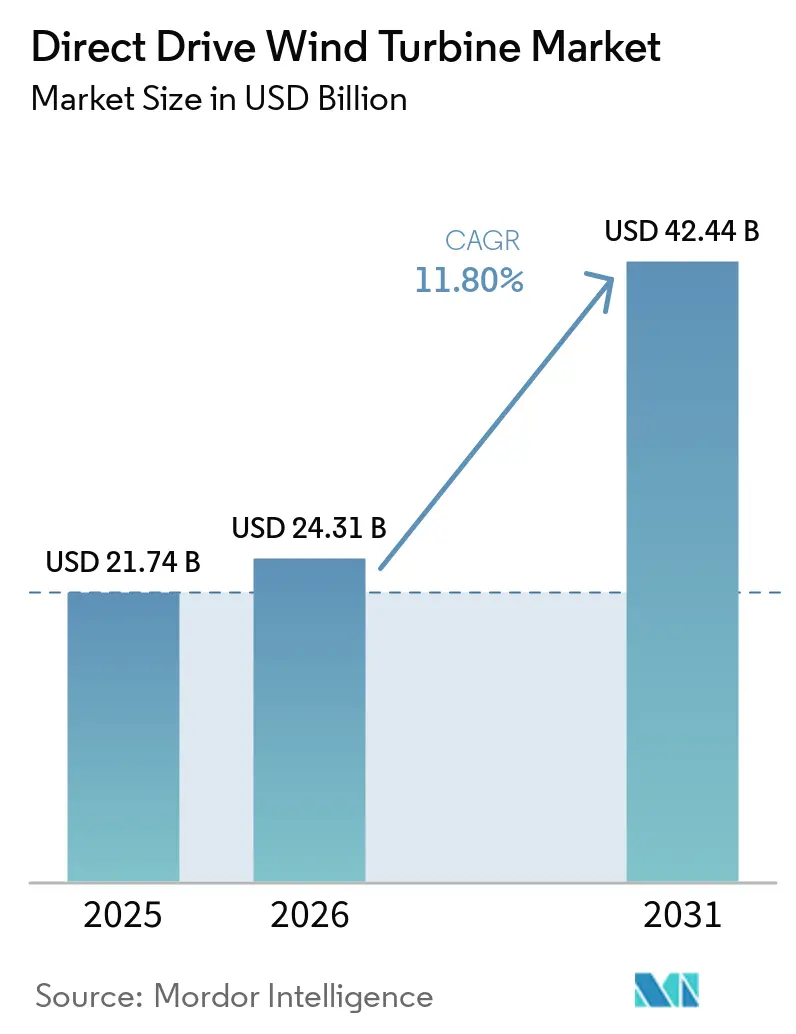
| Market Size (2026) | USD 24.31 Billion |
| Market Size (2031) | USD 42.44 Billion |
| Growth Rate (2026 - 2031) | 11.80% CAGR |
| Fastest Growing Market | Asia Pacific |
| Largest Market | Asia Pacific |
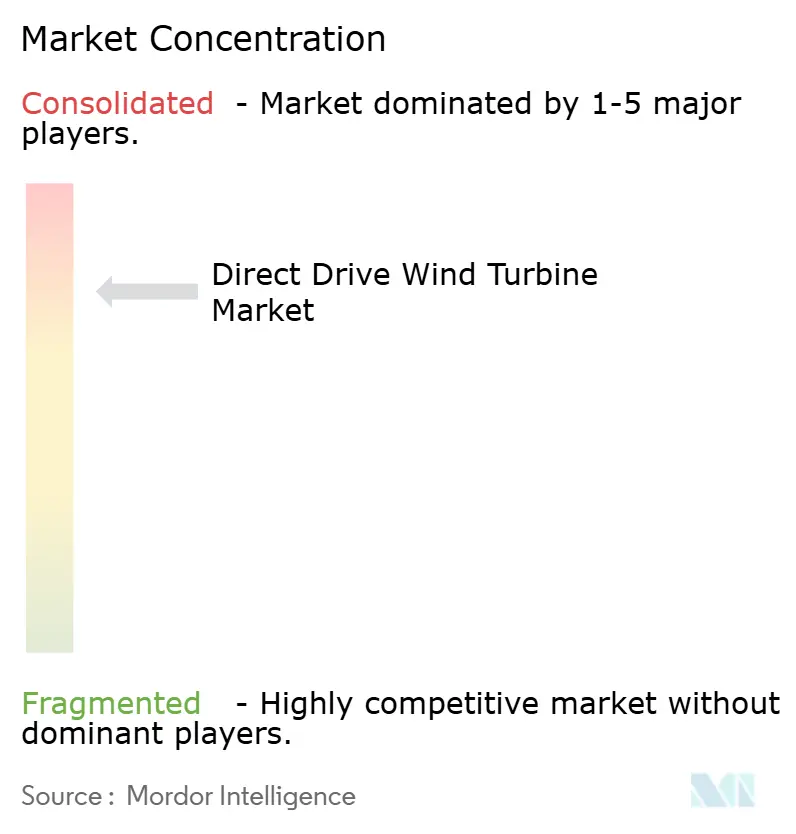
| Market Concentration | High |
Major Players *Disclaimer: Major Players sorted in no particular order Image © Mordor Intelligence. Reuse requires attribution under CC BY 4.0. | |
Direct Drive Wind Turbine Market Analysis by Mordor Intelligence
The Direct Drive Wind Turbine Market size in 2026 is estimated at USD 24.31 billion, growing from 2025 value of USD 21.74 billion with 2031 projections showing USD 42.44 billion, growing at 11.80% CAGR over 2026-2031.
The current market size reflects the rapid adoption of gearbox-free drivetrains, which enhance reliability and reduce maintenance costs. System demand accelerates as offshore build-outs move into deeper waters, where direct drive technology offers clear durability gains. The Asia-Pacific’s manufacturing clout, robust project pipelines, and supportive policy frameworks underpin nearly half of global revenue, while floating offshore solutions emerge as the fastest-expanding installation type. Permanent-magnet synchronous generators maintain an overwhelming dominance despite supply risks associated with rare-earth inputs. Competitive intensity centers on scaling turbines beyond 15 MW, with OEMs balancing certification hurdles against cost-of-energy advantages.
Key Report Takeaways
- By power rating, the 3 MW–8 MW category captured 43.25% of the direct drive wind turbine market share in 2025, whereas the Above 15 MW class is projected to expand at a 21.96% CAGR through 2031.
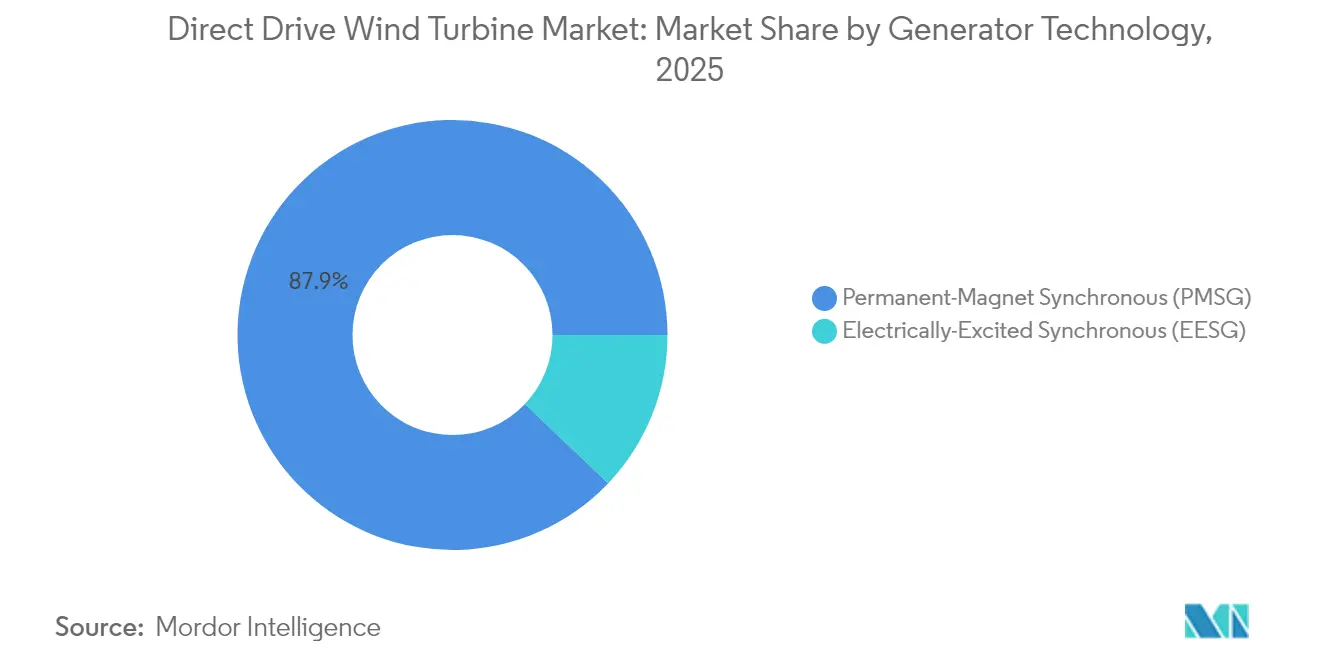
- By generator technology, permanent-magnet synchronous generators accounted for an 87.90% share of the direct drive wind turbine market size in 2025; electrically excited alternatives trail far behind.
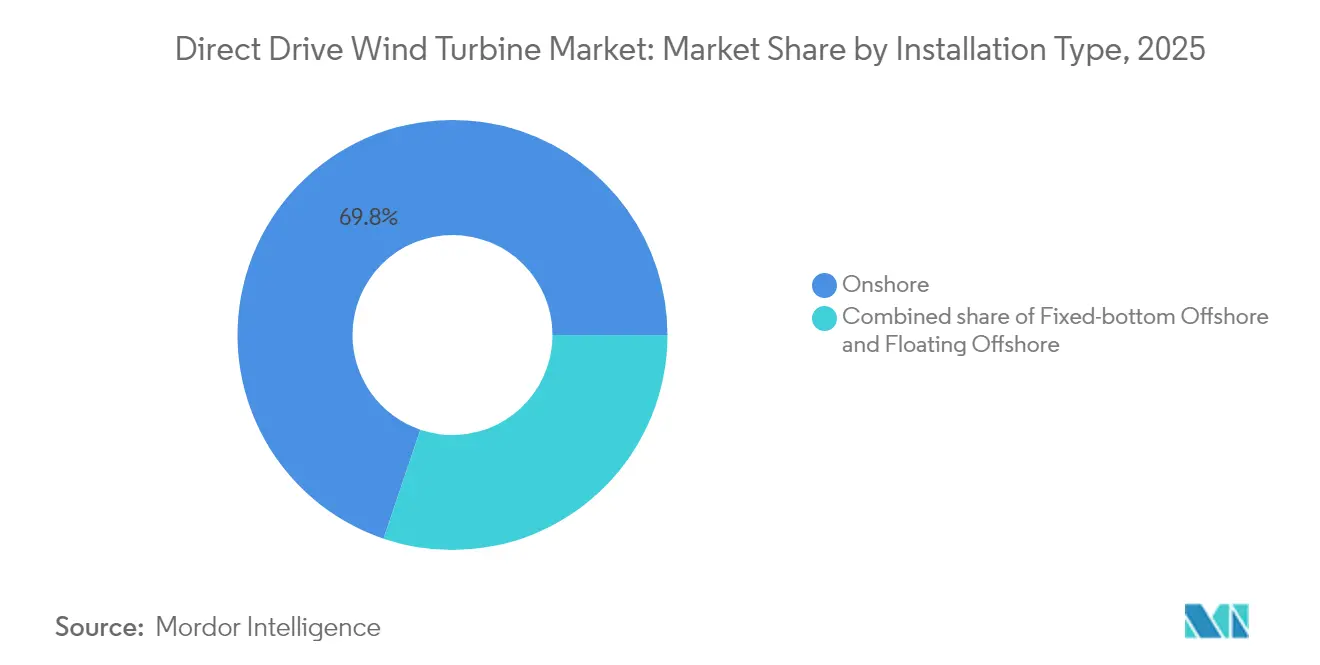
- By installation type, onshore sites commanded a 69.80% revenue share in 2025, while floating offshore sites are advancing at a 33.18% CAGR to 2031.
- By application, utility-scale wind farms accounted for 91.60% of the direct-drive wind turbine market size in 2025 and are expected to continue growing at a 12.08% CAGR through 2031.
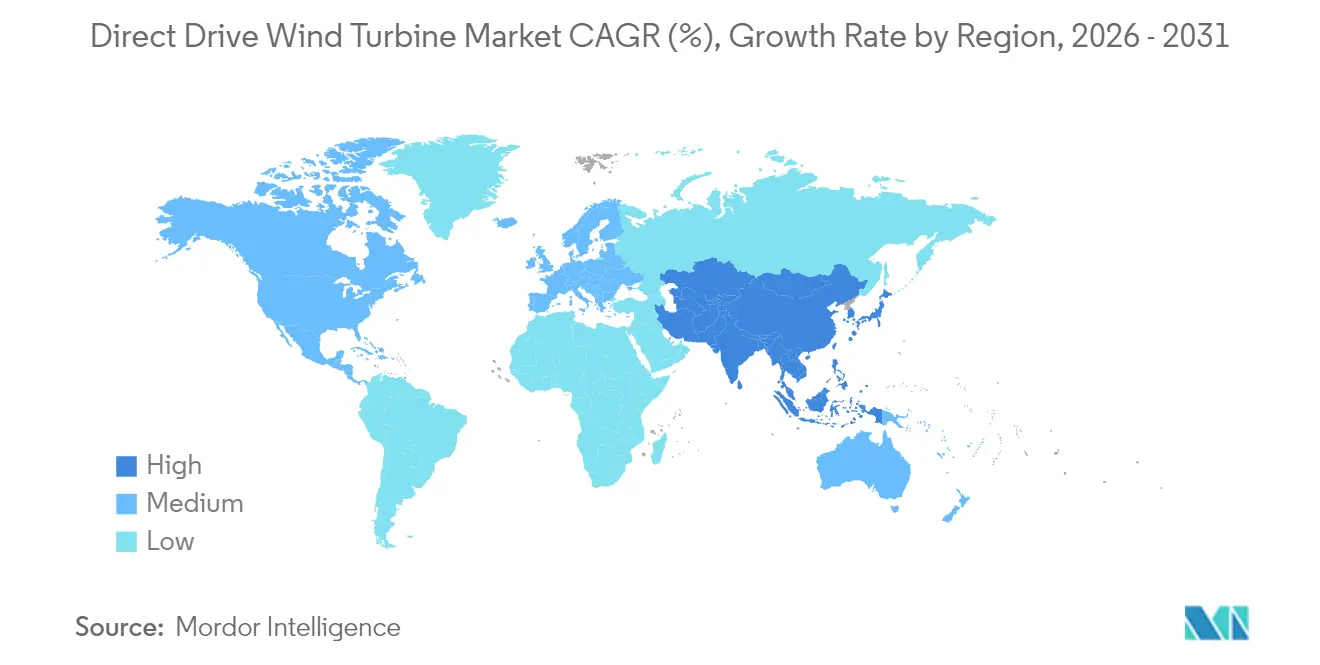
- By region, the Asia-Pacific led with a 48.90% market share in 2025; Europe is expected to record the highest forecast CAGR of 13.05% from 2025 to 2031.
Note: Market size and forecast figures in this report are generated using Mordor Intelligence’s proprietary estimation framework, updated with the latest available data and insights as of 2026.
Global Direct Drive Wind Turbine Market Trends and Insights
Drivers Impact Analysis*
| Driver | (~) % Impact on CAGR Forecast | Geographic Relevance | Impact Timeline |
|---|---|---|---|
| Declining Levelized Cost of Electricity (LCOE) for ≥4 MW DD turbines | 2.80% | Global, with strongest impact in offshore markets | Medium term (2-4 years) |
| Rapid offshore wind build-out targets in EU, UK & China | 3.20% | Europe, UK, China, with spillover to Asia-Pacific | Long term (≥ 4 years) |
| Rising OEM preference for simplified drivetrains (gearbox-free) | 2.10% | Global, particularly in new installations | Short term (≤ 2 years) |
| Rare-earth magnet recycling breakthroughs lowering NdFeB input cost | 1.40% | Global, with early gains in EU and North America | Medium term (2-4 years) |
| Grid-forming inverter capability demand for high-penetration renewables | 1.80% | APAC core, spillover to Europe and North America | Long term (≥ 4 years) |
| Source: Mordor Intelligence | |||
Declining Levelized Cost of Electricity (LCOE) for ≥4 MW Direct Drive Turbines
Wind LCOE averaged USD 0.033/kWh in 2024, a 70% fall since 2010, with gearbox-free designs removing major maintenance cost centers. Offshore projects gain the most because remote servicing of gearboxes is expensive and logistically complex. Larger nacelles lower cost per MW even as generator mass rises, reinforcing a virtuous cycle where scale reduces unit pricing. Floating platforms amplify these savings because simplified drivetrains cut service visits under harsh marine conditions. As utilities routinely specify turbines exceeding 4 MW, the direct-drive wind turbine market gains structural cost leadership.
Rapid Offshore Wind Build-Out Targets in EU, UK & China
EU legislation aims for 60 GW of offshore capacity by 2030 and 300 GW by 2050, while China and the UK have similarly ambitious roadmaps. Combined pipelines exceed 400 GW, incentivising OEMs to push direct drive ratings beyond 15 MW to maximise energy capture. Floating offshore prospects swell from 270 MW in 2024 to a 244 GW pipeline, expanding deep-water potential that favours gearbox-free systems. Clear policy visibility unlocks capital for new factories and multi-GW frame agreements.
Rising OEM Preference for Simplified Drivetrains (Gearbox-Free)
Gearboxes remain the chief failure point in conventional turbines; eliminating them slices unplanned service costs that can exceed USD 100,000 per offshore event.[1]University of Wollongong, “Cost Implications of Turbine Gearbox Failures,” uow.edu.auEnercon’s two-decade commitment demonstrates maturity, while major OEMs now market direct drive across a wider power band. The trend strengthens as service contracts migrate toward performance-based guarantees, rewarding lower mechanical complexity. Manufacturing process optimisation in permanent magnet assembly further narrows any cost premium over geared designs.
Rare-Earth Magnet Recycling Breakthroughs Lowering NdFeB Input Cost
Recycling can reduce magnet-related emissions by up to 95% and decrease material spending by 20-30% by 2030.[2]Wiley, “Closed-Loop Recycling of NdFeB Magnets,” onlinelibrary.wiley.comEU mandates on recycled content accelerate plant build-outs, easing dependence on primary Chinese supply. Functional testing shows recycled magnets meet performance parity, removing technical resistance. Parallel R&D on iron-nitride compositions could eventually eliminate the need for rare-earth elements.[3]MIT Technology Review, “Iron-Nitride Magnets Could Break Rare-Earth Dependency,” technologyreview.com
Restraints Impact Analysis*
| Restraint | (~) % Impact on CAGR Forecast | Geographic Relevance | Impact Timeline |
|---|---|---|---|
| Heavy nacelle mass increases logistics costs for onshore sites | -1.80% | Global, particularly in emerging markets with limited infrastructure | Short term (≤ 2 years) |
| Limited global rare-earth mining & refining capacity | -2.30% | Global, with strongest impact in non-Chinese supply chains | Medium term (2-4 years) |
| Slow certification cycles for ≥15MW next-gen DD prototypes | -1.10% | Global, with particular impact on offshore markets | Long term (≥ 4 years) |
| Source: Mordor Intelligence | |||
Heavy Nacelle Mass Increases Logistics Costs for Onshore Sites
A 10 MW direct-drive generator weighs around 300 t, which significantly increases tower steel and transport costs; tower components already account for 26% of turbine costs. Route constraints mean up to 11 over-dimensioned truckloads per 2 MW turbine and crane hire that can add USD 100,000 per unit. OEMs pursue modular generators and onsite assembly, though these raise field-quality risks.
Limited Global Rare-Earth Mining & Refining Capacity
China accounts for 70% of supply; demand for dysprosium and neodymium could surge 2,600% by 2050.[4]Deutsche Bank Research, “Rare-Earth Supply Outlook,” db.com Shortages can lift turbine prices 15-25%, eroding the LCOE advantage. Western processing projects take up to a decade, leaving near-term exposure. Some OEMs hedge with electrically excited machines that avoid magnets, but at the cost of lower efficiency.
*Our forecasts treat driver/restraint impacts as directional, not additive. The impact forecasts reflect baseline growth, mix effects, and variable interactions.
Segment Analysis
By Power Rating: Scaling Drives Offshore Dominance
The direct drive wind turbine market size for the 3 MW–8 MW band was the highest in 2025, accounting for 43.25% of the revenue, driven by widespread onshore adoption where logistics remain manageable. Above 15 MW machines, however, promise the steepest upside with a 21.96% CAGR, leveraged by fixed-bottom and floating offshore projects that reward higher capacity factors.
Falling capital expenditure per installed megawatt motivates developers to order ever-larger turbines, while certification delays act as a gating factor. Vestas’ V236-15.0 MW model alone secured 7 GW of firm commitments, illustrating early confidence in ultra-large nacelles. Yet transportation and crane capability in near-shore yards remain barriers for rapid volume scale-up.


By Generator Technology: PMSG Maintains Technological Leadership
Permanent-magnet synchronous units owned 87.90% of the direct drive wind turbine market in 2025, rising on a 12.45% CAGR through 2031 as efficiency and low maintenance trump magnet cost worries. Rotor winding losses are absent, enabling higher energy yield and easier compliance with evolving grid codes. Electrically excited machines occupy a shrinking niche, primarily used where magnet supply security outweighs energy efficiency.
Recycling advances and alternative compounds gradually lessen PMSG cost headwinds, potentially extending dominance. EESG vendors emphasise design flexibility and magnet-free supply chains, but added maintenance complexity and lower output limit uptake. Superconducting research could disrupt both camps long term, yet commercial traction appears unlikely before 2030.
By Installation Type: Floating Offshore Emerges as Growth Engine
Onshore projects still held a 69.80% market share in 2025 but recorded the slowest growth as mature land sites became saturated. Fixed-bottom offshore remains sizeable, yet floating offshore installations post a 33.18% CAGR thanks to their ability to tap deeper, high-resource zones beyond the continental shelf.
Deep-water assets face harsher loads, making gearbox-free architectures attractive despite higher nacelle weight. Grid-forming requirements in isolated island grids add further tailwinds. Classification society approvals of new floating foundations signal an accelerating take-up, and direct-drive OEMs are increasingly designing turbines specifically for this environment.
By Application: Utility-Scale Dominance Reinforces Market Concentration
Utility-scale wind farms generated 91.60% of 2025 revenue and are forecasted to grow at a 12.08% CAGR, reflecting robust procurement from IPPs and state utilities that prefer streamlined O&M contracts across multi-gigawatt portfolios. Direct drive technology scales well under performance-based remuneration, encouraging developers to bundle long-term service agreements.
Distributed systems under 5 MW remain a niche market, benefiting from simpler maintenance in remote communities. Government incentive schemes, such as U.S. awards for rural microgrids, help maintain steady demand but cannot match the volume surge seen in utility projects.
Geography Analysis
Asia-Pacific recorded 48.90% of global revenue in 2025 and is projected to expand at a 12.62% CAGR through 2031. China’s large-scale offshore roll-out and domestic supply chain integration underpin regional cost advantages of 20-30% over Western peers. Policy clarity supports factory investments, including Goldwind’s new Brazilian plant that extends pricing leverage into Latin America.
Europe ranks second yet leads technology deployment in floating offshore and grid-forming applications. EU targets, along with local content mandates, drive new capacity announcements, such as the 1 GW Inch Cape project equipped with V236-15.0 MW turbines. OEM factory expansions in Poland, the UK, and Denmark highlight sustained demand.
North America gains momentum through the U.S. Inflation Reduction Act, spurring domestic component sourcing. GE Vernova’s repower contracts, topping 1 GW, mirror the rising procurement of direct-drive nacelles made in-country. Meanwhile, Middle East sovereign funds and Latin American developers are turning to Chinese OEM partnerships to fast-track local capacity, thereby adding geographic diversity to future sales.

Competitive Landscape
The Direct Drive Wind Turbine Market is highly concentrated. Vestas, Siemens Gamesa, and GE Vernova focus on premium offshore and service-heavy offerings, whereas Goldwind and Envision Energy press pricing advantages and aggressive overseas expansion. Chinese OEMs now secure rising European and American orders, intensifying price competition.
Technical differentiation hinges on inverter sophistication, modular generator architecture, and the resilience of magnet supply. Oak Ridge National Laboratory's prototypes of segmented PM generators show promise for fault-tolerant designs that could cut downtime by permitting continued operation of healthy modules. Patent filings on rare-earth recycling and iron-nitride magnets are on the rise, underscoring supply-chain risk mitigation as a strategic battleground.
Vertical integration grows as firms move magnet production, blade moulding, and tower fabrication in-house to stabilise cost and logistics. Floating offshore and grid-forming niches raise entry barriers, favouring incumbents with deep engineering and project-financing capabilities.
Direct Drive Wind Turbine Industry Leaders
Goldwind Science & Technology
Siemens Gamesa Renewable Energy
Vestas Wind Systems
GE Vernova
Ming Yang Smart Energy
- *Disclaimer: Major Players sorted in no particular order

Recent Industry Developments
- July 2025: Vestas secured a 384 MW order for phase II of Ukraine’s Tyligulska wind project, deploying 83 V162-6.2 MW turbines and a 20-year service pact.
- March 2025: GE Vernova booked repower deals exceeding 1 GW for U.S. fleets, with domestic nacelle production supporting job creation.
- March 2025: Vestas received conditional orders totaling 1,100 MW for Scotland’s Inch Cape offshore farm alongside 719 MW in continental Europe.
- January 2025: Siemens Gamesa commenced 14 MW nacelle production at its expanded facility in Taichung, Taiwan, for the 1,022 MW Hai Long project.


Global Direct Drive Wind Turbine Market Report Scope
The scope of the direct drive wind turbine market includes:
By Power Rating
| Up to 3 MW |
| 3 MW to 8 MW |
| 8 MW to 15 MW |
| Above 15 MW |
By Generator Technology
| Permanent-Magnet Synchronous (PMSG) |
| Electrically-Excited Synchronous (EESG) |
By Installation Type
| Onshore |
| Fixed-bottom Offshore |
| Floating Offshore |
By Application
| Utility-Scale Wind Farms |
| Distributed (Below 5 MW) |
By Geography
| North America | United States |
| Canada | |
| Mexico | |
| Europe | Germany |
| United Kingdom | |
| France | |
| Spain | |
| Sweden | |
| Finland | |
| Turkey | |
| Rest of Europe | |
| Asia Pacific | China |
| India | |
| Japan | |
| South Korea | |
| Australia | |
| Vietnam | |
| Rest of Asia Pacific | |
| South America | Brazil |
| Argentina | |
| Chile | |
| Rest of South America | |
| Middle East and Africa | Saudi Arabia |
| Kenya | |
| South Africa | |
| Morocco | |
| Rest of Middle East and Africa |
| By Power Rating | Up to 3 MW | |
| 3 MW to 8 MW | ||
| 8 MW to 15 MW | ||
| Above 15 MW | ||
| By Generator Technology | Permanent-Magnet Synchronous (PMSG) | |
| Electrically-Excited Synchronous (EESG) | ||
| By Installation Type | Onshore | |
| Fixed-bottom Offshore | ||
| Floating Offshore | ||
| By Application | Utility-Scale Wind Farms | |
| Distributed (Below 5 MW) | ||
| By Geography | North America | United States |
| Canada | ||
| Mexico | ||
| Europe | Germany | |
| United Kingdom | ||
| France | ||
| Spain | ||
| Sweden | ||
| Finland | ||
| Turkey | ||
| Rest of Europe | ||
| Asia Pacific | China | |
| India | ||
| Japan | ||
| South Korea | ||
| Australia | ||
| Vietnam | ||
| Rest of Asia Pacific | ||
| South America | Brazil | |
| Argentina | ||
| Chile | ||
| Rest of South America | ||
| Middle East and Africa | Saudi Arabia | |
| Kenya | ||
| South Africa | ||
| Morocco | ||
| Rest of Middle East and Africa | ||


Key Questions Answered in the Report
What is the current size of the direct drive wind turbine market?
The market reached USD 24.31 billion in 2026 and is projected to hit USD 42.44 billion by 2031 at an 11.80% CAGR.
Which region dominates the direct drive wind turbine market?
Asia-Pacific holds 48.90% of 2025 revenue, driven by China’s large manufacturing base and aggressive offshore targets.
Why are permanent-magnet synchronous generators preferred in direct drive turbines?
PMSGs eliminate rotor winding losses, raise efficiency and cut maintenance, helping them secure an 87.90% market share in 2025 despite rare-earth supply concerns.
What are the main risks facing direct drive turbine manufacturers?
Key risks include heavy nacelle logistics for onshore transport, rare-earth material supply constraints and lengthy certification cycles for turbines above 15 MW.
How fast is the floating offshore segment growing?
Floating offshore installations are forecast to grow at a 33.18% CAGR between 2026 and 2031 owing to access to deep-water wind resources.
Page last updated on:


