
Bio-Based Succinic Acid Market Size and Share
Market Overview
| Study Period | 2021 - 2031 |
|---|---|
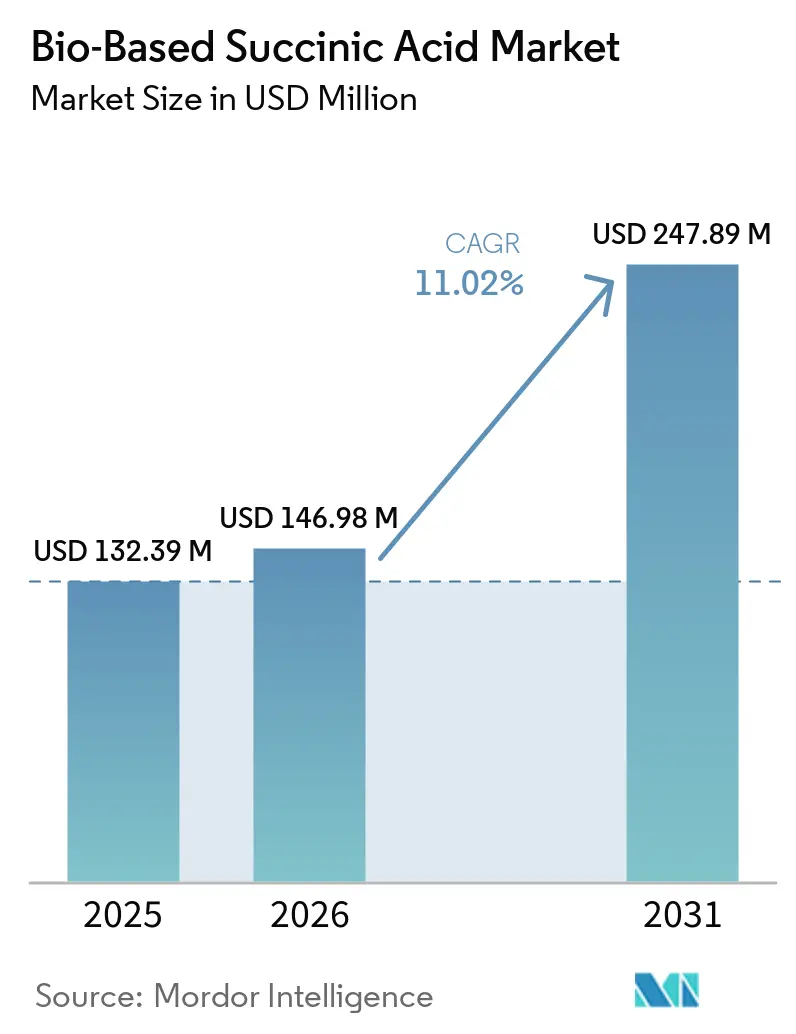
| Market Size (2026) | USD 146.98 Million |
| Market Size (2031) | USD 247.89 Million |
| Growth Rate (2026 - 2031) | 11.02 % |
| Fastest Growing Market | Asia Pacific |
| Largest Market | Asia Pacific |
| Market Concentration | Medium |
Major Players *Disclaimer: Major Players sorted in no particular order Image © Mordor Intelligence. Reuse requires attribution under CC BY 4.0. | |
Bio-Based Succinic Acid Market Analysis by Mordor Intelligence
The Bio-Based Succinic Acid Market size was valued at USD 132.39 million in 2025 and is estimated to grow from USD 146.98 million in 2026 to reach USD 247.89 million by 2031, at a CAGR of 11.02% during the forecast period (2026–2031). The bio-based succinic acid market has entered a measured maturation phase in which incremental fermentation efficiencies, diversified feedstock options, and expanding downstream uses keep demand advancing even though price gaps versus petro-routes persist. Industrial polymer makers remain the anchor buyers because polybutylene succinate (PBS) and polyurethane chains incorporate high volumes of the molecule, while personal-care and pharmaceutical formulators are scaling adoption to capture its multifunctional antimicrobial and pH-buffer benefits. Regional expansion is tied closely to policy: Asia-Pacific accelerates on the back of China’s biomanufacturing investments and Japan’s decarbonization roadmap, whereas Europe’s growth stems from carbon-pricing schemes that reward low-footprint intermediates. Competitive intensity stays elevated because no producer yet controls a decisive cost advantage, prompting scale-up collaborations, feedstock hedging, and rigorous certification campaigns to validate sustainability claims.
Key Report Takeaways
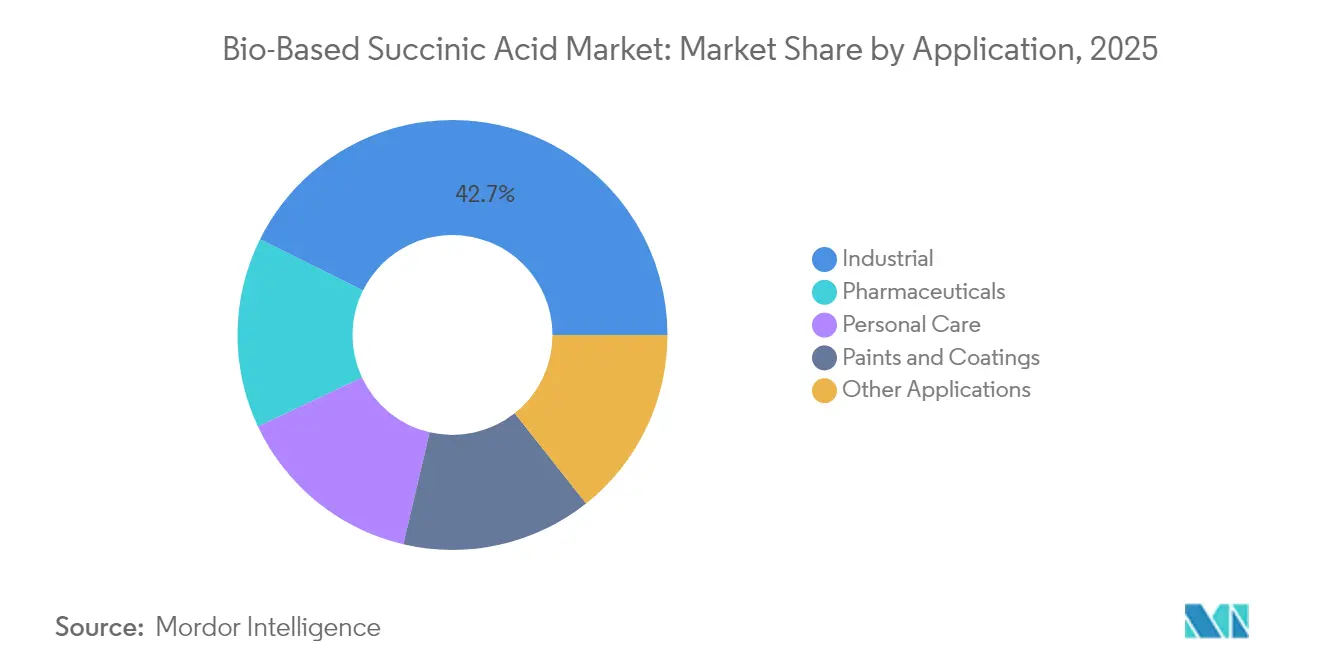
- By application, industrial polymers held 42.65% of the bio-based succinic acid market share in 2025, while personal care is projected to advance at a 11.73% CAGR through 2031.
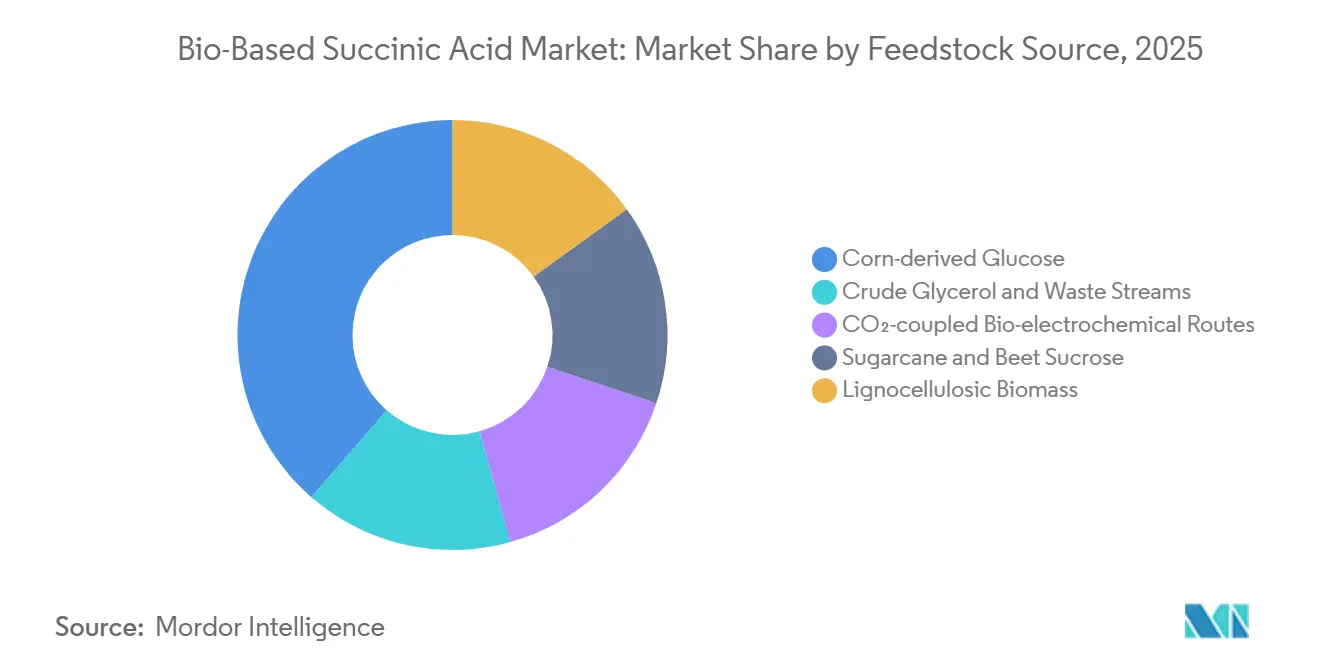
- By feedstock, corn-derived glucose accounted for 38.60% of the bio-based succinic acid market size in 2025; glycerol and waste streams are forecast to rise at a 12.03% CAGR during 2026-2031.
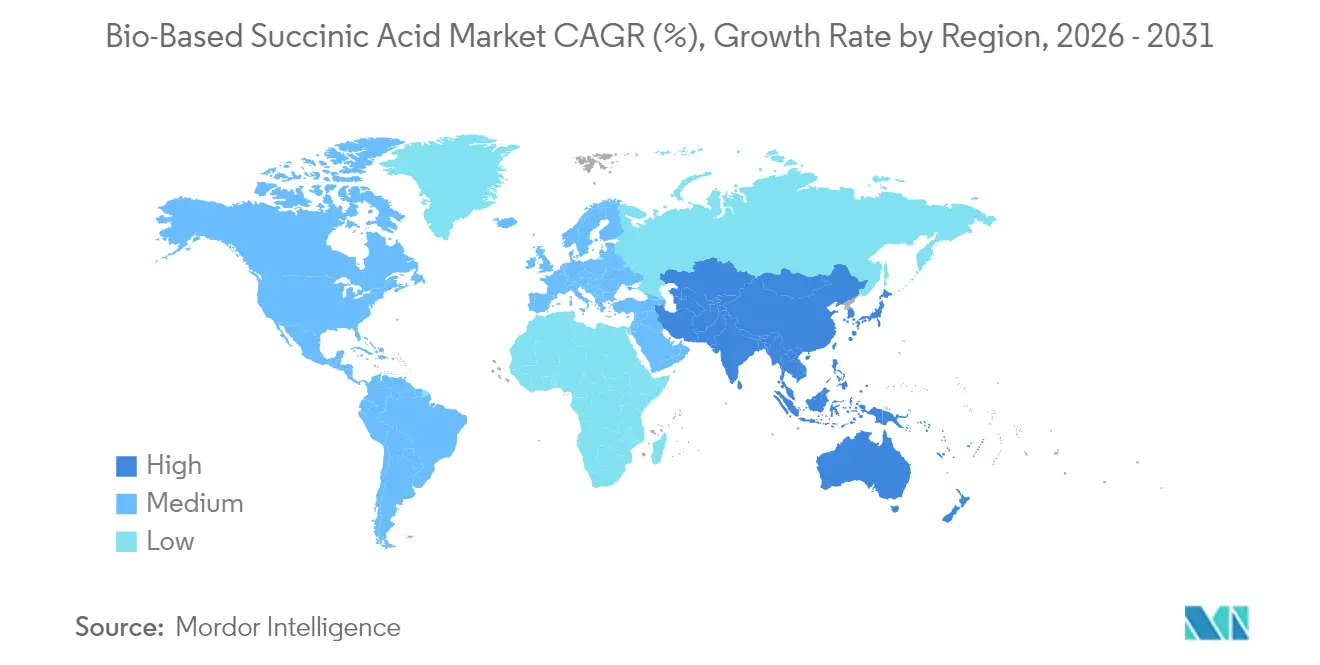
- By geography, Asia-Pacific commanded 33.05% revenue share of the bio-based succinic acid market in 2025 and is expected to expand at a 12.66% CAGR to 2031.
Note: Market size and forecast figures in this report are generated using Mordor Intelligence’s proprietary estimation framework, updated with the latest available data and insights as of 2026.
Global Bio-Based Succinic Acid Market Trends and Insights
Drivers Impact Analysis*
| Driver | (~) % Impact on CAGR Forecast | Geographic Relevance | Impact Timeline |
|---|---|---|---|
| Increasing adoption of green chemicals in industrial polymers | +0.80% | North America, EU, Asia-Pacific | Medium term (2-4 years) |
| Volatility in crude-oil prices prompting switch to bio-routes | +0.60% | Global with Asia-Pacific manufacturing hubs | Short term (≤ 2 years) |
| Government incentives & carbon-pricing regulations | +0.50% | EU, California, UK and emerging APAC schemes | Long term (≥ 4 years) |
| Engineered micro-organisms slashing downstream costs | +0.40% | R&D centers in North America & Europe, global licensing | Medium term (2-4 years) |
| Circular-economy sourcing mandates from brand owners | +0.30% | North America & EU consumer goods sectors | Long term (≥ 4 years) |
| Source: Mordor Intelligence | |||
Increasing Adoption of Green Chemicals in Industrial Polymers
Manufacturers of engineering plastics, thermoset resins, and elastomers continue to swap fossil building blocks for certified bio-alternatives. BASF secured ISCC+ certification for more than 60 portfolio products and introduced a bio-based ethyl acrylate featuring 40% renewable content that cuts cradle-to-gate emissions by 30%. Parallel initiatives in polyurethane chains rely on bio-1,4-butanediol derived directly from succinic acid fermentations, a pathway pioneered by Genomatica and scaled further through technology licensing to Chinese producers. Because PBS resin is already synthesized from succinic acid and 1,4-butanediol, every incremental gain in succinate output ripples through packaging, mulch film, and single-use appliance parts. As brand owners escalate scope-3 decarbonization targets, procurement teams favor suppliers able to document greenhouse-gas savings, reinforcing the pull on the bio-based succinic acid market toward high-volume polymer applications.
Volatility in Crude-Oil Prices Prompting Switch to Bio-Routes
Oil-price swings above the USD 80 per-barrel threshold regularly erode the cost advantage enjoyed by petrochemical succinic acid, nudging converters to lock in offtake agreements for bio-routes that insulate them from feedstock shocks. The European Commission’s industrial carbon-management plan complements this economic push by aligning capital grants and tax credits with projects that displace fossil intermediates. Japanese majors Mitsubishi Chemical, Mitsui Chemicals, and Asahi Kasei have responded by trialing biomass naphtha in naphtha crackers to derisk volatility while meeting national net-zero pledges. Although low oil phases can stall momentum temporarily, purchasing departments increasingly model total-cost-of-ownership scenarios that assign probability-weighted oil trajectories, keeping a strategic wedge for the bio-based succinic acid market even under bearish crude forecasts.
Government Incentives & Carbon-Pricing Regulations
Policy levers intensify the structural advantage of low-carbon intermediates. California revised its Low Carbon Fuel Standard to mandate a 30% carbon-intensity cut by 2030, which spills over into chemical-intermediate credits because many fermentation plants co-process feedstocks for fuels and chemicals[1]California Air Resources Board, “Low Carbon Fuel Standard amendments,” arb.ca.gov . The United Kingdom’s Greenhouse Gas Removals and Power BECCS business models guarantee revenue streams for facilities that combine bio-energy with carbon capture, directly benefiting fermentation sites that can sequester biogenic CO₂[2]Government of the United Kingdom, “Power BECCS business model consultation,” gov.uk . Across the Atlantic, Canada and several U.S. states are drafting clean-fuel regulations modeled on the Californian template, creating a mosaic of incentives that producers can stack. These mechanisms compress payback periods, making upgrades to larger fermenters and energy-efficient downstream separators financially compelling for producers in the bio-based succinic acid market.
Engineered Micro-Organisms Slashing Downstream Costs
Synthetic-biology advances are boosting product titers and simplifying purification trains. Engineered Yarrowia lipolytica strains have delivered 112.54 g/L succinic acid concentrations by enhancing tolerance to acidic environments and optimizing glucose transport channels, cutting neutralization reagent use in downstream stages. Parallel research on Cupriavidus necator integrates CO₂ fixation with acetyl-CoA pathways, lifting carbon-use efficiency and decreasing feedstock kilograms per succinate kilogram. Producers are pairing such strains with membrane-based extraction units that halve energy draw compared with conventional crystallization. These incremental process gains shift variable costs downward, narrow the pricing gap versus petro-routes, and strengthen the long-term economics underpinning the bio-based succinic acid market.
Restraints Impact Analysis*
| Restraint | (~) % Impact on CAGR Forecast | Geographic Relevance | Impact Timeline |
|---|---|---|---|
| Higher production costs versus petro-based succinic acid | -0.70% | Global, most acute in cost-sensitive regions | Short term (≤ 2 years) |
| Agricultural feedstock price volatility | -0.40% | Regions dependent on corn or sugarcane | Medium term (2-4 years) |
| Competition from emerging bio-adipic acid pathways | -0.30% | Global, concentrated in nylon production regions | Long term (≥ 4 years) |
| Source: Mordor Intelligence | |||
Higher Production Costs Versus Petro-Based Succinic Acid
Techno-economic models place the price floor for commercial bio-based succinic acid between USD 2.5 and 2.7 per kilogram at today’s utility tariffs, a band still above the spot price of petro-derived equivalents in low-oil scenarios. The delta stems from sterilization energy demand, multi-step precipitation, and the capital intensity of stainless-steel fermenters. While carbon levies and premium niches partially offset the spread, large-volume users in resins and coatings remain price sensitive. Process intensification—continuous fermentation, in-situ product removal, and low-pH tolerant microbes—holds promise, but the timeline for parity hinges on accelerating these technologies from pilot to 50 kiloton nameplate capacity.
Agricultural Feedstock Price Volatility
Corn and sugar-crop markets remain exposed to weather, biofuel policy, and geopolitical shocks. The record 2023 Brazilian sugarcane crush of 45.8 million tons lifted sucrose output, yet also tightened feedstock availability for non-fuel users when freight bottlenecks emerged. U.S. agricultural policy is pivoting toward dedicated energy crops, but acreage shifts lag market signals, leaving bio-refineries vulnerable to quarterly price spikes[3]U.S. Department of Agriculture, “Biomass Research and Development Agenda 2025,” usda.gov . Producers targeting crude glycerol or lignocellulosic streams diversify risk, although these materials introduce variability in impurity profiles, necessitating costly pre-treatment that can negate feedstock savings. Consequently, raw-material volatility feeds through to margin compression and can defer investment decisions within the bio-based succinic acid market.
*Our forecasts treat driver/restraint impacts as directional, not additive. The impact forecasts reflect baseline growth, mix effects, and variable interactions.
Segment Analysis
By Application: Industrial Dominance Drives Market Foundation
Industrial uses captured 42.65% of the bio-based succinic acid market share in 2025, anchored by PBS packaging films, biodegradable mulch, and polyurethane intermediates that together consume multi-kiloton volumes. Demand in these channels scales predictably because converters sign multi-year take-or-pay contracts that underpin plant-load factors, thereby stabilizing the overall bio-based succinic acid market. Over the forecast horizon, personal care presents the sharpest growth curve at a 11.73% CAGR, lifting contribution from specialty formats such as leave-on acne treatments, natural deodorants, and mild exfoliants. Dermatology studies confirm that 1% succinic acid gels diminish Propionibacterium acnes proliferation without triggering irritation, which allows brands to position greener actives alongside existing beta-hydroxy acids. Pharmaceutical uptake continues steadily as formulators incorporate succinate buffers to maintain pH in controlled-release matrices, while coatings makers experiment with succinate-based polyols that give high-solids content yet ensure biodegradability.
Parallel to volume expansion, price realization differs widely among end markets. Industrial resin buyers negotiate lower per-tonne tariffs yet provide consistent offtake. Personal care and pharmaceutical users accept a premium due to microbiological purity and traceability requirements, creating a margin hedge for producers. These dynamics encourage a dual-channel model in which early adopters allocate baseline capacity to polymers and consume upgraded fermenter runs for specialty batches. Because each downstream sector prioritizes life-cycle-assessment metrics, cross-segment synergies emerge: credentials validated in medicine lend credibility to cosmetic claims, while mechanical recyclability tests in packaging reassure consumer-goods owners that end-of-life outcomes align with circular-economy pledges. Together, these patterns affirm the central role of application diversity in extending revenue stability across the bio-based succinic acid market.



By Feedstock Source: Corn Glucose Leads While Waste Streams Gain Momentum
Corn glucose held 38.60% of the bio-based succinic acid market size in 2025 thanks to mature wet-milling infrastructure, efficient dextrose purification, and competitive pricing relative to sugarcane in key North American hubs. Fermentation platforms geared for glucose reach predictable conversion yields exceeding 0.6 g/g substrate, underpinning reliable supply for polymer clients. Nevertheless, glycerol and assorted waste streams clock the fastest 12.03% CAGR to 2031 as producers capitalize on biodiesel by-products and food-industry effluents that cut feedstock outlay by up to 35%. Laboratory trials report 0.9 g/g succinate yields from crude glycerol, while downstream color removal remains the chief hurdle to commercial scale.
Lignocellulosic biomass occupies a promising but developmental tier. Pretreatment cocktails combining dilute acid and enzymatic hydrolysis liberate C5 and C6 sugars, yet capital costs escalate due to corrosion-resistant metallurgy. Interest in electro-bioreactors capable of coupling CO₂ reduction with succinate production is growing; elevated CO₂ partial pressures can double product formation rates, turning carbon capture liabilities into revenue streams. Feedstock flexibility therefore becomes a strategic hedge: companies secure corn for steady-state operations while piloting waste-based trains that may unlock cost breakthroughs. Long term, this diversification shields producers from commodity shocks and bolsters the resilience of the broader bio-based succinic acid market.
Geography Analysis
Asia-Pacific owned the largest regional slice, representing 33.05% of the bio-based succinic acid market in 2025 and cruising toward a 12.66% CAGR through 2031. China’s provincial governments funnel low-interest loans into industrial-biotech parks, enabling rapid scale-up of 50 kiloton fermenters dedicated to succinic acid and 1,4-butanediol. The National Development and Reform Commission integrates bio-chemicals into its Five-Year Plan incentives, adding tax holidays that lower cash-cost breakevens. In Japan, the Green Growth Strategy for Carbon Neutrality allocates subsidies for biomass naphtha co-processing, prompting Mitsubishi Chemical, Mitsui Chemicals, and Asahi Kasei to co-invest in pilot crackers that will feed succinate-based polyesters. South Korea supports similar ambitions through its Bio-Strategic Technology blueprint, while India focuses on feedstock supply by expanding broken-rice ethanol programs that could divert saccharified streams into chemical fermenters. Altogether, these initiatives compound policy support with scale economies, reinforcing Asia-Pacific’s leadership in the bio-based succinic acid market.
North America sustains robust activity through advanced synthetic-biology clusters, risk-tolerant venture funding, and state-level clean-fuel incentives. The United States Department of Agriculture frames succinic acid as a high-priority product in its 2025 Biomass Research and Development Agenda, unlocking grant pools for strain engineering and waste-stream valorization. California’s Low Carbon Fuel Standard awards credit multipliers to biogenic CO₂ utilization, a mechanism that fermentation plants leverage for additional revenue when they integrate carbon capture units. Green Plains’ clean-sugar subsidiary demonstrated 40% lower carbon footprint dextrose, a feedstock now trialed by contract fermenters in Nebraska. Canada provides accelerated depreciation for equipment deployed in biochemicals, and Mexico evaluates concessions for bio-intermediates to spur northern industrial corridors. Collectively, these policy and infrastructure elements create a fertile ecosystem that underpins steady expansion of the bio-based succinic acid market within the region.
Europe’s trajectory hinges on regulatory stringency that embeds carbon costs into every tonne of petrochemical output. The European Commission’s 2040 climate-neutral roadmap positions carbon-capture-and-utilization products for priority offtake in public procurement. Germany’s National Bioeconomy Strategy supplements R&D grants with feedstock logistics programs to integrate sugar-beet residues into chemical parks such as Leuna. France pilots carbon-footprint labeling on consumer goods, elevating demand for verified low-emission intermediates. The United Kingdom’s Contracts for Difference-style mechanism for industrial carbon removal assures payment floors, encouraging fermentation plants to co-locate with sequestration wells in the North Sea. While production costs exceed Asian averages, brand-owner pressure and access to green-finance instruments maintain competitive momentum. Consequently, Europe operates as the principal premium market within the bio-based succinic acid market, absorbing high-purity grades and specialty volumes that justify elevated pricing.

Regulatory Landscape
Regulatory requirements for bio-based succinic acid continue to be anchored by chemical registration and safety frameworks in major consuming regions. In the European Union, succinic acid is listed under REACH (EC 203-740-4) with joint-submission registration dossiers, making compliant registration and supply-chain documentation central to market access, especially for producers serving polymer and personal-care customers that require traceability.
Standard-setting for bio-based variants is also becoming clearer in Asia-Pacific. China issued the QB/T 8214-2026 standard for bio-based succinic acid, with implementation in September 2026, adding a recognized domestic benchmark for product specifications and procurement. In parallel, international trade classification under HS Code 29171920 supports customs alignment for 100% bio-based succinic acid shipments, while the United States maintains TSCA oversight pathways that can apply to succinic-acid-related new chemical substances and polymer systems during commercialization.
Value Chain Analysis
The value chain starts with renewable carbon sourcing, led by purified sugars such as corn-derived glucose and sucrose streams, and expanding into crude glycerol and residue-based inputs where pretreatment and impurity management become differentiators. Feedstock then moves into fermentation, covering organism or strain selection, nutrient inputs, and utilities, followed by recovery and purification steps that are energy- and equipment-intensive, including separation, decolorization for waste-derived feeds, and crystallization or alternative recovery trains. This midstream stage is where yield, titer, and purification energy most directly shape delivered cost and carbon footprint.
Commercial distribution generally shifts from bulk chemical logistics (totes, tankers, and intermediates distributors) to high-volume industrial polymer value chains, particularly PBS and polyurethane intermediates, and to higher-specification specialty channels such as personal care and pharmaceuticals where consistent purity and documentation carry premiums. Downstream conversion partners, including polymer compounders and formulators, translate succinic acid into PBS, polyols, resins, and buffered formulations, with procurement increasingly tied to certification and product-carbon-footprint reporting. Projects funded under programs such as the Circular Bio-based Europe Joint Undertaking, including LUCRA (July 2023 to June 2027), illustrate how municipal or wood waste handling, fermentation-grade feed preparation, and drop-in polymer qualification are increasingly linked, raising coordination needs across waste operators, bioprocessers, and end-use polymer manufacturers.
Competitive Landscape
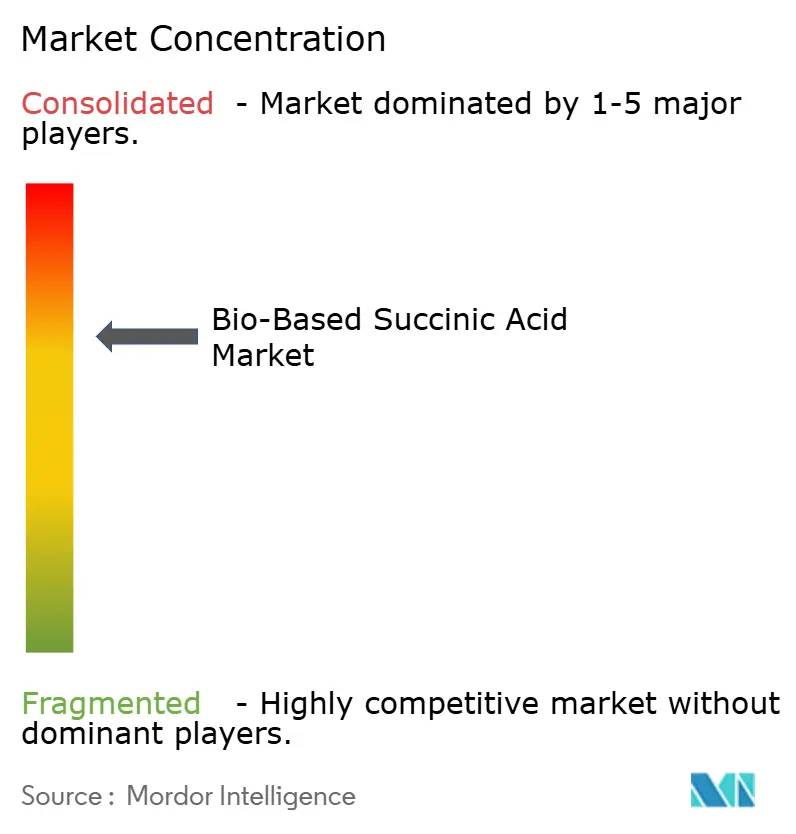
The competitive arena remains consolidated, with the top five suppliers estimated to control around 64% combined output. BASF exploits its global network to embed certified bio-succinate streams into acrylic monomers, coatings resins, and superabsorbent polymers, expanding ISCC+-certified SKUs to reinforce value-chain traceability. DSM-Firmenich leverages precision fermentation to serve nutrition and personal-care formulators, reporting H1 2024 sales of EUR 6.30 billion, underpinned by sustainability-tagged ingredients. Roquette champions its BIOSUCCINIUM platform, collaborating with polymer compounders to optimize PBS for flexible packaging and thermoforming applications.
Emerging specialists focus on cost and feedstock breakthroughs. Succinity, a BASF-Corbion venture, pilots continuous fermentation coupled with membrane extraction, targeting sub-USD 2.0 per-kilogram economics once run-rates exceed 75% capacity utilization. GC-Innovate in Thailand integrates crude glycerol from its biodiesel affiliate to secure low-cost carbon, while Switzerland’s Kuenz applies high-cell-density reactors that cut downtime between cycles. Strategic partnerships frequently pair biotech start-ups with established petrochemical distributors to unlock market reach and logistical expertise. Producers also invest in life-cycle-assessment audits and Product Carbon Footprint disclosures to differentiate from fossil incumbents and qualify for ecolabel programs.
Mergers and acquisitions have slowed marginally since 2024, yet the subset of deals tagged to sustainability themes shows resilience as private equity funds prioritize decarbonization theses. Joint-venture structures prevail because they pool fermentation know-how with downstream application insight without demanding full ownership transitions. Supply contracts extending five or more years are increasingly common, reflecting end-user urgency to lock secure volumes amid tightening ESG requirements. With technological learning curves tightening and debt financing costs stabilizing, the bio-based succinic acid market is expected to experience notable shifts. However, the emergence of breakthrough strain patents and regional feedstock advantages are set to prevent the market from rallying around a singular dominant player.
Bio-Based Succinic Acid Industry Leaders
Anhui Sunsing Chemicals Co. Ltd.
BASF SE
Kawasaki Kasei Chemicals Ltd.
Mitsubishi Chemical Group Corporation
Roquette Frères
- *Disclaimer: Major Players sorted in no particular order

Market Opportunities and Future Outlook
A clearer whitespace is emerging around waste- and residue-based production routes that can stabilize input costs and strengthen sustainability claims versus first-generation sugar reliance. The LUCRA project (July 2023 to June 2027) under the Circular Bio-based Europe Joint Undertaking is evaluating municipal organic solid waste and wood waste as feedstocks for bio-based succinic acid, with downstream validation activity tied to polyurethane use cases via Covestro. This type of program-driven scaling creates space for providers and producers that can deliver reliable pretreatment, fermentation robustness on variable feeds, and repeatable purification performance.
Opportunities also run through tighter integration with downstream polymer chains and certifications that support procurement. On the supply side, producers with established commercial assets and differentiated processes can expand addressable segments by aligning grades to end-use requirements, including Roquette's BIOSUCCINIUM (marketed as 100% bio-based and high purity) for personal-care and specialty formulations and integrated PBS-linked production footprints such as Shandong Lantian Biotechnology's reported coupling of bio-based succinic acid output with bio-based PBS capacity. In Asia, single-site nameplate capacities such as Hainan Sincere Industries' 50,000 tons per year bio-based succinic acid operations and Lantian's stated 25,000 tons per year line support longer-term offtake structures with polymer converters, with commercialization shifting toward qualifying consistent polymer performance, documenting traceability, and reducing delivered-cost volatility through feedstock diversification rather than only adding fermentation volume.
Recent Industry Developments
- September 2026: China implemented the QB/T 8214-2026 standard for bio-based succinic acid, establishing a formal domestic specification benchmark for producers and buyers. The standard supports procurement clarity for local polymer and formulation customers and raises the importance of compliance testing and documentation for companies shipping into or operating within China.
- March 2026: Circular Bio-based Europe Joint Undertaking highlighted the LUCRA project to produce bio-based succinic acid from organic municipal solid waste and wood waste. The program focus signals active EU-backed scale-up work on residue feedstocks, aligning supply development with downstream qualification needs for drop-in polymer applications.
- November 2024: The Japan BioPlastics Association (JBPA) certified Mitsubishi Chemical Group's BioPBS as a marine biodegradable biomass plastic. This certification strengthens pull-through demand for bio-based succinic acid in PBS supply chains by improving the credentials used in packaging and other sustainability-driven applications.


Research Methodology Framework and Report Scope
Market Definition and Coverage
This market is defined as the revenue earned from selling bio-based succinic acid produced from renewable feedstocks, counted at the manufacturer level and used across industrial and specialty chemical applications worldwide.
Scope exclusions: This sizing excludes petro-based succinic acid and it also excludes downstream finished products that only use succinic acid as an input.
Segmentation Overview
- By Application
- Industrial
- Pharmaceuticals
- Personal Care
- Paints and Coatings
- Other Applications
- By Feedstock Source
- Corn-derived Glucose
- Sugarcane and Beet Sucrose
- Lignocellulosic Biomass
- Crude Glycerol and Waste Streams
- CO₂-coupled Bio-electrochemical Routes
- By Geography
- Asia-Pacific
- China
- Japan
- India
- South Korea
- Rest of Asia-Pacific
- North America
- United States
- Canada
- Mexico
- Europe
- Germany
- United Kingdom
- France
- Italy
- Rest of Europe
- South America
- Brazil
- Argentina
- Rest of South America
- Middle East and Africa
- Saudi Arabia
- South Africa
- Rest of Middle East and Africa
- Asia-Pacific
Data Sources, Market Sizing, and Validation
Desk Research
Desk work started by building a clean fact base on capacity, trade, and demand signals for bio-based organic acids, then narrowing it to succinic acid. Public sources such as UN Comtrade, USGS materials statistics (for adjacent chemical supply indicators), the European Commission and national chemical regulatory portals (for registrations and compliance signals), and US EPA publications were used to sanity check production and use patterns. We also reviewed peer-reviewed journals on fermentation routes and yields to understand practical conversion assumptions that affect effective supply.
On the market side, filings and investor presentations of relevant producers were reviewed to capture nameplate capacity, utilization commentary, and regional sales mix where it is disclosed. Trade association websites and reputable press were also used to track plant starts, shutdowns, and feedstock availability changes. Where needed, paid subscriptions for company financials and intelligence, and for patent databases, were used to link corporate actions to realistic capacity and commercialization timing. The desk sources mentioned are illustrative and not exhaustive, and additional public and paid references were also consulted for data collection, validation, and clarification.
Primary Interviews and Surveys
Primary work focused on expert interviews and structured questionnaires with producers, distributors, and large end users in polymers, coatings, and personal care to confirm volumes, price ranges, and contract structures. Since this is a global market, we made sure feedback covered APAC, EMEA, and the Americas so regional adoption differences and supply constraints could be reflected back into the key assumptions.
Distribution of primary research fieldwork respondents
| Company type | Respondent position | Region |
|---|---|---|
| Top tier: 31% | CXOs: 16% | APAC: 48% |
| Mid tier: 47% | Functional/Unit leaders: 39% | EMEA: 33% |
| Smaller Players: 22% | Managers: 45% | Americas: 19% |
Market-Sizing & Forecasting
Sizing was built using a top-down and bottom-up mix, where bio-based succinic acid demand is first reconstructed from application demand pools and then adjusted using adoption and substitution rates versus conventional alternatives. To keep the totals realistic, the demand build was corroborated with selective bottom-up approximations, mainly a roll-up of known production capacities adjusted for utilization, plus sample checks of average selling price ranges multiplied by estimated shipped volumes.
Key inputs that drive the model include announced and operating bio-based capacity by region, utilization and ramp-up timelines, feedstock cost direction for sugars and glycerol streams, observed price spreads versus petro-based succinic acid, and the pace of downstream demand in polymers and coatings. When interview feedback pointed to gaps in public information (for example, limited utilization disclosure), we filled them using conservative ramp curves and then revisited them during validation rounds. Forecasting relied on scenario analysis, supported by a multivariate regression check where demand growth was linked to downstream industrial output indicators and the expected policy and sustainability pull in key consuming regions.
Data Validation & Update Cycle
Outputs were validated through multiple checks so the final numbers do not rely on one assumption alone. Our analysts compared implied volumes, prices, and regional splits against independent signals like capacity announcements, trade flows, and reported downstream demand trends, and then investigated any large variances before sign-off. When a mismatch was found, the relevant assumption was revisited, and respondents were re-contacted where clarification was necessary.
The report is refreshed annually, and interim updates are triggered when material events occur, such as plant commissioning delays, major feedstock disruptions, or sudden price swings. Before delivery, an analyst performs a fresh pass so clients receive the latest view aligned with the most recent public releases and field feedback.
Mordor Intelligence's Global Bio Based Succinic Acid Market Market Size Compared With Other Published Estimates
Published estimates for bio-based succinic acid can vary even when they appear to describe the same market, because the scope and the way prices and ramp-ups are handled are not always consistent. The year chosen as the starting point, the assumed penetration into polymers and coatings, and how regional adoption is blended into one global number can also move the final value.
The main gap comes from how fast nameplate capacity is assumed to convert into realized sales, where Mordor Intelligence ties revenue recognition to utilization based ramp curves and application-level adoption checks before totals are finalized. Currency timing, how spot versus contract prices are averaged, and how strictly petro-based volumes are excluded are other practical drivers that can explain why sources land at different totals for nearby years.
Benchmark comparison
| Source | Market Size | Gaps in Research Methodology |
|---|---|---|
| Mordor Intelligence | USD 155.68 M (2026) | |
| Global Consultancy A | USD 126.04 M (2023) | Uses an earlier base year and appears to apply a faster adoption curve across end uses, which can lift the forward trajectory even if near-term utilization is still ramping. |
| Industry Publisher B | USD 137.27 M (2024) | Year selection and price normalization are not fully transparent, and the estimate may blend spot pricing with limited validation of regional contract ranges, which can shift revenue in a small market. |
Overall, most of the spread is explained by ramp-up timing, price averaging choices, and differences in how strictly bio-based volumes are separated from petro-based supply. When the model is anchored to observable capacity moves, realistic utilization, and clear application demand checks, the resulting market number becomes easier to trace and repeat as new information comes in.


Key Questions Answered in the Report
What is the current value of the bio-based succinic acid market?
The market is valued at USD 146.98 million in 2026 and is projected to reach USD 247.89 million by 2031.
Which application dominates demand?
Industrial polymers, particularly PBS and polyurethane precursors, hold 42.65% of market share in 2025.
Which region is growing fastest?
Asia-Pacific leads both size and growth, expanding at a 12.66% CAGR through 2031 due to large-scale biomanufacturing investments.
What feedstock is most widely used?
Corn-derived glucose accounts for 38.60% of feedstock demand, though glycerol and waste streams are rising the quickest.
How do carbon-pricing policies impact the market?
Schemes such as California’s LCFS and the EU’s industrial carbon strategy create financial incentives that narrow the cost gap between bio-based and petro-based succinic acid, bolstering long-term adoption.
Page last updated on:





