Bio-alcohols Market Size and Share
Market Overview
| Study Period | 2020 - 2031 |
|---|---|
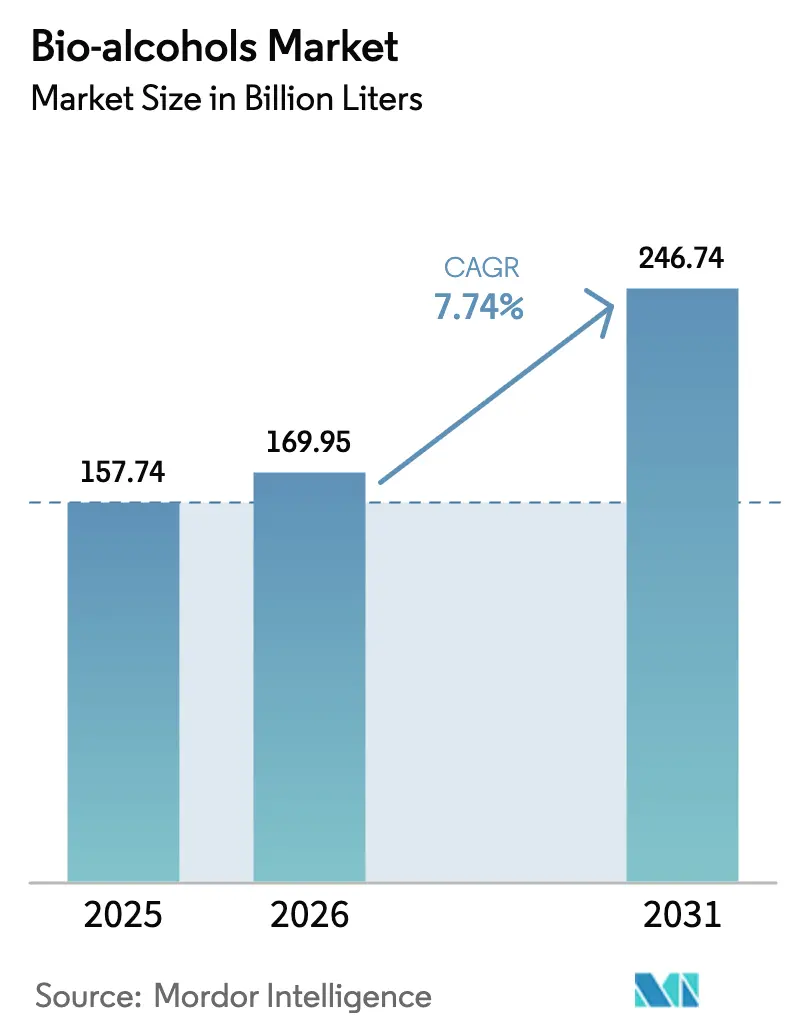
| Market Volume (2026) | 169.95 Billion liters |
| Market Volume (2031) | 246.74 Billion liters |
| Growth Rate (2026 - 2031) | 7.74% CAGR |
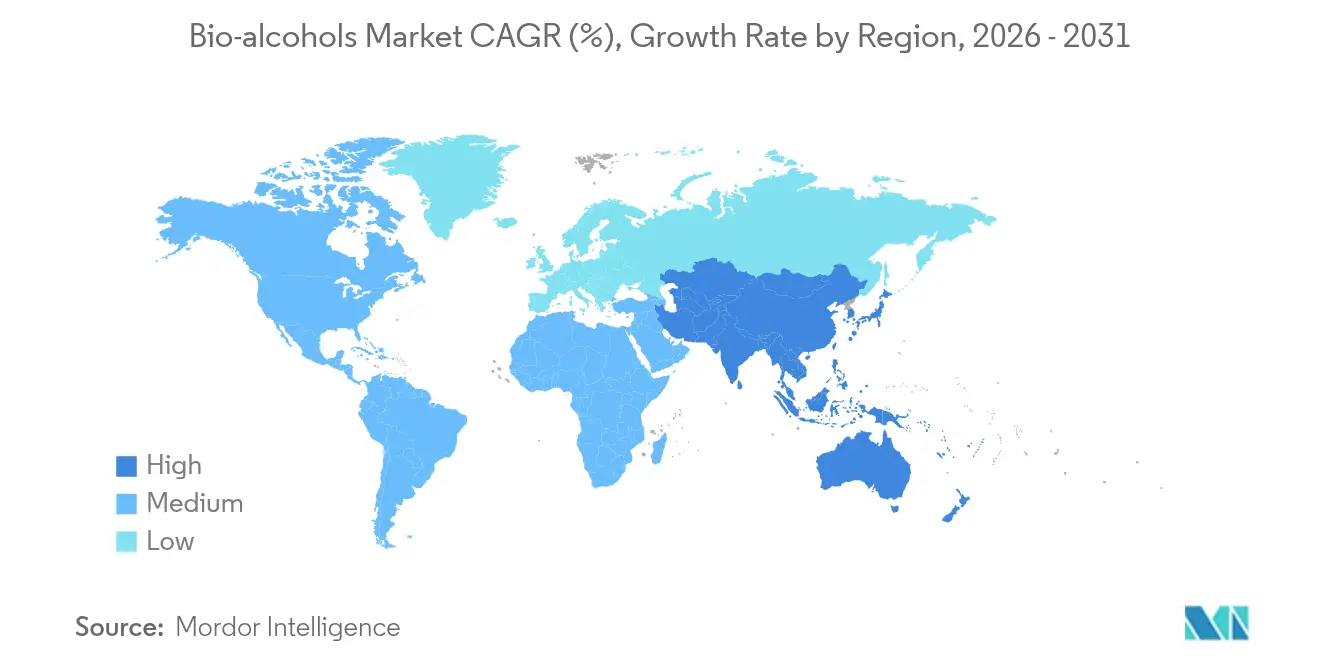
| Fastest Growing Market | Asia Pacific |
| Largest Market | North America |
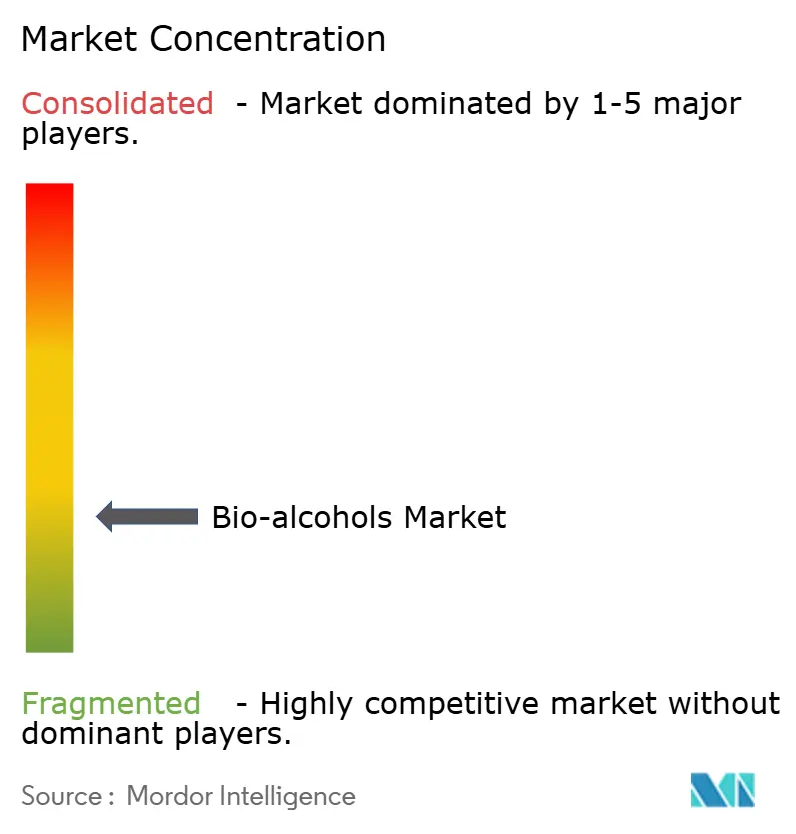
| Market Concentration | Low |
Major Players *Disclaimer: Major Players sorted in no particular order Image © Mordor Intelligence. Reuse requires attribution under CC BY 4.0. | |
Bio-alcohols Market Analysis by Mordor Intelligence
Bio-alcohols Market size in 2026 is estimated at 169.95 billion liters, growing from 2025 value of 157.74 billion liters with 2031 projections showing 246.74 billion liters, growing at 7.74% CAGR over 2026-2031. This growth reflects tightening renewable-fuel rules, quick progress in alcohol-to-jet certification, and the arrival of commercial carbon-capture-to-alcohol systems that give refiners fresh revenue while cutting emissions. Demand is also being reshaped by sustainable marine-fuel corridors, premium chemical uses in consumer goods, and stronger investor appetite for low-carbon supply chains. Established North American producers keep scale advantages, yet Asia-Pacific is adding capacity faster thanks to policy tailwinds and cost-optimized technologies. Feedstock innovation, especially with algae and industrial off-gases, is helping moderate margin risks linked to crop price swings, while strategic offtake deals with airlines and shippers give investors cash-flow clarity.
Key Report Takeaways
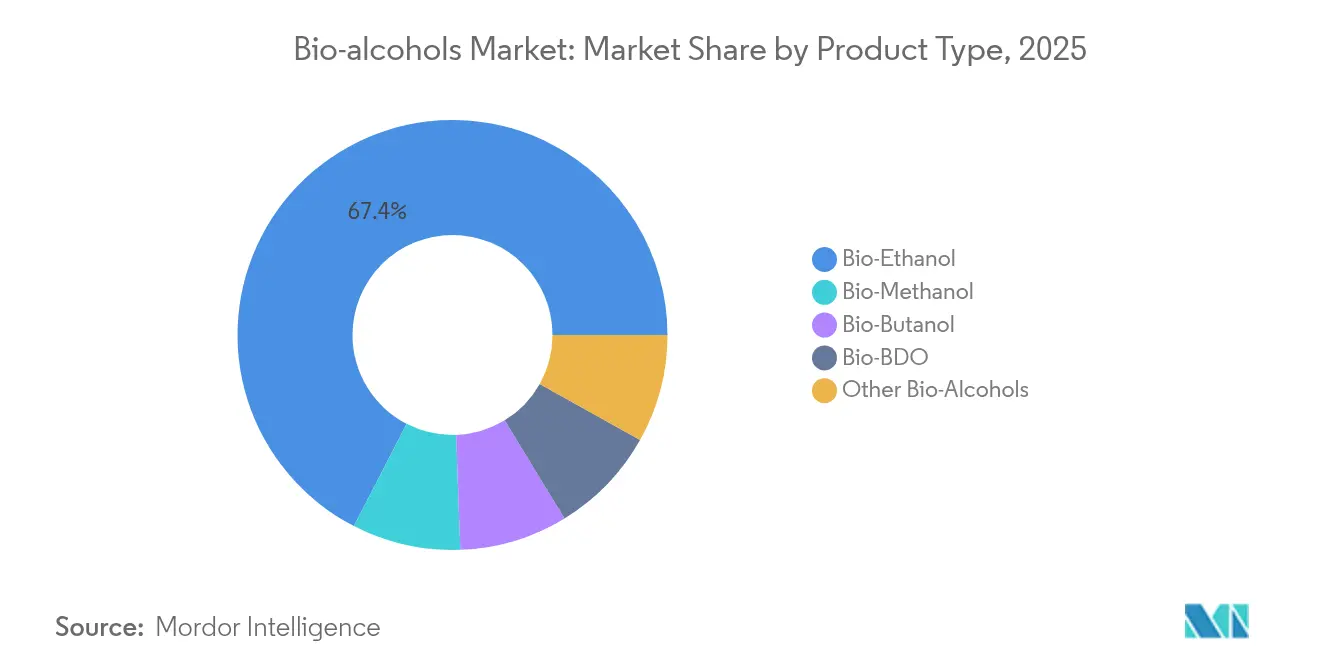
- By product type, bio-ethanol captured 67.42% of revenue in 2025; bio-butanol is projected to grow at a 9.07% CAGR through 2031.
- By feedstock, starch-based routes held 45.21% of 2025 sales, but algal biomass is forecast to climb at an 10.62% CAGR.
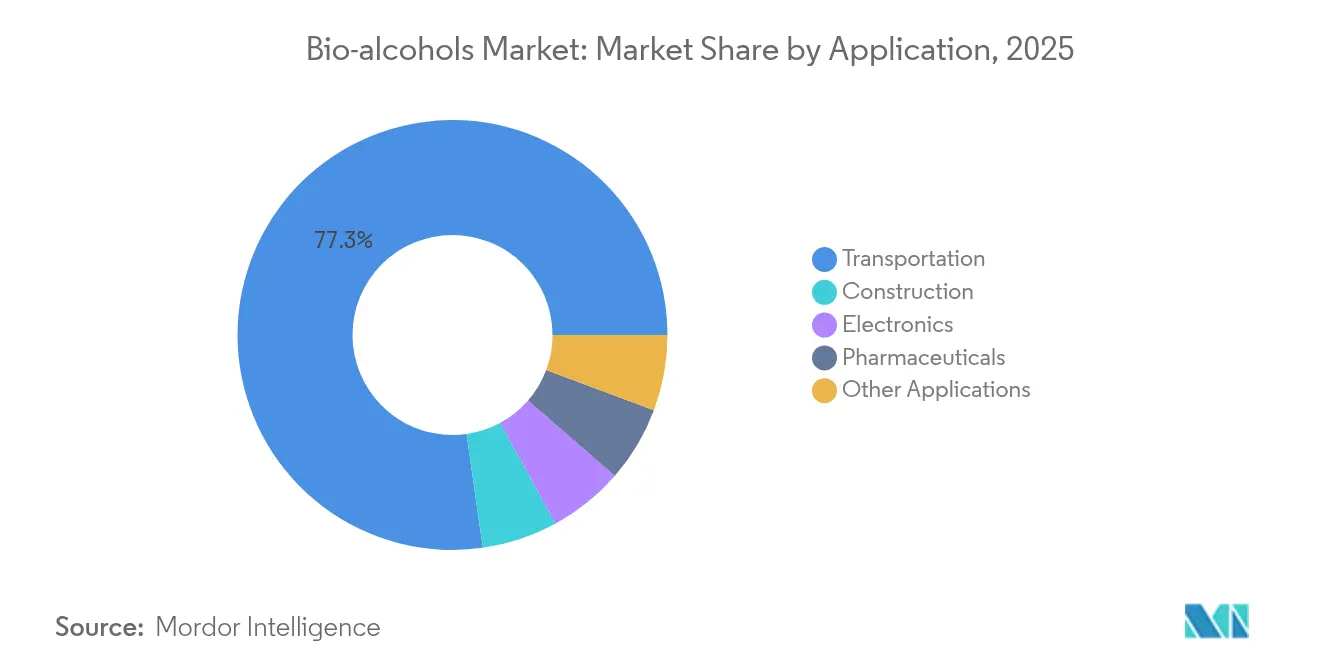
- By application, transportation retained 77.25% of demand in 2025, while other emerging uses are poised for a 10.31% CAGR.
- By region, North America led with 39.02% of the Bio-alcohol market share in 2025, while Asia-Pacific is set to post the fastest 9.21% CAGR to 2031.
Note: Market size and forecast figures in this report are generated using Mordor Intelligence’s proprietary estimation framework, updated with the latest available data and insights as of 2026.
Global Bio-alcohols Market Trends and Insights
Drivers Impact Analysis*
| Driver | (~) % Impact on CAGR Forecast | Geographic Relevance | Impact Timeline |
|---|---|---|---|
| Mandated ethanol-blend targets | +2.10% | Global, with early gains in India, Brazil, EU | Medium term (2-4 years) |
| Rapid airline SAF certification of Alcohol-to-Jet pathways | +1.80% | North America & EU, spill-over to APAC | Short term (≤ 2 years) |
| Integration of CO₂ to alcohol CCU plants at refineries | +1.60% | North America, EU, emerging in China | Long term (≥ 4 years) |
| Bio-alcohol use as low-carbon chemical feedstock in CPG | +1.40% | Global, concentrated in developed markets | Medium term (2-4 years) |
| Emerging methanol-powered shipping corridors | +0.90% | APAC core, spill-over to Europe | Long term (≥ 4 years) |
| Source: Mordor Intelligence | |||
Mandated Ethanol-Blend Targets
Blend mandates guarantee demand, reduce investor risk, and speed plant expansions. India’s goal of 30% blending by 2030, having already reached 20%, shows the upside that ambitious policy can unlock. The EU’s ReFuelEU Aviation rule starts with 2% SAF in 2025 and rises to 70% by 2050, offering a clear runway for alcohol-to-jet projects[1]European Commission, “ReFuelEU Aviation,” ec.europa.eu . Brazil’s E27 program remains a template for high blend ratios once logistics barriers ease. Because mandates shield volumes from commodity swings, producers can line up long-term feedstock contracts and lower financing costs.
Rapid Airline SAF Certification of Alcohol-to-Jet Pathways
Aviation’s net-zero push has sharply accelerated testing of alcohol-to-jet routes. LanzaJet’s Freedom Pines Fuels site in Georgia already makes 9 million gallons a year and gives financiers confidence that large plants will run reliably[2]U.S. Department of Energy, “LanzaJet Freedom Pines Fuels,” energy.gov . Axens’ Jetanol projects now top 1 billion gallons per year of planned capacity, underlining the technology’s bankability. SAF often sells at two to three times the price of conventional jet fuel, so bio-ethanol producers enjoy wider margins when they pivot toward aviation customers. Long-term airline offtake deals, such as Southwest’s agreement with USA BioEnergy, further derisk project cash flows.
Integration of CO₂-to-Alcohol CCU Plants at Refineries
Refineries adopting carbon-capture-and-utilization units can recycle exhaust gas into ethanol, creating new product lines while cutting tax exposure. LanzaTech and Eramet will build a Norwegian plant that converts furnace gas into 24 kilotons of ethanol a year. When coupled with sequestration stages, the same hardware delivers dual revenue—saleable alcohol plus carbon credits. Operators can size systems to match local emissions and demand, spreading capital over phased expansions and improving returns.
Bio-Alcohol as Low-Carbon Chemical Feedstock in CPG
Consumer brands want traceable, renewable inputs for everyday products. BASF’s rollout of bio-based ethyl acrylate in Q4 2024 proves that large chemical lines can swap petro-feed with bio-alcohols without re-tooling plants. Braskem’s USD 87 million boost to its green ethylene unit signals growing orders from polymer buyers. Because these specialty chemicals command premiums over fuel blends, producers can diversify earnings and hedge exposure to transport cycles.
Restraints Impact Analysis*
| Restraint | (~) % Impact on CAGR Forecast | Geographic Relevance | Impact Timeline |
|---|---|---|---|
| Feedstock price volatility | -1.20% | Global, acute in regions dependent on agricultural commodities | Short term (≤ 2 years) |
| Insufficient pipeline compatibility for high-blend alcohols | -0.80% | North America, EU infrastructure limitations | Medium term (2-4 years) |
| Stagnant global light-vehicle production post-2027 | -0.60% | Global automotive markets | Long term (≥ 4 years) |
| Source: Mordor Intelligence | |||
Insufficient Pipeline Compatibility for High-Blend Alcohols
Most petroleum pipelines cannot handle high alcohol blends due to corrosion and water uptake, forcing reliance on truck or rail. The extra logistics cost erodes delivered-price competitiveness, especially in regions far from blending terminals. Upgrading lines needs cooperation between many owners and warrants high capital that some markets cannot justify yet.
Stagnant Global Light-Vehicle Production Post-2027
Vehicle output is predicted to plateau after 2027 as ownership saturates and electric cars grab share. The IEA sees total oil demand flattening near 105.5 million barrels per day by 2030, signaling limited upside for gasoline and, by extension, ethanol blending[3]International Energy Agency, “Oil 2025,” iea.org . The result is greater urgency for producers to pivot toward aviation, marine, and chemical outlets.
*Our forecasts treat driver/restraint impacts as directional, not additive. The impact forecasts reflect baseline growth, mix effects, and variable interactions.
Segment Analysis
By Product Type: Bio-Ethanol Dominance Masks Specialty Growth
Bio-ethanol kept a 67.42% 2025 Bio-alcohol market share, underpinned by mature plants, standardized specs, and supportive mandates. Its conversion cost edge and global supply chain reinforce leadership. The Bio-alcohol market size for bio-ethanol is expected to expand steadily in line with nationwide blend limits that increase absolute volume even as gasoline peaks. Yet bio-butanol’s superior energy density and drop-in compatibility are propelling its 9.07% CAGR and a rising slice of premium chemical demand.
Alcohol-to-jet breakthroughs provide a higher-value outlet for ethanol. LanzaJet’s early operating data confirm that low-cost agricultural ethanol can be upgraded into SAF that sells at a 2-3× price multiple. Meanwhile, bio-methanol is carving room in marine fuels and plastics, and bio-BDO caters to pharmaceutical and engineered-material niches. Collectively, specialty alcohols diversify the Bio-alcohol market and lessen sensitivity to road-fuel swings.


By Feedstock: Starch Supremacy Challenged by Algal Innovation
Starch pathways kept 45.21% of 2025 volume thanks to plentiful corn and wheat, integrated milling assets, and co-product credits. That scale advantage helps them anchor pricing, and multi-decade logistics know-how raises barriers for newcomers. Still, the Bio-alcohol market size captured by starch is gradually ced¬ing ground as policy pressure favors non-food inputs.
Algal biomass is the breakout story, clocking an 10.62% CAGR on better photobioreactor yields and DOE grant support. Pilot farms reach cost parity sooner by recycling nutrients and harvesting lipids alongside sugars. Lignocellulosic residues and municipal waste streams are also inching forward, turning disposal liabilities into revenue. This diverse basket improves resilience when bad weather or trade shocks hit grain supplies.
By Application: Transportation Dominance Faces Diversification Pressure
Transportation still wrote 77.25% of demand in 2025, reflecting embedded blend frameworks and robust logistics. The segment’s sheer scale anchors offtake for new projects, letting plants run at high utilization. However, other uses are rising at 10.31% CAGR as electronics, construction, and pharma buyers prize renewable solvents.
Smartphone factories deploy high-purity ethanol for circuit cleaning, while building-material suppliers blend bio-alcohols into low-VOC coatings. Pharma firms need USP-grade alcohol both as an active and an excipient. BASF’s bio-acrylate line anchors this shift, showing that major chemical platforms can switch feedstocks without quality sacrifice. The pivot reduces reliance on vehicle sales cycles and cushions revenue when gasoline demand flattens.
Geography Analysis
North America’s 39.02% 2025 share mirrors its dense corn-to-ethanol corridor, ample rail logistics, and the Renewable Fuel Standard that keeps baseline volumes. Canada’s 2025 Clean Fuel Regulation widens demand for low-carbon blends beyond the United States. Mexico’s new mill investments knit the continent into a self-reinforcing supply chain. Summit Next Gen’s USD 1.6 billion Texas ethanol-to-SAF complex, eligible for JETI subsidies, underlines how local grants align with federal tax credits to lure mega-projects.
Asia-Pacific is the growth engine, tracking a 9.21% CAGR on the back of India’s fast-tracked 30% blend agenda and record rice-feedstock pull. China adds momentum by funding CO₂-to-alcohol pilots that dovetail with its 2060 neutrality plan, while Japan and South Korea channel green-fuel incentives at refineries and airports. ASEAN markets, including the Philippines, are lifting blending rules too, keeping regional demand broad-based. This policy updraft attracts joint ventures that stitch together local feedstock with imported technology, accelerating capacity rollout.
Europe moves with stringent carbon-pricing and SAF mandates that jump-start premium niches. The ReFuelEU rulebook gives investors clarity on future SAF ramp-ups, while Germany and the UK run national subsidies to ensure domestic production. Feedstock flexibility, including sugar beet and waste biomass, helps buffer supply shocks. South America continues leveraging cheap sugarcane and advanced second-generation mills that process bagasse, supporting steady export flows to deficit regions. The Middle East and Africa, though smaller, are piloting projects as part of diversification strategies.

Competitive Landscape
The Bio-alcohol market is fragmented. ADM, Cargill, and other grain majors lock in feedstock via owned elevators and hedging desks, delivering cost leadership in starch ethanol. BASF and Braskem fold bio-alcohols into chemical value chains, gaining access to higher-margin markets. LanzaTech and Gevo push proprietary conversion routes, forming royalty streams and creating barriers for late entrants.
Scale continues to matter, yet the game is shifting from volume to differentiation. Producers chase vertical integration—growing feedstock, converting, and marketing—in one platform to capture the spread. Horizontal alliances are also rising: airline-producer SAF offtake pacts and chemical-producer licensing deals stabilize demand and finance. Newcomers emphasize low-cost waste feedstocks, CCU loops, and premium compliance credits instead of price wars.
Government backing shapes the field. Gevo’s USD 1.63 billion DOE loan accelerates its Net-Zero 1 plant, demonstrating how federal financing can fast-forward commercialization of novel pathways. Regional grants, joint R&D, and carbon markets complement private capital, letting innovators leapfrog to scale without replicating decades-old fermentation footprints.
Bio-alcohols Industry Leaders
ADM
Cargill Incorporated
POET LLC
Valero Energy Corporation
BP p.l.c.
- *Disclaimer: Major Players sorted in no particular order

Recent Industry Developments
- April 2025: Gevo Inc. signed a SAF Scope 1 & Scope 3 carbon-credit offtake agreement with Future Energy Global, boosting book-and-claim adoption for alcohol-to-jet fuel. This move is poised to strengthen the bio alcohol market by expanding its role in sustainable aviation fuel production.
- September 2024: LanzaTech and SEKISUI CHEMICAL CO., LTD. have established a Master License Agreement to commercialize their waste-to-ethanol conversion technology. SEKISUI's agreement enables the construction of facilities across Japanese municipalities, boosting bio-alcohol production and the waste-to-fuel market.


Global Bio-alcohols Market Report Scope
The bio-alcohols market report includes:
| Bio-Methanol |
| Bio-Ethanol |
| Bio-Butanol |
| Bio-BDO |
| Other Bio-Alcohols |
| Starch-based Crops |
| Sugar-based Crops |
| Lignocellulosic Biomass |
| Algal Biomass |
| Industrial Off-gases and MSW |
| Transportation |
| Construction |
| Electronics |
| Pharmaceuticals |
| Other Applications |
| Asia-Pacific | China |
| India | |
| Japan | |
| South Korea | |
| ASEAN Countries | |
| Rest of Asia-Pacific | |
| North America | United States |
| Canada | |
| Mexico | |
| Europe | Germany |
| United Kingdom | |
| France | |
| Italy | |
| Rest of Europe | |
| South America | Brazil |
| Argentina | |
| Rest of South America | |
| Middle East and Africa | Saudi Arabia |
| South Africa | |
| Rest of Middle East and Africa |
| By Product Type | Bio-Methanol | |
| Bio-Ethanol | ||
| Bio-Butanol | ||
| Bio-BDO | ||
| Other Bio-Alcohols | ||
| By Feedstock | Starch-based Crops | |
| Sugar-based Crops | ||
| Lignocellulosic Biomass | ||
| Algal Biomass | ||
| Industrial Off-gases and MSW | ||
| By Application | Transportation | |
| Construction | ||
| Electronics | ||
| Pharmaceuticals | ||
| Other Applications | ||
| By Geography | Asia-Pacific | China |
| India | ||
| Japan | ||
| South Korea | ||
| ASEAN Countries | ||
| Rest of Asia-Pacific | ||
| North America | United States | |
| Canada | ||
| Mexico | ||
| Europe | Germany | |
| United Kingdom | ||
| France | ||
| Italy | ||
| Rest of Europe | ||
| South America | Brazil | |
| Argentina | ||
| Rest of South America | ||
| Middle East and Africa | Saudi Arabia | |
| South Africa | ||
| Rest of Middle East and Africa | ||


Key Questions Answered in the Report
What is the current Bio-alcohol market size?
The market reached 169.95 billion liters in 2026 and is projected to hit 246.74 billion liters by 2031.
Which region leads the Bio-alcohol market?
North America held 39.02% of Bio-alcohol market share in 2025, backed by established corn-to-ethanol infrastructure.
What segment is growing fastest?
Bio-butanol is forecast to grow at a 9.07% CAGR from 2026-2031 thanks to its higher energy density and chemical versatility.
How are airlines driving demand?
Alcohol-to-jet pathways are certified quickly, and offtake contracts with carriers guarantee volumes at premium prices, lifting producer margins.
Why is algae gaining attention as a feedstock?
Algae avoids food-fuel conflict, offers year-round yields, and has attracted government grants, supporting an 10.62% CAGR outlook for algal routes.
What risks could slow Bio-alcohol market growth?
Feedstock price swings, limited pipeline compatibility for high blends, and flat light-vehicle output after 2027 could dampen the pace unless diversification continues.
Page last updated on:


