Market Overview
| Study Period | 2019 - 2031 |
|---|---|
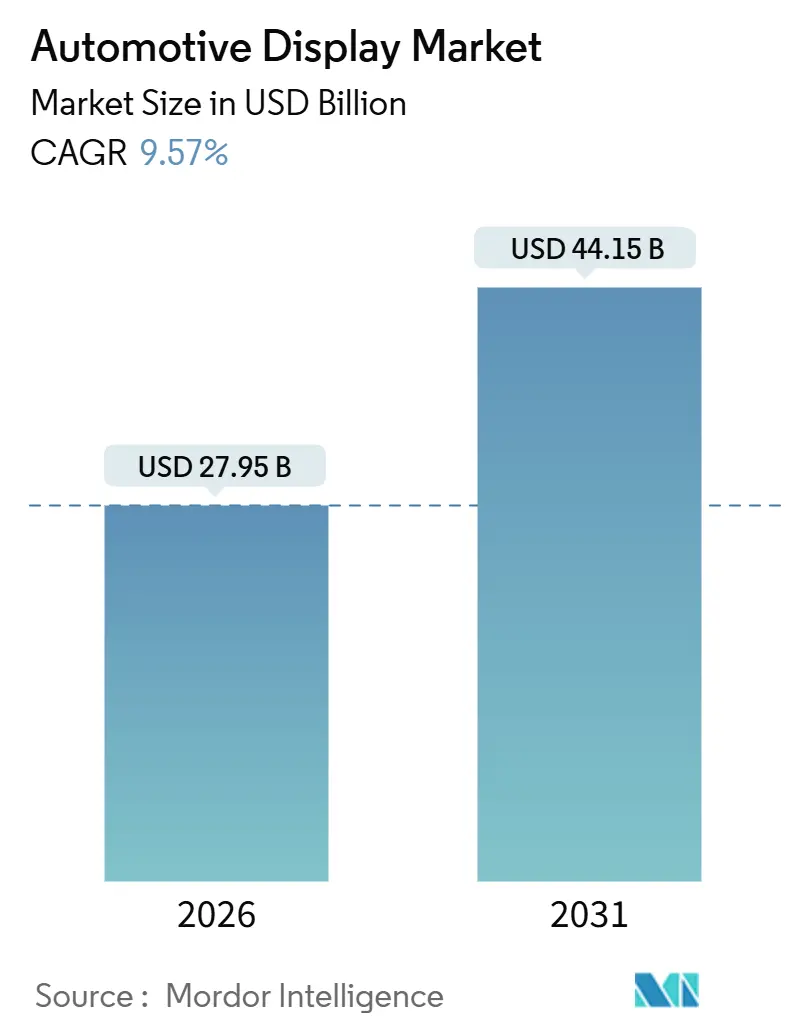
| Market Size (2026) | USD 27.95 Billion |
| Market Size (2031) | USD 44.15 Billion |
| Growth Rate (2026 - 2031) | 9.57% CAGR |
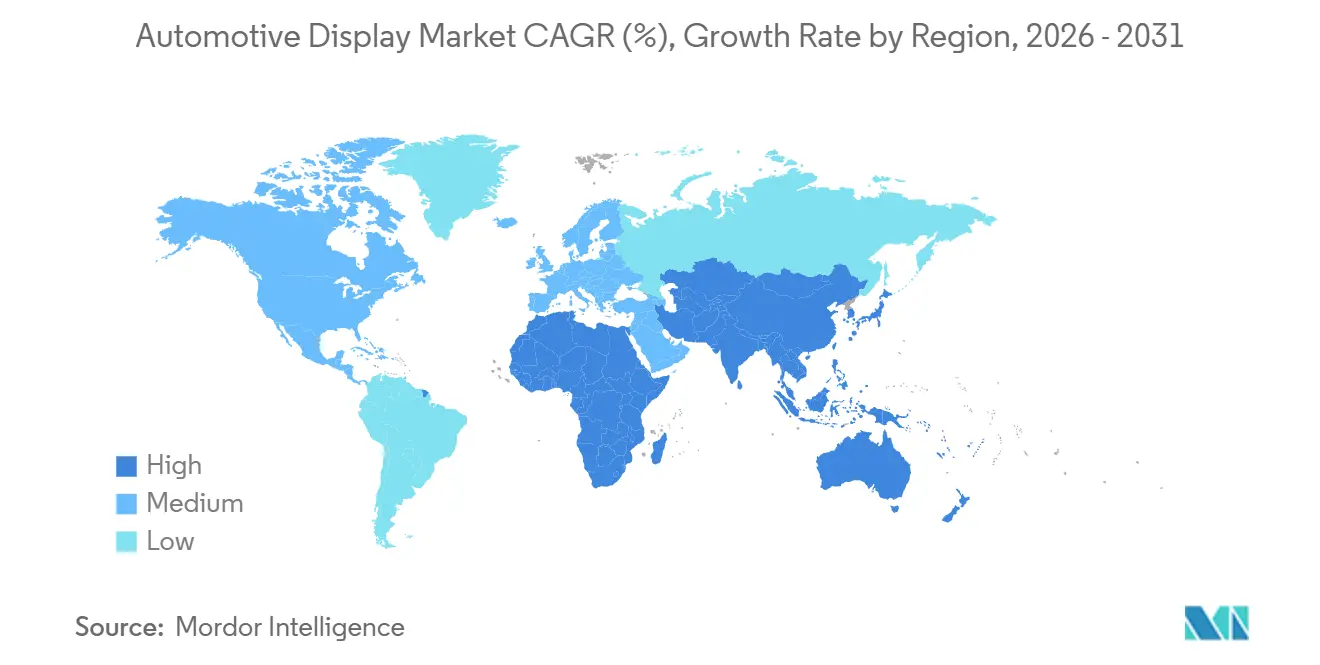
| Fastest Growing Market | Asia Pacific |
| Largest Market | Asia Pacific |
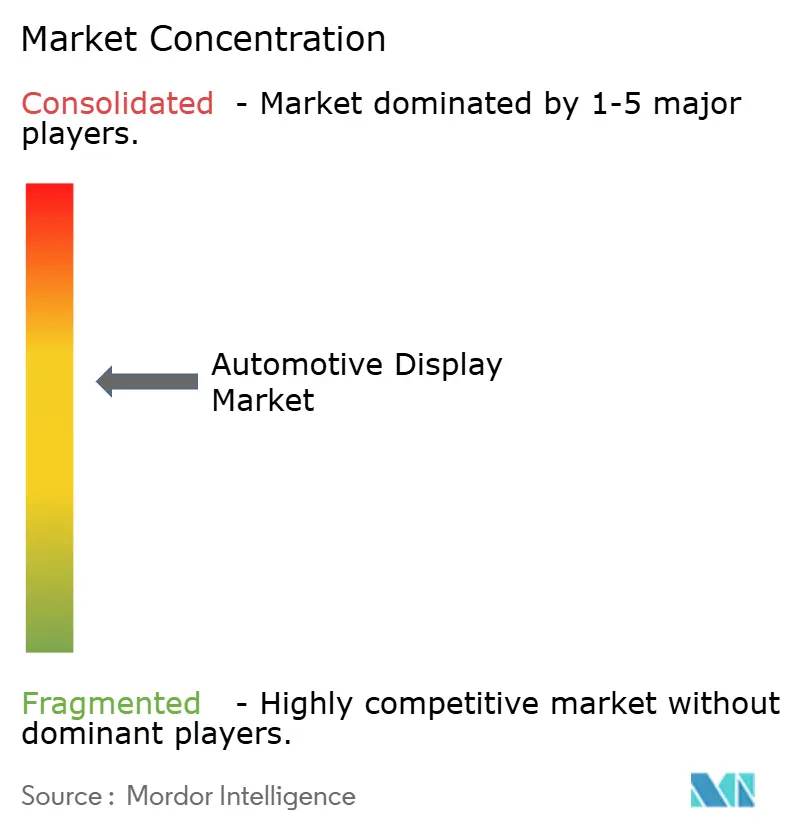
| Market Concentration | Medium |
Major Players *Disclaimer: Major Players sorted in no particular order Image © Mordor Intelligence. Reuse requires attribution under CC BY 4.0. | |
Automotive Display Market Analysis by Mordor Intelligence
The automotive display market size stood at USD 27.95 billion in 2026 and is forecast to reach USD 44.15 billion by 2031, translating into a 9.57% CAGR during the forecast period. Electrification, software-defined vehicle (SDV) architectures, and new driver-distraction protocols are the chief forces shaping the automotive display market. Chinese electric-vehicle (EV) production is scaling rapidly, creating a live test bed for curved AMOLED and pillar-to-pillar screens as local suppliers BOE, CSOT, and Tianma pursue aggressive capacity additions. Regulatory initiatives such as Euro NCAP Driver Engagement Protocol v1.0 are simultaneously rewarding augmented-reality head-up displays (AR-HUDs) while limiting touchscreen placement and reshaping cockpit layouts [1]“Driver Engagement Protocol v1.0,” Euro NCAP, euroncap.com. Liquid-crystal panels continue to dominate in volume, primarily due to their significantly lower price compared to OLED. However, advancements in OLED manufacturing technology expected in the near future are likely to reduce this price disparity. The competition remains intense, as panel manufacturers and tier-1 integrators strive to deliver advanced SDV-ready cockpits. At the same time, challenges such as supply-chain constraints, particularly for display driver ICs, and stringent UNECE cybersecurity regulations are increasing entry barriers.
Key Report Takeaways
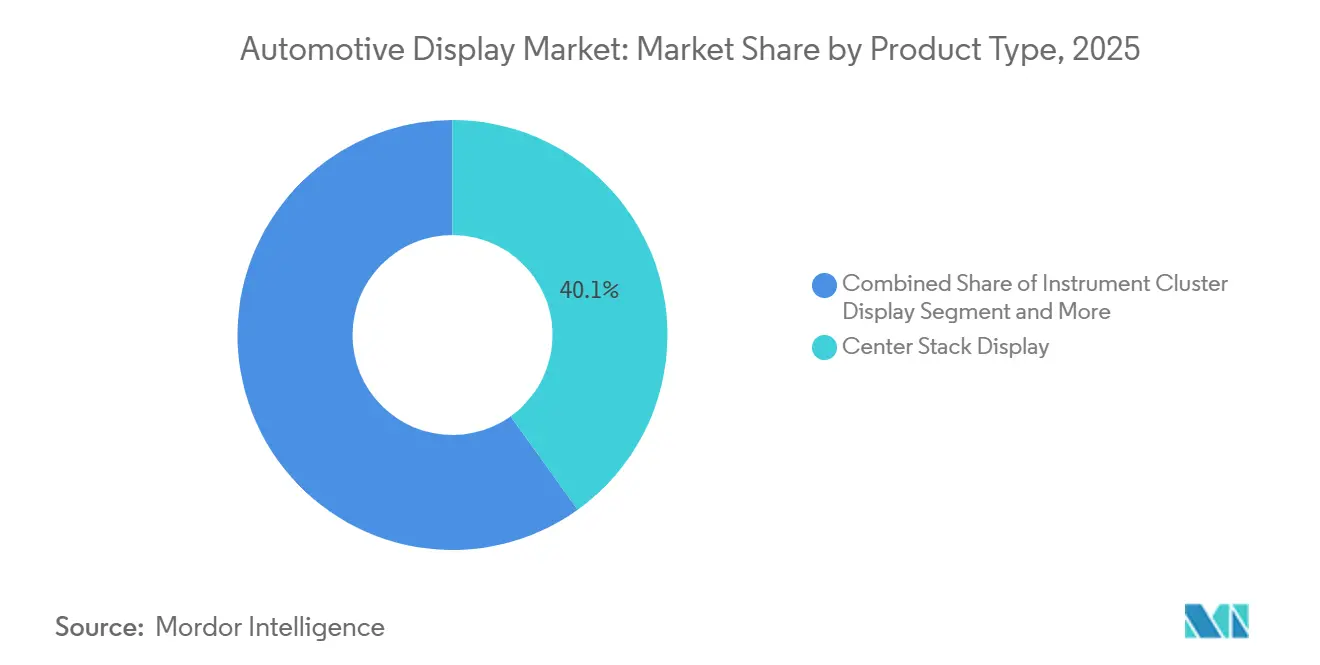
- By product type, center stack displays held 40.12% of the automotive display market share in 2025, while head-up displays are projected to advance at a 10.01% CAGR through 2031.
- By display technology, liquid crystal displays commanded a 65.13% share of the automotive display market size in 2025; yet, OLED units are forecasted to expand at a 10.64% CAGR through 2031.
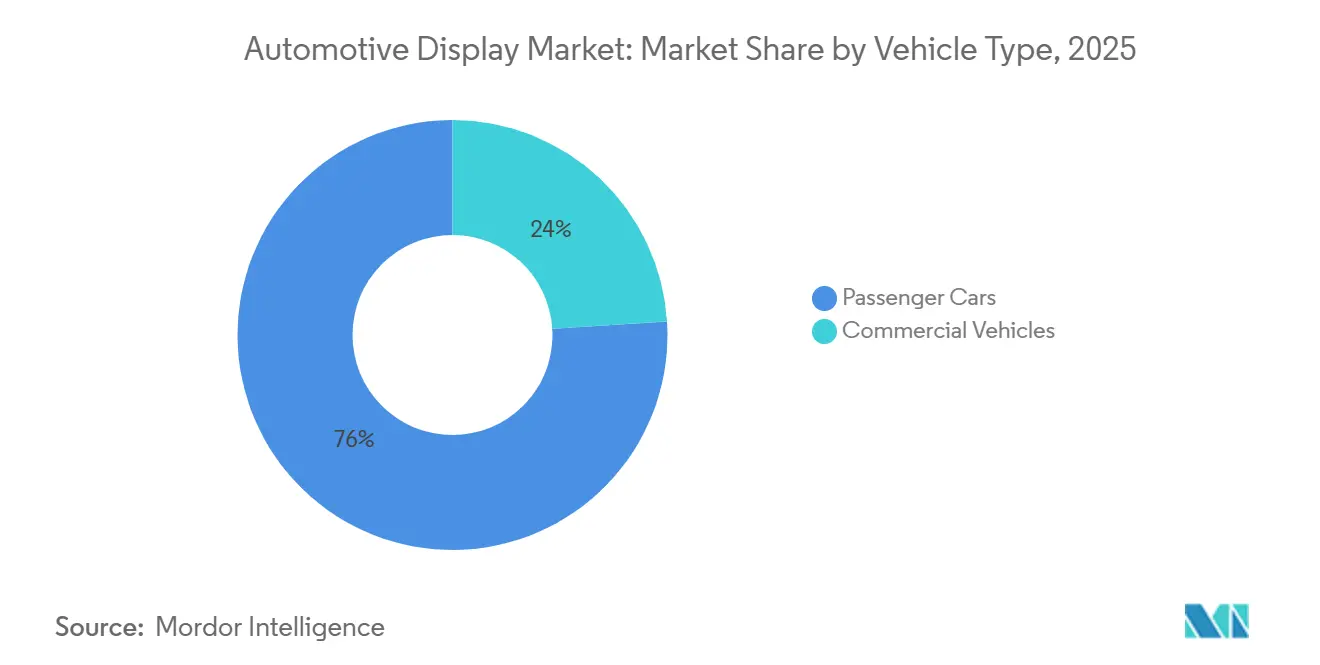
- By vehicle type, passenger cars dominated with a 76.04% market share in 2025; commercial vehicles are the fastest-growing group, with an 11.67% CAGR through 2031.
- By display size, the 6–10 inch category captured 55.41% share of the automotive display market size in 2025, whereas panels above 10 inches are projected to grow at 11.14% CAGR.
- By geography, the Asia-Pacific region accounted for 46.33% of the automotive display market share in 2025 and is projected to grow at a 12.05% CAGR through 2031.
Note: Market size and forecast figures in this report are generated using Mordor Intelligence’s proprietary estimation framework, updated with the latest available data and insights as of January 2026.
Global Automotive Display Market Trends and Insights
Drivers Impact Analysis*
| Driver | (~) % Impact on CAGR Forecast | Geographic Relevance | Impact Timeline |
|---|---|---|---|
| Integrated Digital Cockpit Demand | +2.1% | Asia-Pacific core, spill-over to North America and Europe | Medium term (2-4 years) |
| EV Connectivity Needs Richer HMI | +1.8% | Asia-Pacific, Europe | Long term (≥ 4 years) |
| OEMs Push Pillar-To-Pillar Screens | +1.6% | North America and Europe luxury, China EV brands | Medium term (2-4 years) |
| Affordable High-Brightness LCDs | +1.4% | Global | Short term (≤ 2 years) |
| NCAP Rules Accelerate HUD Fitment | +1.2% | Europe, spill-over to Asia-Pacific and North America | Short term (≤ 2 years) |
| Software-Defined Vehicle OTA | +0.9% | Global, early adoption in North America and China | Long term (≥ 4 years) |
| Source: Mordor Intelligence | |||
Soaring Demand for Integrated Digital Cockpits
Automakers are consolidating instrument clusters, infotainment systems, and climate controls into single domain controllers, reducing wiring mass and freeing up dashboard real estate for larger displays in the automotive display market. Visteon secured USD 1.8 billion in advanced display and SmartCore cockpit orders during Q3 2025, demonstrating how integrated hardware-software stacks win sourcing bids[2]“Q3 2025 Earnings Call Transcript,” Visteon Corporation, visteon.com. Chinese EV makers BYD, NIO, and Xpeng have normalized 12.8-inch AMOLED clusters paired with 14-15-inch center screens, raising the baseline specification for global suppliers. LG Electronics’ Digital Cockpit Alpha fuses POLED, LCD, and AR-HUD into a unified UI linked to driver-monitoring cameras. The architecture shift compresses the supply base because firmware and cybersecurity credentials under UNECE R155 increasingly define vendor eligibility. AUTOSAR Adaptive R24-11 further streamlines over-the-air (OTA) updates, standardizing cockpit refresh cycles well beyond vehicle delivery.
Rise of Connected and Electric Vehicles Needing Richer HMI
Electric drivetrains require visualizations of charging status, regenerative braking, and energy flow, which are absent in internal-combustion dashboards within the automotive display market. China is expected to significantly increase EV production in the near future, boosting the demand for high-resolution rotating displays. The adoption of 5G-enabled V2X services, standardized under ETSI guidelines, is driving the need for expanded HUD fields of view to effectively display cooperative-driving information. Aptiv’s Integrated Cockpit Controller for commercial vehicles integrates telematics and driver monitoring, offering cost-efficient solutions. OLED technology, with its superior contrast ratio and rapid response time, addresses the visualization requirements of premium EVs in the higher price segment. Together, advancements in EVs and connectivity are contributing to an increase in the average display area per vehicle.
OEM Push for Larger Pillar-to-Pillar Screens
Mercedes-Benz introduced a 56-inch Hyperscreen on the EQS, followed by Cadillac Celestiq’s 55-inch curved panel, solidifying ultra-wide screens as a luxury signifier in the automotive display market. Samsung Display’s 2025 deal to supply a 48-inch flexible OLED for the 2028 Mercedes-Maybach signals a pivot from rigid LCD to bendable OLED across dashboards [3]“Maybach Partnership,” Samsung Display Press Release, samsungdisplay.com. Lucid Gravity meticulously stitches three panels into a 34-inch surface, a process that demands exact tolerances and significantly increases the bill of materials. Currently, only a few key players, including LG Display, Samsung Display, and BOE, possess the advanced lamination tools required for automotive panels of this size, consolidating their power as suppliers. Furthermore, through software partitioning, OEMs can monetize the screen's real estate even after the sale, bolstering the revenue model for Software-Defined Vehicles (SDVs).
Rapid Cost-Down of High-Brightness Automotive LCDs
By 2026, low-temperature polysilicon (LTPS) LCDs are expected to significantly increase their market share, driven by the strategic shift of major players, such as Sharp, Japan Display, and AUO, who are repurposing their smartphone production lines for automotive applications. At the same time, mini-LED backlights are closing the performance gap with OLEDs by offering advanced features at a more competitive cost, while the industry continues to develop micro-LED technology. In 2024, automotive LCD prices have shown a noticeable decline, influenced by higher production efficiency in key manufacturing regions. Additionally, advancements such as Corning's innovative Gorilla Glass for automotive use have reduced module weight, making the feasibility of curved LCD designs possible. These developments reinforce LCD's strong position in the automotive display market, particularly for cost-sensitive, high-volume vehicle segments.
Restraints Impact Analysis*
| Restraint | (~) % Impact on CAGR Forecast | Geographic Relevance | Impact Timeline |
|---|---|---|---|
| Automotive-Grade OLED Pricing | –0.8% | Global, acute in mass-market segments | Medium term (2-4 years) |
| Glass and Semiconductor Supply Volatility | –0.6% | Global, acute in Asia-Pacific supply chains | Short term (≤ 2 years) |
| Cybersecurity Compliance Costs | –0.4% | Europe, Japan, South Korea, and expanding to North America | Medium term (2-4 years) |
| Large Flexible Display Issues | –0.3% | Global, acute in the luxury segment | Long term (≥ 4 years) |
| Source: Mordor Intelligence | |||
Premium Pricing of Automotive-Grade OLEDs
Automotive OLED panels are significantly more expensive than their LCD counterparts, reflecting lower manufacturing yields for OLEDs compared to consumer OLEDs within the automotive display market. Additionally, burn-in mitigation introduces firmware overhead, which reduces the usable area and further increases costs. LG Display is investing heavily in its next-generation manufacturing facility, which is expected to become operational in the near future, aiming to significantly reduce production costs. However, the return on this investment is anticipated to take several years. Since the cost premium represents a small fraction of a luxury car's price, adoption remains concentrated in the luxury segment, with limited penetration in the mass market expected over the next several years. Moreover, the limited number of suppliers, including LG Display, Samsung Display, and BOE, poses volume risks for OEMs.
Glass and Semiconductor Supply Volatility
In 2024, foundries prioritized higher-margin segments, significantly extending display driver IC (DDIC) lead times in the automotive display market. While major players in the industry announced substantial investments to enhance automotive DDIC capacity, the expansion is expected to take several years to materialize. During the second quarter of 2024, energy-rationing shutdowns impacted key glass manufacturers in Europe, necessitating the use of alternative materials and delaying product launches. Chinese OEMs have increased their inventory of critical display components, tying up considerable working capital for their production programs. These disruptions are accelerating a shift towards vertical integration, as demonstrated by BYD's efforts to develop DDICs internally.
*Our forecasts treat driver/restraint impacts as directional, not additive. The impact forecasts reflect baseline growth, mix effects, and variable interactions.
Segment Analysis
By Product Type: HUD Momentum Overtakes Center Stacks
Center stack screens held a 40.12% share of the automotive display market in 2025; however, Head-Up Display (HUD) shipments are rising at a 10.01% CAGR, driven by Euro NCAP incentives. Continental’s AR-HUD on the Volkswagen ID.7 shortens dashboard glance time, adding tangible safety benefits [4]“AR-HUD Tech Briefing,” Continental AG, continental-corporation.com. Instrument clusters, historically analog-digital hybrids, are undergoing 12.3-inch full-digital upgrades in commercial vehicles as EU General Safety Rules demand clear ADAS readouts.
Center stacks face margin compression as Chinese suppliers flood the market with 10.25-inch LCD modules, offering a significant discount to Japanese and Korean units. However, Western OEMs hesitate to dual-source due to UNECE cybersecurity stipulations. Panasonic’s eye-tracking HUD for Subaru adapts brightness to pupil dilation, differentiating itself from competitors in an increasingly commoditized center-stack space. The automotive display market size for HUDs is forecast to expand significantly by 2030, with AR-HUD capturing the steepest curve. Rear-seat entertainment remains a niche market, with lower adoption rates restrained by subscription costs, but ultra-wide 31-inch Theatre Screens from BMW suggest pent-up demand for luxury.


By Display Technology: OLED Ascends Luxury, LCD Anchors Volume
Liquid crystal technology maintained a 65.13% share of the automotive display market in 2025, due to its low cost and established supply chain. Organic Light-Emitting Diode (OLED), however, is expanding at 10.64% CAGR, buoyed by Mercedes-Maybach’s 48-inch flexible dash and BYD’s adoption of 15-inch AMOLED clusters. By delivering high resolutions at a significantly lower cost compared to OLED, LTPS-LCD is expected to dominate a substantial share of the automotive LCD output by 2026.
Mini-LED serves as a temporary high-contrast solution, as demonstrated by AUO's advanced panel featuring numerous zones set to ship soon. While Micro-LED is still in its pre-commercial phase, its current mass-transfer yields result in defects that do not meet the stringent standards required in the automotive industry. Thus, the technological hierarchy positions LCDs for mainstream platforms, OLEDs for luxury cabins, mini-LEDs as a compromise, and anticipates micro-LEDs to mature post-2028.
By Vehicle Type: Commercial Fleets Accelerate Digitization
Passenger cars generated 76.04% of unit demand in 2025, but commercial vehicles are outpacing at 11.67% CAGR as fleet managers chase compliance with the EU General Safety Regulation 2022/1426. Daimler Truck’s Actros features dual 12-inch screens, significantly reducing wiring time per cab. Volvo’s 2024 VNL series updates UX over-the-air, reducing downtime for cross-country hauls.
Aptiv's cockpit controller substantially lowers integration costs, making display upgrades more practical for vehicles that typically remain in service for extended periods. In passenger cars, Chinese rivals depress average selling prices, yet cybersecurity hesitation slows their penetration into Western OEM programs. Commercial vehicles thus present a clearer growth curve within the automotive display market.
By Display Size: Large-Format Adoption Redefines Dashboards
Panels measuring 6–10 inches dominated the market, accounting for a 55.41% share in 2025, reflecting their widespread use in clusters and center stacks. Displays above 10 inches, however, are advancing at 11.14% CAGR, propelled by Mercedes-Benz’s 56-inch Hyperscreen and BMW’s 31.3-inch rear-seat theatre screen. Screens under 5 inches—used for camera mirrors and A-pillar monitors—remain niche but are expected to grow as UNECE R46 permits mirror replacement to reduce aerodynamic drag.
Lucid’s three-panel 34-inch Clearview Cockpit shows how software-defined zones convert large real estate into revenue through subscription UI layouts. Samsung Display’s planned 48-inch flexible OLED will further legitimize ultra-wide formats when it is brought to market by Maybach in 2028. Cooling and lamination challenges remain, yet advanced glass and thermal pads are mitigating hotspots, setting the stage for mainstream large-format growth after 2027.
Geography Analysis
The Asia-Pacific region led with a 46.33% automotive display market share in 2025 and is projected to expand at a 12.05% CAGR through 2031. China's EV surge is driving significant advancements in cockpit technology, with innovations such as rotating screens and AR-HUDs gaining traction. Leading display manufacturers are heavily investing in production capacities to ensure domestic OEMs maintain robust inventory buffers, surpassing the norms seen in Western supply chains. Meanwhile, Japan's established players are shifting their focus to vehicle displays after losing ground in the smartphone market to Chinese competitors. This strategic pivot is accompanied by partnerships aimed at revitalizing their market presence. In South Korea, efforts are underway to vertically integrate display production for key automotive brands, addressing ongoing supply chain challenges.
Europe and North America are witnessing slower growth in vehicle units, but are rapidly adopting advanced features. Regulatory standards in Europe are driving the integration of AR-HUDs across major automotive line-ups, despite the associated cost premiums. Cybersecurity regulations are also reshaping the supplier landscape, increasing the complexity of integration for new entrants without the necessary certifications. In North America, feature adoption lags behind Europe due to the absence of similar regulatory policies. However, premium automotive brands are incorporating advanced display technologies to align with European benchmarks.
Emerging markets in South America and the Middle East & Africa present growth opportunities. In South America, retrofitting activities are gaining momentum as affordable Android head units enter the aftermarket space, although regulatory challenges limit broader adoption. In the Middle East, there is a preference for premium displays in luxury imports, but smaller vehicle bases constrain scalability. Turkey is adapting its commercial vehicle production to meet European safety standards, while in South Africa, high tariffs are restricting adoption to premium segments.

Competitive Landscape
Combined revenue of LG Display, Samsung Display, BOE, Continental, and Denso reached a notable share of the automotive display market in 2025, signaling moderate concentration. LG Display’s 8.6-generation OLED fab, operational in 2026, aims to cut panel costs significantly, while BOE’s Chengdu line counters with 27-inch flexible panels for domestic EVs. Visteon, Continental, and Bosch are converging on hardware, middleware, and cybersecurity into a single cockpit domain controller. Visteon’s SmartCore posted USD 1.8 billion in new awards in Q3 2025.
Disruptive niches are forming around AR-HUD optics. Envisics raised USD 50 million in Series C funding and signed supply agreements with GM and Hyundai, an area where optical expertise outperforms volume manufacturing. While Chinese LCD manufacturers offer significantly lower prices than their competitors, they face skepticism regarding UNECE cyber-compliance, hindering their penetration into Western OEMs. Technology differentiation remains decisive: Samsung Display’s dashboard-width flexible OLED, set to debut on the 2028 Maybach, illustrates form-factor leadership, while AUO’s mini-LED delivers OLED-like contrast at a lower cost.
Vertical integration is intensifying. BYD now designs in-house DDICs, Geely has equity stakes in panel makers, and Hyundai Mobis invests in local module lines to shield against shortages. Emerging micro-LED specialists PlayNitride and Plessey exhibited HUD prototypes at CES 2025, offering a 30% lower power draw than OLED; however, commercialization hinges on mass-transfer yield breakthroughs expected after 2028.
Automotive Display Industry Leaders
Denso Corporation
Robert Bosch GmbH
Visteon Corporation
Continental AG
LG Display Co., Ltd.
- *Disclaimer: Major Players sorted in no particular order

Recent Industry Developments
- September 2025: SJS Enterprises and BOE Varitronix signed an MoU to localize display assembly and optical bonding for India’s four-wheeler sector.
- July 2025: Samsung Display secured exclusive rights to supply a dashboard-spanning AMOLED for the 2028 Mercedes-Maybach S-Class.
- June 2025: HARMAN unveiled Neo QLED automotive displays debuting on Tata Harrier.ev, bringing consumer-grade brightness and contrast to vehicles.
- February 2025: LG Display began mass production of a 40-inch pillar-to-pillar automotive OLED aimed at SDV cockpits.


Global Automotive Display Market Report Scope
The scope includes segmentation by product type (center stack display, instrument cluster display, head-up display, and rear-seat entertainment display), display technology (LCD, OLED, and MiniLED / MicroLED), vehicle type (passenger cars and commercial vehicles), and display size (less than or equal to 5-inch, 6 to 10 inch, and above 10 inch). The analysis also covers regional-level segmentation, including North America, South America, Europe, Asia-Pacific, the Middle East, and Africa. Market size and growth forecasts are presented by value in USD.
By Product Type
| Center Stack Display |
| Instrument Cluster Display |
| Head-Up Display |
| Rear-Seat Entertainment Display |
By Display Technology
| Liquid Crystal Display (LCD) |
| Organic Light-Emitting Diode (OLED) |
| MiniLED / MicroLED |
By Vehicle Type
| Passenger Cars |
| Commercial Vehicles |
By Display Size
| Less than equal to 5-inch |
| 6 to 10 inch |
| Above 10 inch |
By Geography
| North America | United States |
| Canada | |
| Rest of North America | |
| South America | Brazil |
| Argentina | |
| Rest of South America | |
| Europe | Germany |
| United Kingdom | |
| France | |
| Rest of Europe | |
| Asia-Pacific | China |
| Japan | |
| India | |
| South Korea | |
| Rest of Asia-Pacific | |
| Middle East and Africa | United Arab Emirates |
| Saudi Arabia | |
| Egypt | |
| Turkey | |
| South Africa | |
| Rest of Middle East and Africa |
| By Product Type | Center Stack Display | |
| Instrument Cluster Display | ||
| Head-Up Display | ||
| Rear-Seat Entertainment Display | ||
| By Display Technology | Liquid Crystal Display (LCD) | |
| Organic Light-Emitting Diode (OLED) | ||
| MiniLED / MicroLED | ||
| By Vehicle Type | Passenger Cars | |
| Commercial Vehicles | ||
| By Display Size | Less than equal to 5-inch | |
| 6 to 10 inch | ||
| Above 10 inch | ||
| By Geography | North America | United States |
| Canada | ||
| Rest of North America | ||
| South America | Brazil | |
| Argentina | ||
| Rest of South America | ||
| Europe | Germany | |
| United Kingdom | ||
| France | ||
| Rest of Europe | ||
| Asia-Pacific | China | |
| Japan | ||
| India | ||
| South Korea | ||
| Rest of Asia-Pacific | ||
| Middle East and Africa | United Arab Emirates | |
| Saudi Arabia | ||
| Egypt | ||
| Turkey | ||
| South Africa | ||
| Rest of Middle East and Africa | ||


Key Questions Answered in the Report
What was the global value of the automotive display market in 2026?
The market stood at USD 27.95 billion in 2026.
Which region leads demand for automotive displays?
Asia-Pacific held 46.33% share in 2025 and is growing at the fastest 12.05% CAGR.
Why are head-up displays gaining traction?
Euro NCAP’s 2025 distraction protocol awards safety points for AR-HUD, driving OEM adoption.
What supply-chain risks affect display availability?
DDIC lead times stretched to 26-52 weeks in 2024, and glass plants faced energy-rationing shutdowns, prompting OEMs to stock 90-120 days of inventory.
Page last updated on:


