Assembly Line Solutions Market Size and Share
Market Overview
| Study Period | 2020 - 2031 |
|---|---|
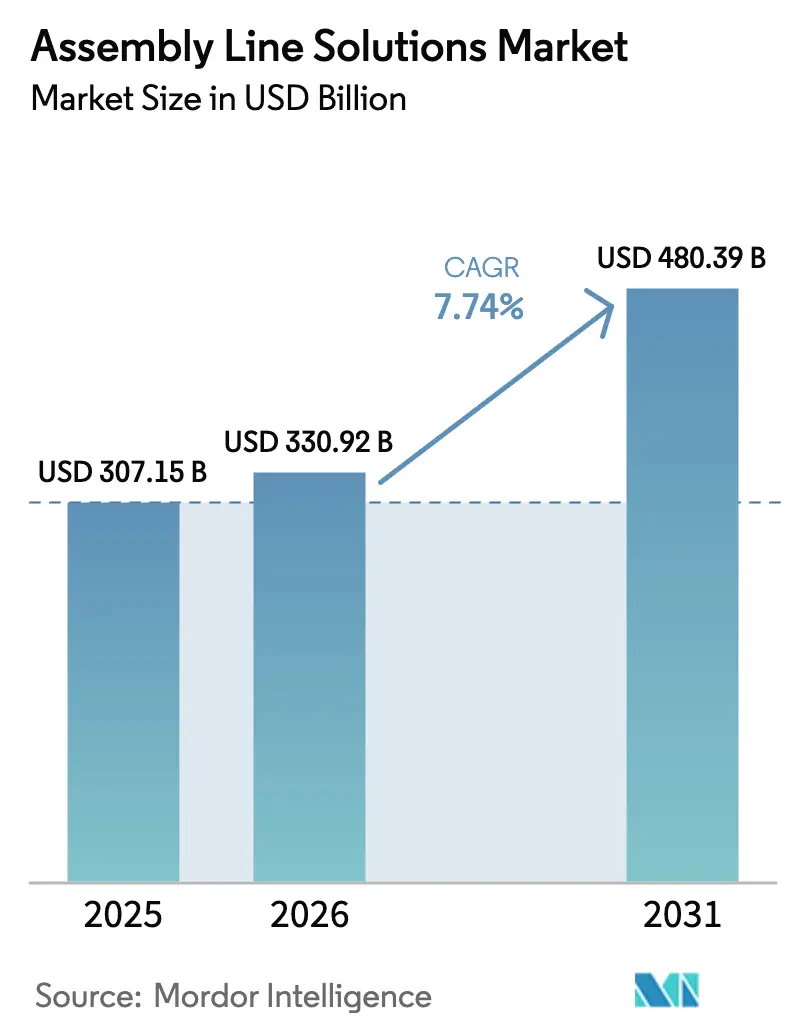
| Market Size (2026) | USD 330.92 Billion |
| Market Size (2031) | USD 480.39 Billion |
| Growth Rate (2026 - 2031) | 7.74% CAGR |
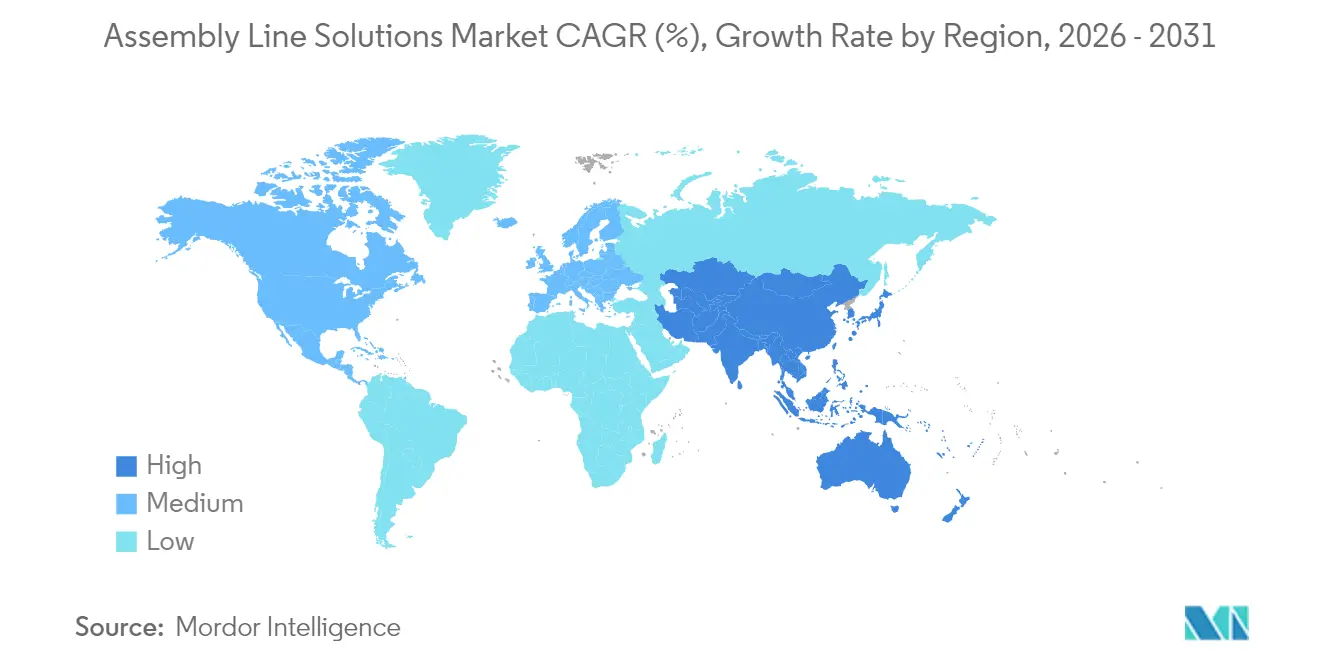
| Fastest Growing Market | Asia Pacific |
| Largest Market | Asia-Pacific |
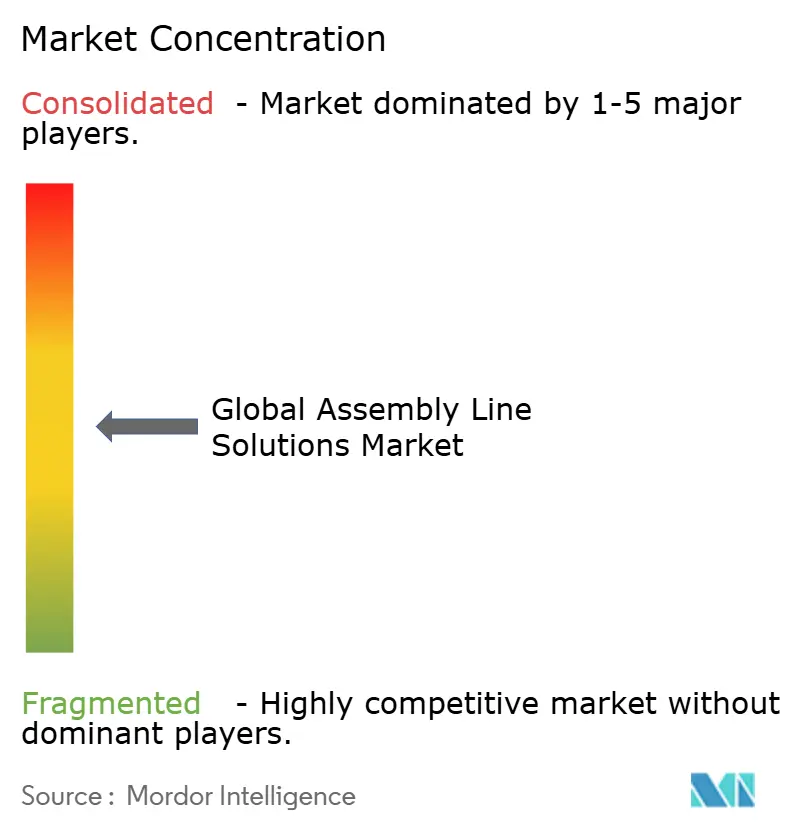
| Market Concentration | Medium |
Major Players *Disclaimer: Major Players sorted in no particular order Image © Mordor Intelligence. Reuse requires attribution under CC BY 4.0. | |
Assembly Line Solutions Market Analysis by Mordor Intelligence
The Global Assembly Line Solutions Market size was valued at USD 307.15 billion in 2025 and estimated to grow from USD 330.92 billion in 2026 to reach USD 480.39 billion by 2031, at a CAGR of 7.74% during the forecast period (2026-2031). Heightened investment in Industry 4.0 platforms, sustained labor shortages, and the pivot toward electric vehicles are accelerating capital flows into advanced assembly technologies. Semi-automated configurations still dominate installed bases, yet fully automated, lights-out cells are being adopted at the fastest pace as manufacturers seek round-the-clock productivity with minimal human intervention. Asia-Pacific remains the principal growth engine because Chinese, Indian, and ASEAN plants are scaling robotics to meet surging electronics and automotive demand. Rising wage costs in North America and Europe are also tightening payback periods for automation projects, prompting manufacturers to expand digital twin pilots and autonomous mobile robot fleets. Competitive differentiation is shifting from hardware specifications to software-driven flexibility as vendors bundle AI, simulation, and predictive maintenance within integrated ecosystems.
Key Report Takeaways
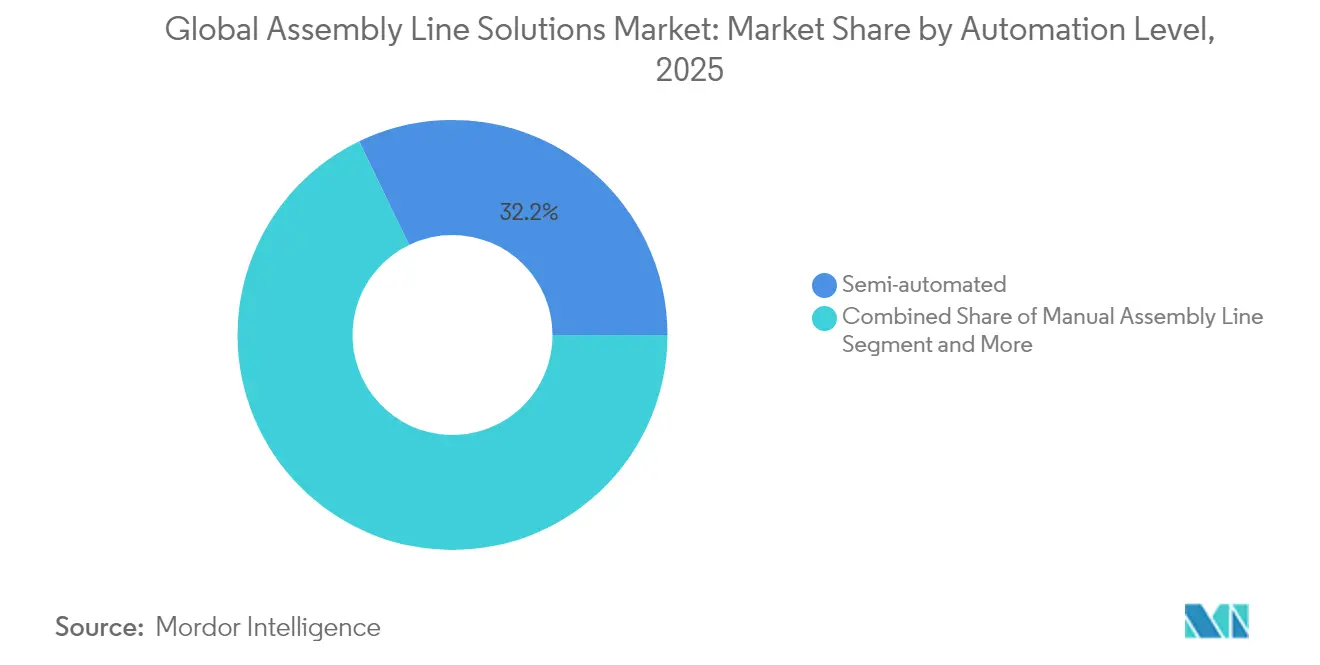
- By automation level, semi-automated lines captured 32.15% of the assembly line solutions market share in 2025; fully automated systems are projected to expand at a 10.34% CAGR through 2031.
- By end-user industry, automotive led with 35.06% revenue share in 2025, while electronics and semiconductors are set to grow at 10.27% CAGR to 2031.
- By component, robotics and end-effectors accounted for a 32.12% share of the assembly line solutions market size in 2025 and are forecast to post a 10.72% CAGR over 2026-2031.
- By geography, Asia-Pacific held 43.94% of the assembly line solutions market size in 2025 and is advancing at an 8.11% CAGR through 2031.
Note: Market size and forecast figures in this report are generated using Mordor Intelligence’s proprietary estimation framework, updated with the latest available data and insights as of 2026.
Global Assembly Line Solutions Market Trends and Insights
Drivers Impact Analysis*
| Driver | (~) % Impact on CAGR Forecast | Geographic Relevance | Impact Timeline |
|---|---|---|---|
| Industry 4.0 adoption & smart-factory mandates | +2.1% | Global; APAC leading | Medium term (2-4 years) |
| Labour shortages in skilled manufacturing roles | +1.8% | North America & EU | Short term (≤ 2 years) |
| Wage inflation driving return on automation investments | +1.5% | Global; developed markets | Short term (≤ 2 years) |
| EV production ramp-up demanding flexible lines | +1.3% | Global; automotive hubs | Medium term (2-4 years) |
| Government CapEx incentives for automation | +0.9% | US, EU, China | Long term (≥ 4 years) |
| Micro-component miniaturisation in electronics | +0.4% | APAC core | Long term (≥ 4 years) |
| Source: Mordor Intelligence | |||
Industry 4.0 Adoption & Smart-factory Mandates
Manufacturers are moving from fixed conveyor layouts to adaptive, AI-orchestrated workcells that respond to real-time performance data. ABB’s USD 150 million Shanghai facility runs flexible production cells equipped with autonomous robots that re-route parts without human intervention, enabling shorter changeover windows and higher line utilization. Digital twin deployment is scaling rapidly; 47% of plant managers rate the technology as essential for 2040 operations because it lets teams test tooling, sequencing, and workforce models virtually before making physical changes. Visual SLAM navigation, combined with AI path planning, is turning linear assembly systems into dynamic networks where mobile robots deliver components just-in-time, supporting smaller lot sizes without productivity sacrifice.
Labour Shortages in Skilled Manufacturing Roles
U.S. factories face 2.1 million unfilled jobs by 2030, a gap that is already pushing operational leaders toward accelerated robotics adoption[1]Source: William A. Strauss, “Labor Shortages and Capital Deepening in U.S. Manufacturing,” Federal Reserve Bank of St. Louis Review, stlouisfed.org. A Federal Reserve study links every incremental uptick in labor-shortage mentions within earnings calls to a 28-basis-point jump in automation spending, translating to roughly USD 55 billion in extra investment since 2021. Companies deploying automation are recording 8.9 basis-point productivity lifts within four quarters, while 2023 industrial-robot orders rose 14% as firms raced to shore up throughput. Food and beverage processors exemplify the shift: 78% of their automation projects now explicitly target labor gaps, and 48% of capital budgets are earmarked for robotics and vision systems.
Wage Inflation Driving Return on Automation Investments
Rising compensation costs in developed economies have compressed breakeven thresholds for automated assembly assets. Firms targeting two-year ROI windows find that higher wages trim payback by several months, especially when combined with improved overall equipment effectiveness. Predictable hardware leasing models often structured as Robotics-as-a-Service are gaining traction because they convert automation costs into operating expenses while ensuring access to the latest software updates. Government provisions such as the U.S. Section 179 tax deduction, allowing up to USD 1.22 million in qualifying equipment write-offs, further sweeten payback equations[2]Source: Janet Yellen, “Section 179 Deduction: 2025 Inflation Adjustments,” U.S. Department of the Treasury, home.treasury.gov.
EV Production Ramp-up Demanding Flexible Lines
Electric vehicle rollouts require assembly cells that can process both internal-combustion and battery platforms. Ford’s USD 2 billion Cologne hub introduced more than 600 robots with AI-based monitoring to handle drivetrain variability without adding downtime. At Togg in Turkey, 250 robots now produce 20 vehicles per hour under a unified digital-twin environment supplied by Dürr, illustrating how startups bypass legacy constraints and scale from day one. In 2023, more than half of Dürr’s automotive orders were tied to battery-electric programs, highlighting the momentum behind flexible, software-defined production architectures.
Restraints Impact Analysis*
| Restraint | (~) % Impact on CAGR Forecast | Geographic Relevance | Impact Timeline |
|---|---|---|---|
| High capital intensity and long ROI cycles | −1.4% | Global; SMEs hardest hit | Medium term (2-4 years) |
| Integration difficulties with legacy systems and brownfield plants | −1.1% | Developed markets | Long term (≥ 4 years) |
| Scarcity of cross-functional talent in robotics, AI, and systems integration | −0.8% | Global | Medium term (2-4 years) |
| Cybersecurity threats for networked production assets | −0.6% | Global; critical industries | Short term (≤ 2 years) |
| Source: Mordor Intelligence | |||
High Capital Intensity and Long ROI Cycles
Robotic workcells cost USD 175,000 to USD 400,000, depending on payload and complexity. Many small and midsize plants target two-year paybacks at 85% overall equipment effectiveness, a hurdle that delays adoption when production volumes fluctuate[3]Source: Robert Bach, “Robotic Workcell Cost Benchmarks for SMEs,” Business Development Bank of Canada (BDC) Research Note, bdc.ca. Subscription-based robot models are helping these firms smooth cash flows, yet the need for line redesign and operator retraining keeps total project costs elevated. Public financing and tax incentives play a pivotal role; without them, SMEs defer full automation in favor of incremental upgrades.
Integration Difficulties with Legacy Systems and Brownfield Plants
Manufacturers maintain USD 2.65 trillion worth of aging automation assets whose proprietary interfaces resist seamless data exchange. Connecting such equipment to modern IoT frameworks demands custom middleware and specialized engineering skills that are in short supply. The Open Process Automation Forum is working on O-PAS interoperability standards, and pilots at ExxonMobil and BASF show multi-vendor architectures can trim upgrade costs[4]Source: Linda Freeman, “Open Process Automation Standards Gain Momentum,” Open Process Automation Forum White Paper, opaforum.org. Still, until universal protocols mature, integration remains a drag on project timelines.
*Our forecasts treat driver/restraint impacts as directional, not additive. The impact forecasts reflect baseline growth, mix effects, and variable interactions.
Segment Analysis
By Automation Level: Shifting from Hybrid to Lights-out Workflows
Semi-automated lines held 32.15% of the assembly line solutions market in 2025 as manufacturers blended manual dexterity with robotic repeatability to balance cost and flexibility. Mixed workcells often use collaborative robots that workers load in cycles shorter than 10 seconds, demonstrating a pragmatic route toward higher throughput without full layout overhauls. The assembly line solutions market size for fully automated configurations is rising quickly, supported by a 10.34% CAGR that outpaces every other throughput strategy. Xiaomi’s Beijing facility illustrates the trajectory: 11 lines run wholly unattended for core processes and achieve three-second cycle times by allowing AI engines to tune path planning in real time. Manual assembly remains vital for niche SKUs or fragile components, yet 87% of plants still perform at least one station manually, showing that the transition path will be gradual rather than abrupt.
Manufacturers typically phase in automation to validate ROI on straightforward, high-frequency tasks before moving toward systemwide autonomy. Cobots serve as transitional tools by sharing space safely with technicians, reducing anxiety over job displacement and widening the labor pool for higher-value programming roles. As software controls mature, the assembly line solutions market size for fully automated modules is predicted to expand further because plants can swap modular grippers and tooling with minimal downtime. Enterprises that master data analytics from day one cut cycle variation by double-digit percentages, underscoring the correlation between robust IT foundations and successful automation scaling.


By End-user Industry: Automotive Holds Sway as Electronics Accelerates
Automotive producers commanded 35.06% of 2025 revenue after decades of pioneering robotic welding, paint, and final-trim stations. Capital allocation has ramped higher as electric powertrain assembly demands new battery joining, sealing, and safety checks that human operators cannot replicate at speed. Electronics and semiconductor plants, however, are posting the fastest 10.27% CAGR because smartphones, wearables, and automotive chips rely on surface mount technology for more than 90% of printed-circuit board assemblies. These ultra-dense boards need vision-guided pick-and-place systems accurate to sub-micron tolerances, propelling demand for premium feeders, feeders, and reflow ovens.
Consumer goods lines are automating to ensure uniform quality, while pharmaceutical and healthcare producers adopt isolation and sterile robotics to meet stringent contamination thresholds. Food and beverage makers, traditionally slower to automate, now allocate 48% of capital spending to robotic palletizing, case packing, and inline inspection modules. That pivot is amplified by stringent hygiene codes and the shortage of labor willing to work repetitive shifts in cold or wet rooms. Each sector’s trajectory reinforces a common message: line flexibility, data transparency, and hygiene compliance will define the next phase of the assembly line solutions market.
By Component: Robotics and End-effectors at the Core of Investment Math
Robotics and end-effectors captured the largest 32.12% revenue share in 2025, reflecting their central role in automated throughput. The niche is also growing the fastest at 10.72% CAGR because gripper variety, force-torque sensing, and AI algorithms unlock new use cases such as battery stacking and delicate semiconductor die transfer. Enabling technologies reinforce that growth; the global market for robotic sensors is poised to advance from USD 1.9 billion in 2023 to USD 4.9 billion in 2033, led by torque sensors that more than double over the period. Conveyors and transfer systems are evolving from fixed paths to plug-and-play magnetic shuttles that dynamically reroute carriers, thereby minimizing tooling changeover.
Sensors and vision modules have grown smarter via embedded AI that flags defects earlier and feeds corrective loops to motion controllers. The intelligence layer resides in controllers and software suites that now autonomously optimize part flow and energy consumption, reducing downtime by double digits. Lastly, safety and ergonomic modules are broadening with laser scanners, light curtains, and safe-motion drives that enable closer human-robot collaboration without physical cages. All these innovations are critical to unlocking step-function productivity gains within the assembly line solutions market.

Geography Analysis
Asia-Pacific dominated with 43.94% revenue in 2025, powered by China’s USD 6.6 billion industrial-robot ecosystem that supplies both domestic factories and export demand. The region’s 8.11% CAGR through 2031 is anchored in aggressive policy incentives, low robot prices, and a vast pipeline of electronics and battery projects. China accounts for 52% of global robot installations, and home-grown players such as Midea Group and Estun Automation are challenging international incumbents on price and after-sales coverage, particularly within tier-two manufacturing clusters. India and ASEAN nations are following suit: the Philippines targets 128,000 additional technicians by 2028 to feed its semiconductor expansion, signaling fertile ground for incremental robot shipments.
North America registered 44,303 industrial-robot orders in 2023, up 12%, driven by EV powertrain investments and a rebound in electronics assembly. Federal tax deductions and state-level packages, like Illinois’ USD 827 million incentives for Rivian, are accelerating uptake. The United States is also seeing regional programs such as North Dakota’s Automate ND grant, which channels USD 5 million into 18 factory projects, underscoring how localized funding complements federal measures. European demand is slower as energy costs, inflation, and deindustrialization weigh on capital budgets. The European Union’s EUR 200 billion InvestAI fund aims to reverse that trend by building four AI gigafactories that weave predictive analytics and autonomous production systems into automotive supply chains.
In the Middle East and Africa, automation demand is tied to petrochemical diversification and consumer-goods localization, but supply-chain bottlenecks and skills gaps keep penetration below global averages. Latin American adoption remains modest, although automotive clusters in Mexico and Brazil are testing collaborative robots to offset currency volatility and wage inflation. Each region’s unique mix of policy, labor availability, and energy pricing will shape local trajectories, but the global assembly line solutions market continues to revolve around APAC’s scale advantages and North America’s technology depth.

Competitive Landscape
Competition is moderate but intensifying. Industry pillars such as ABB, Siemens, and KUKA have doubled down on AI integration and software-centric differentiation to stay ahead of nimble startups that leverage cloud-native architectures. ABB completed the purchase of Sevensense for AI-enabled 3D navigation and announced a plan to spin off its USD 2.3 billion robotics unit to sharpen strategic focus. Siemens, for its part, bought Altair Engineering to fold simulation-driven digital twins deeper into its automation stack. KUKA has expanded its mobile robot lineup and stitched tighter links between its KR C5 controller and edge analytics suites.
Specialists are entering with vertical know-how. Hitachi acquired MA Micro Automation to deepen its footprint in medical devices, while Pacteon’s buyout of Descon Integrated Conveyor Solutions strengthens its food-and-beverage conveyor expertise. Robotics-as-a-Service models are reshaping revenue flows: subscription offerings from firms like Lucid Bots provide smaller customers access to autonomous cleaning and handling robots without hefty capex, fostering stickier vendor relationships. Local champions in China, supported by provincial incentives, are winning share by bundling robots, conveyors, and MES software at price points global brands struggle to match.
Software ecosystems are the new battleground. ABB’s global startup challenge invites early-stage companies to build AI algorithms atop its open API, catalyzing external innovation pipelines. Siemens’ Xcelerator marketplace, meanwhile, packages simulation, PLC code, and maintenance analytics under one subscription, locking customers into long-term licenses. The result is a competitive arena where hardware margins erode while recurring software revenue and domain-specific expertise command the premium.
Assembly Line Solutions Industry Leaders
ACRO Automation Systems, Inc.
Hochrainer GmbH
JR Automation
Central Machines, Inc.
Totally Automated Systems
- *Disclaimer: Major Players sorted in no particular order

Recent Industry Developments
- April 2025: ABB disclosed plans to spin off its robotics division, which generated USD 2.3 billion in 2024 revenue, aiming to heighten customer focus while collaborating with Automated Architecture on robot-powered micro-factories.
- February 2025: Apple pledged USD 500 billion for U.S. manufacturing, creating a Detroit academy to train 20,000 workers in AI-enabled production and building a new Houston chip facility.
- February 2025: The European Union launched its EUR 200 billion InvestAI fund, establishing four AI gigafactories to uplift automotive manufacturing competitiveness.
- January 2025: Siemens closed its Altair Engineering acquisition, strengthening simulation and digital-twin capabilities across automation portfolios.


Global Assembly Line Solutions Market Report Scope
An assembly line is a production process that breaks the manufacture of a good into steps that are completed in a pre-defined sequence. Assembly lines are the most commonly used method in the mass production of products. They reduce labor costs because unskilled workers are trained to perform specific tasks. The Global Assembly Line Solutions Market is segmented By Type (Manual Assembly Lines, Semi-automated Assembly Lines, Fully Automated Assembly Lines), By End-user (Automotive, Industrial Manufacturing, Electronics and Semiconductors, Medical & Pharmaceutical, Others), By Geography (North America, Asia-Pacific, Europe, Latin America, Rest of the World). For each segment, the market sizing and forecasts have been done on the basis of value (USD billion).
| Manual Assembly Lines |
| Semi-automated Assembly Lines |
| Fully-automated Assembly Lines |
| Automotive |
| Electronics & Semiconductors |
| Consumer Goods |
| Pharmaceuticals & Healthcare |
| Food & Beverage |
| Other Industries (general manufacturing, aerospace, etc.) |
| Robotics & End-effectors |
| Conveyors & Transfer Systems |
| Sensors & Vision Systems |
| Controllers & Software |
| Safety & Ergonomic Modules |
| North America | United States |
| Canada | |
| Mexico | |
| South America | Brazil |
| Argentina | |
| Peru | |
| Rest of South America | |
| Europe | United Kingdom |
| Germany | |
| France | |
| Italy | |
| Spain | |
| BENELUX (Belgium, Netherlands, and Luxembourg) | |
| NORDICS (Denmark, Finland, Iceland, Norway, and Sweden) | |
| Rest of Europe | |
| Asia-Pacific | China |
| India | |
| Japan | |
| Australia | |
| South Korea | |
| ASEAN (Indonesia, Thailand, Philippines, Malaysia, Vietnam) | |
| Rest of Asia-Pacific | |
| Middle East and Africa | Saudi Arabia |
| United Arab Emirates | |
| Qatar | |
| Kuwait | |
| Turkey | |
| Egypt | |
| South Africa | |
| Nigeria | |
| Rest of Middle East and Africa |
| By Automation Level | Manual Assembly Lines | |
| Semi-automated Assembly Lines | ||
| Fully-automated Assembly Lines | ||
| By End-user Industry | Automotive | |
| Electronics & Semiconductors | ||
| Consumer Goods | ||
| Pharmaceuticals & Healthcare | ||
| Food & Beverage | ||
| Other Industries (general manufacturing, aerospace, etc.) | ||
| By Component | Robotics & End-effectors | |
| Conveyors & Transfer Systems | ||
| Sensors & Vision Systems | ||
| Controllers & Software | ||
| Safety & Ergonomic Modules | ||
| By Geography | North America | United States |
| Canada | ||
| Mexico | ||
| South America | Brazil | |
| Argentina | ||
| Peru | ||
| Rest of South America | ||
| Europe | United Kingdom | |
| Germany | ||
| France | ||
| Italy | ||
| Spain | ||
| BENELUX (Belgium, Netherlands, and Luxembourg) | ||
| NORDICS (Denmark, Finland, Iceland, Norway, and Sweden) | ||
| Rest of Europe | ||
| Asia-Pacific | China | |
| India | ||
| Japan | ||
| Australia | ||
| South Korea | ||
| ASEAN (Indonesia, Thailand, Philippines, Malaysia, Vietnam) | ||
| Rest of Asia-Pacific | ||
| Middle East and Africa | Saudi Arabia | |
| United Arab Emirates | ||
| Qatar | ||
| Kuwait | ||
| Turkey | ||
| Egypt | ||
| South Africa | ||
| Nigeria | ||
| Rest of Middle East and Africa | ||


Key Questions Answered in the Report
What is the current size of the assembly line solutions market?
The market stands at USD 330.92 billion in 2026 and is projected to reach USD 480.39 billion by 2031.
Which automation level is expanding most rapidly?
Fully automated systems show the quickest uptake, advancing at a 10.34% CAGR as manufacturers pursue lights-out operations.
What are the main challenges for small manufacturers?
High capital requirements, complex legacy-system integration, and limited robotics talent lengthen ROI cycles and slow adoption.
How are vendors differentiating in a crowded market?
Leading suppliers focus on AI-enabled software, digital twin integration, and subscription-based Robotics-as-a-Service models to build recurring revenue and customer loyalty.
Page last updated on:


