
Market Overview
| Study Period | 2020 - 2031 |
|---|---|
| Market Size (2026) | USD 36.46 Billion |
| Market Size (2031) | USD 112.32 Billion |
| Growth Rate (2026 - 2031) | 25.24% CAGR |
| Fastest Growing Market | Asia Pacific |
| Largest Market | North America |
| Market Concentration | Low |
Major Players *Disclaimer: Major Players sorted in no particular order Image © Mordor Intelligence. Reuse requires attribution under CC BY 4.0. | |
Gamification Market Analysis by Mordor Intelligence
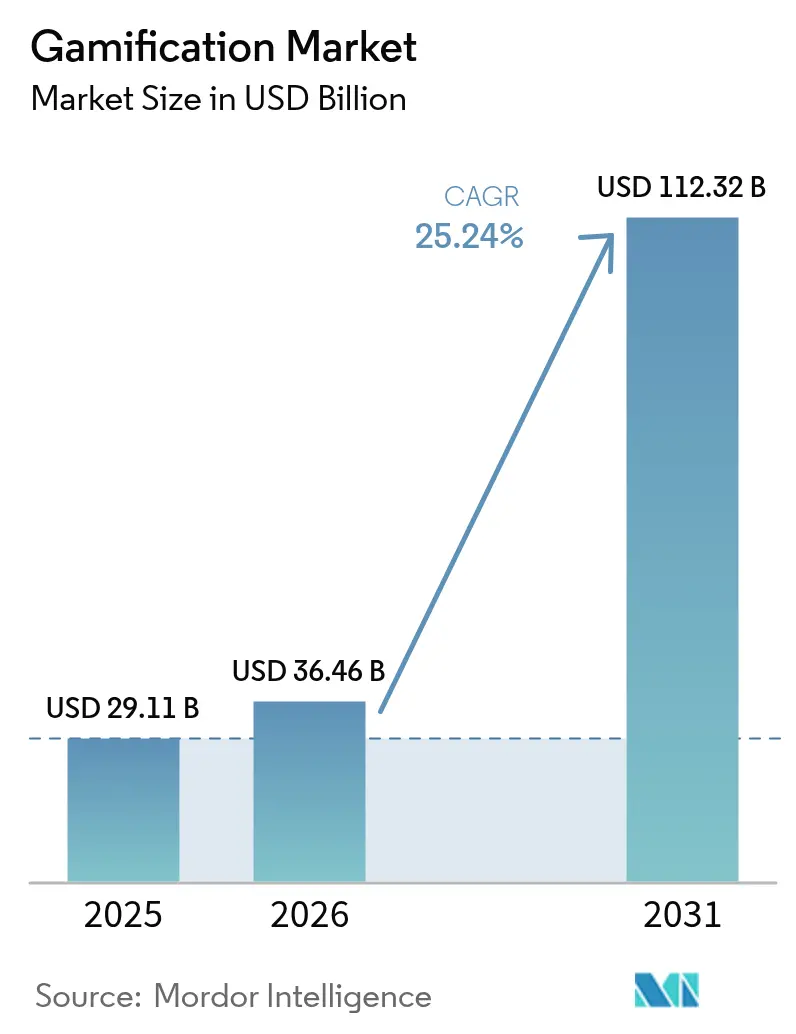
The gamification market size was valued at USD 29.11 billion in 2025 and estimated to grow from USD 36.46 billion in 2026 to reach USD 112.32 billion by 2031, at a CAGR of 25.24% during the forecast period (2026-2031). Cloud-based deployments already capture the majority of spend and, by delivering real-time analytics across distributed teams, underpin much of the current expansion. Large enterprises still account for the bulk of revenue, yet small and medium enterprises (SMEs) are scaling faster as low-code platforms lower adoption costs. Retail loyalty schemes remain the single-largest application, but employee-centric programs—particularly micro-learning initiatives—are recording the strongest uptake. Regionally, North America holds the lead, although Asia-Pacific’s mobile-first business culture is shifting the center of gravity toward emerging digital economies. Competitive intensity stays high because established software vendors and specialist start-ups target the same white-space opportunities in regulated verticals.
Key Report Takeaways
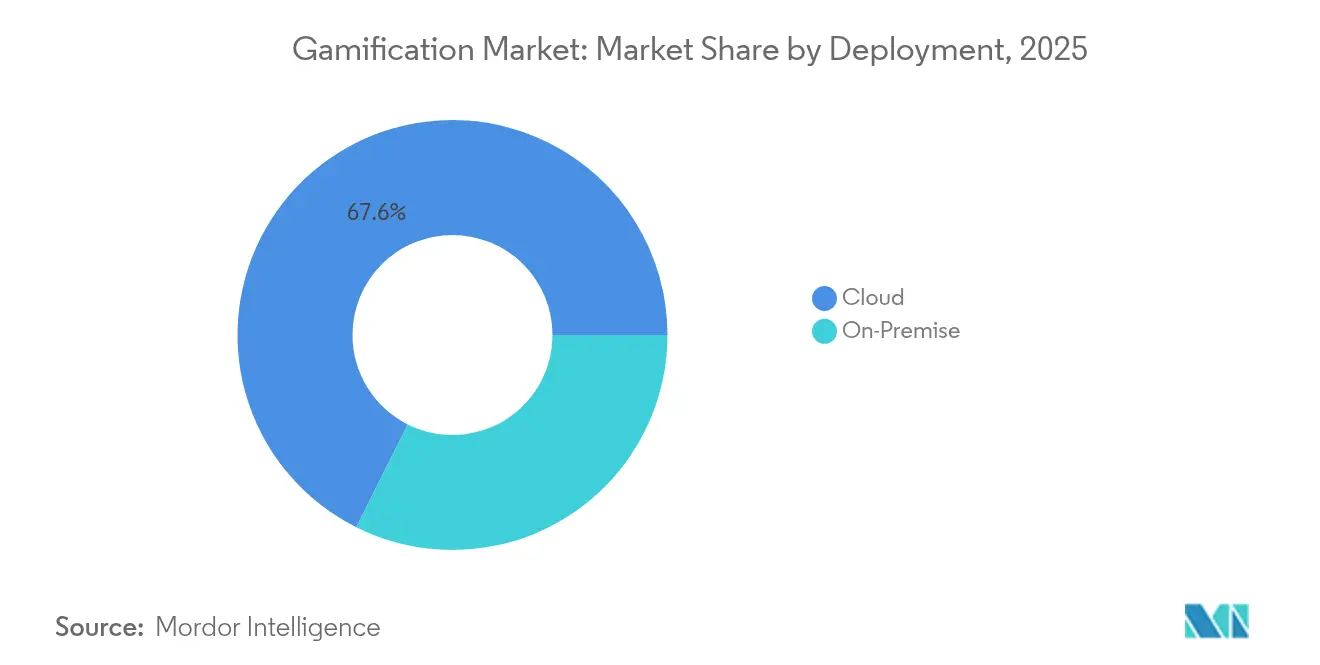
- By deployment, cloud-based solutions controlled 67.62% revenue share in 2025; the segment is projected to expand at a 26.91% CAGR through 2031.
- By organization size, large enterprises held 57.02% of the gamification market share in 2025, while SMEs are forecast to grow at a 27.65% CAGR to 2031.
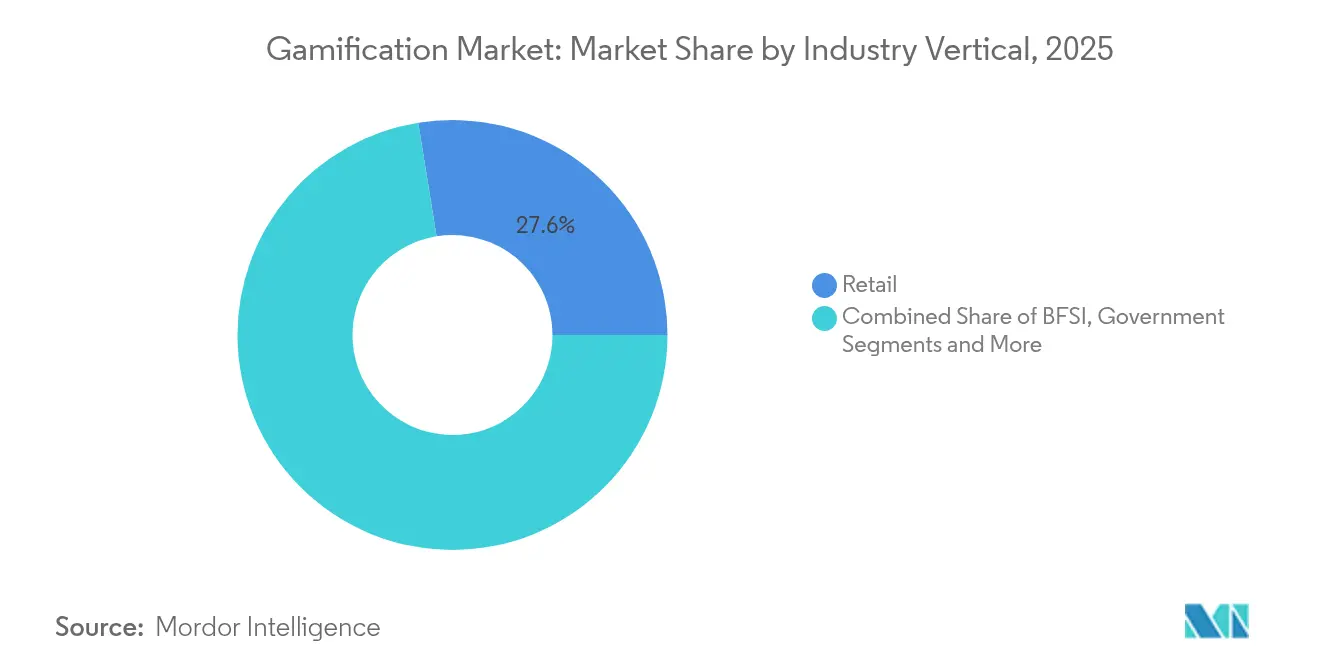
- By industry vertical, retail captured 27.55% share of the gamification market size in 2025, and IT & Telecom is advancing at a 28.1% CAGR through 2031.
- By application, marketing & sales represented 25.24% of 2025 revenue; HR & training is projected to rise at a 27.9% CAGR to 2031.
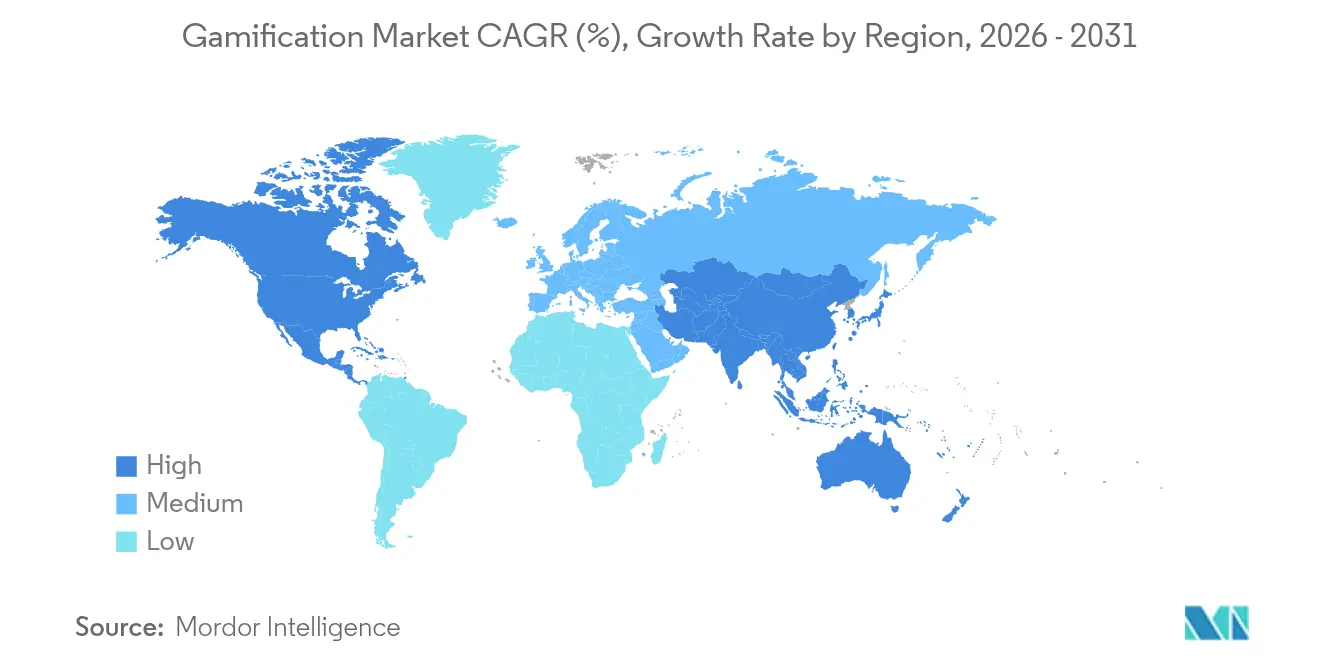
- By geography, North America accounted for 38.74% of 2025 spend, yet Asia-Pacific leads future growth with a 28.6% CAGR to 2031.
Note: Market size and forecast figures in this report are generated using Mordor Intelligence’s proprietary estimation framework, updated with the latest available data and insights as of 2026.
Global Gamification Market Trends and Insights
Drivers Impact Analysis*
| Driver | (~) % Impact on CAGR Forecast | Geographic Relevance | Impact Timeline |
|---|---|---|---|
| Surge in cloud-first digital-workplace roll-outs | +4.2% | Global, led by Asia-Pacific and North America | Medium term (2-4 years) |
| Proliferation of low-code gamification platforms | +3.8% | Global, SME-dense regions | Short term (≤2 years) |
| Retail loyalty wars escalating points and badges usage | +3.1% | North America and core EU markets | Short term (≤2 years) |
| Smartphone-centric micro-learning for frontline staff | +2.9% | Asia-Pacific core, spill-over to MEA | Medium term (2-4 years) |
| Privacy-preserving engagement analytics | +2.4% | EU and North America regulatory zones | Long term (≥4 years) |
| Gamified CBDC pilots by central banks | +1.8% | Asia-Pacific experimental markets, Thailand leading | Long term (≥4 years) |
| Source: Mordor Intelligence | |||
Surge in Cloud-First Digital-Workplace Roll-Outs
Enterprises accelerating cloud migration need engagement tools that function natively across hybrid teams. Microsoft Power Apps embeds game mechanics directly into workflows, cutting rollout times from months to weeks [1]Microsoft Corporation, “Microsoft Power Apps – Build Apps with AI,” microsoft.com. Cloud-hosted platforms generate the 27.58% CAGR forecast because they consolidate data streams and push real-time leaderboards to any device. Organizations integrating gamification with existing cloud infrastructure report up to 90% productivity improvement in remote work settings. The cost advantages of subscription licensing further accelerate adoption. As IT departments rationalize on-premise assets, cloud-native vendors gain a structural advantage that is unlikely to reverse over the outlook period.
Proliferation of Low-Code Gamification Platforms
Drag-and-drop development is democratizing the design of engagement experiences. SAP Build allows citizen developers to insert challenges, badges, and rewards into core business processes without writing code, trimming development spend by 70% against bespoke projects. The accessibility expands the total addressable base beyond large enterprises to SMEs that lacked technical resources. Platform vendors report a surge in templates focused on sales contests and onboarding missions, indicating mainstream business adoption. Because low-code stacks connect directly to SaaS ecosystems, they also shorten proof-of-value cycles, a key procurement hurdle for smaller firms. The structural decline in custom development aligns with the segment’s 28.67% SME CAGR.
Retail Loyalty Wars Escalating Points and Badges Adoption
Heavy competition in mature consumer markets forces retailers to rely on immersive loyalty frameworks instead of price cuts. Starbucks attributes 40% of revenue to its tier-based star accumulation model, validating tangible returns from gamified rewards. Sephora’s challenge-driven program added more than 2 million members by focusing on goal-oriented shopping journeys. However, point inflation risks user fatigue, nudging brands toward experiential perks and social-sharing mechanics. Vendors offering dynamic reward engines are therefore well-positioned. The intensified loyalty arms race supplies steady demand for advanced engagement analytics capable of segment-level personalization.
Smartphone-Centric Micro-Learning for Frontline Workforces
Front-of-house employees often lack desk access, making mobile the primary channel for upskilling. Three UK achieved higher retention by deploying 3D simulation games in two-minute bursts, timed to retail traffic lulls. HR teams cite 60% boosts in training completion when lessons are gamified and mobile-first. The result is a 28.78% CAGR in HR & training applications. Content designers increasingly integrate adaptive scoring to maintain skill freshness, embedding learning in day-to-day workflows. Because smartphones already house productivity and point-of-sale apps, incremental rollout costs stay low, fueling rapid scalability in service-heavy industries.
Restraints Impact Analysis*
| Restraint | (~) % Impact on CAGR Forecast | Geographic Relevance | Impact Timeline |
|---|---|---|---|
| Poorly-designed programs deliver negative ROI | −2.8% | Global, early-adopter markets | Short term (≤2 years) |
| Inter-platform data-ownership disputes | −1.9% | EU and North America | Medium term (2-4 years) |
| Antigaming clauses in sector-specific compliance | −1.6% | North America and EU | Long term (≥4 years) |
| Accessibility lawsuits on non-inclusive mechanics | −1.2% | North America litigation-prone | Medium term (2-4 years) |
| Source: Mordor Intelligence | |||
Poorly-Designed Programs Deliver Negative ROI
Superficial point-and-badge deployments risk disengagement and budget waste. Versus Systems’ client roster fell from 16 to 5 in 2023 after lackluster implementations failed to sustain user interest, exemplifying backlash against gimmicky rollouts. Enterprises now demand business-outcome metrics, such as sales lift or error-rate reduction, before green-lighting new projects. This scrutiny lengthens sales cycles and forces vendors to provide stronger consultative support. Implementation missteps in early-adopter sectors also create caution among laggards, dampening near-term spend. Vendors that neglect instructional design and behavioral science risk reputational damage that can reverberate across the wider gamification market.
Antigaming Clauses in Sector-Specific Compliance (HIPAA, MiFID-II)
Regulated industries face strict conduct and privacy obligations that conflict with incentivized behavior loops. The U.S. Federal Trade Commission levied USD 7.8 million in penalties on a mental-health app for HIPAA violations, spotlighting the financial hazards of non-compliance. In financial services, MiFID-II mandates granular audit trails, complicating reward structures that steer customer decisions. The ambiguity deters procurement teams in healthcare and banking, two high-value verticals. Specialized providers that embed consent management and audit logging gain a strategic edge, but development costs increase, pressuring margins. Until regulators issue clearer guidelines, adoption in these segments will lag non-regulated domains.
*Our forecasts treat driver/restraint impacts as directional, not additive. The impact forecasts reflect baseline growth, mix effects, and variable interactions.
Segment Analysis
By Deployment: Cloud Infrastructure Drives Platform Consolidation
Cloud solutions accounted for 67.62% of 2025 revenue, and their share of the gamification market size is projected to climb further, given a 26.91% CAGR to 2031. Real-time telemetry, seamless updates, and elastic storage underpin the preference, while maturing security certifications sway even conservative sectors. On-premise packages remain relevant where data sovereignty is paramount, yet shrinking IT budgets and rising cyber-insurance premiums tilt cost–benefit equations toward managed hosting.
Rapid iteration cycles, achieved through continuous delivery pipelines, let cloud vendors fine-tune achievement algorithms and A/B-test narratives without client-side patches. Enterprises report 37% productivity gains when advanced analytics recommend personalized challenges in real time. Hybrid rollouts serve as a transitional choice, allowing sensitive data to stay on site while engagement logic resides in the cloud. Over the forecast, migration to public-cloud stacks is expected to standardize integration patterns, reducing total cost of ownership and consolidating vendor footprints.



By Organization Size: SME Adoption Accelerates Through Accessible Platforms
Large enterprises contributed 57.02% to 2025 revenue, reflecting deep budgets and complex integration needs. In contrast, SMEs represent the fastest-growing slice of the gamification market, expanding at 27.65% CAGR. Freemium pricing, template libraries, and pay-as-you-grow architectures lower entry barriers for smaller firms.
SMEs typically target narrow pain points—motivating a sales pod or onboarding seasonal staff—allowing them to demonstrate ROI within weeks. Government digitalization grants in markets such as Singapore further stimulate uptake by offsetting subscription fees. Feature parity is narrowing because cloud platforms offer enterprise-grade identity management at mass-market price tiers. As a result, mid-market buyers increasingly insist on SOC 2 compliance and single-sign-on, forcing vendors to harden security roadmaps while keeping price elasticity.
By Industry Vertical: IT and Telecom Disrupts Retail Leadership
Retail held 27.55% share of the gamification market in 2025, fueled by entrenched loyalty ecosystems. Yet IT and Telecom is predicted to grow at a 28.1% CAGR, reflecting new-hire ramp-up needs and customer-churn pressures. Service providers use game loops to cut mean-time-to-competency for complex product lines and to reward self-service troubleshooting.
Banking institutions illustrate diversification: First United Bank and Trust recorded a 53% user-adoption rate and a 20-fold spike in savings-account openings through its gamified mobile guidance platform. Healthcare hesitates because of data-protection liabilities, though patient-adherence pilots in diabetes management show early promise. Manufacturing and logistics now explore game mechanics for safety drills and route optimization, broadening vendor addressable markets beyond traditional consumer-facing segments.
By Application: HR and Training Overtakes Marketing Dominance
Marketing and sales platforms owned 25.24% share in 2025, but HR-focused deployments are forecast to grow at 27.9% CAGR, gradually eclipsing outward-facing use cases. Economic uncertainty drives executives to invest in productivity levers that yield direct cost efficiencies.
Gamified learning modules raise compliance-training completion by 60% compared with slide-based courses. Performance-management dashboards that convert KPIs into quests are gaining favor as organizations move toward continuous feedback cultures. Beyond core HR, product-innovation sprints and customer-support gamification deliver collaborative problem-solving frameworks. The broadening application slate signals a shift from isolated campaigns toward enterprise-wide engagement strategy.
Geography Analysis
North America generated 38.74% of 2025 revenue, benefitting from early SaaS adoption and a deep vendor ecosystem. Corporations prioritize integrations with HRIS and CRM suites, leading to rapid feature rollouts that drive wallet share. Federal accessibility litigation risk motivates platforms to invest in WCAG-compliant design, raising quality thresholds for all suppliers.
Asia-Pacific records the highest regional CAGR at 28.6%, powered by mobile-first working patterns and government-sponsored digital-skills programs. Singapore’s public-service gamification initiatives validate efficacy and encourage private-sector replication. Thailand’s digital-wallet scheme experiments with gamified Central Bank Digital Currency incentives, signaling policy-level endorsement. Companies capitalize by shipping lightweight applications optimized for low-latency 5G networks, accelerating uptake in populous markets such as India and Indonesia.
Europe shows steady demand despite stringent privacy rules. GDPR obligations spur innovation in differential-privacy analytics that anonymize reward data. Vendors with in-house legal teams gain an edge when customizing consent flows for financial institutions subject to MiFID-II. South America and the Middle East and Africa trail in absolute dollars but benefit from growing smartphone penetration, making cloud-hosted, mobile-native solutions the default choice. Localization—both linguistic and cultural—remains a decisive factor in conversion rates across these emerging territories.

Regulatory Landscape
Gamification vendors and adopters operate under a fast-tightening digital-safety and privacy regime that increasingly treats streaks, badges, rewards, and other engagement mechanics as regulated design features, particularly where minors can be affected. In the United States, state-level childrens privacy and online-safety activity accelerated in 2026, including South Carolinas Age-Appropriate Design Code Act (signed February 2026) and Michigan Senate Bill 758 (passed April 2026), both of which explicitly recognize gamification-type features in their compliance framing and raise expectations around risk assessment, documentation, and controls.
In Europe, the European Unions Digital Services Act (DSA) requires very large online platforms and other covered services to assess and mitigate systemic risks, including those linked to platform design and how it affects minors. That expands the governance discussion for gamified engagement loops alongside recommender systems, pushing platforms toward privacy-preserving engagement analytics and audit-ready controls such as consent flows, logging, and policy enforcement. Healthcare (HIPAA-linked exposure) and financial services (MiFID-II conduct and audit obligations) continue to treat incentive design as a compliance-sensitive capability rather than purely a UX decision.
Value Chain Analysis
The gamification value chain starts with design and content creation, including behavioral science, instructional design, narrative, UX/UI, and accessibility. It then moves into platform engineering, covering rule engines, scoring, rewards catalogs, analytics, identity and access management, and API layers, before shifting to deployment and operations that are predominantly cloud-delivered. Distribution is shaped by enterprise software ecosystems such as CRM, HCM, LMS/LXP, contact center, and collaboration suites, plus channel partners that package gamification into broader digital transformation programs. Ongoing optimization services tune mechanics using telemetry and experimentation.
Integration remains a bottleneck, since many buyers require synchronization with HRIS/CRM data, single sign-on, and audit trails. That favors vendors with strong connectors or native placement inside suites such as Microsoft Power Platform and SAP Build. Telecom-led programs illustrate downstream activation, with operators and digital ecosystem partners embedding gamified incentives into consumer and workforce journeys, including Mobicom partnering with Circles on a SaaS engagement platform in February 2025, and Singtel partnering with Tencent Games in September 2025 around 5G-enabled cloud gaming rewards. The chain increasingly adds AI layers for real-time coaching and personalization, and in some emerging-market deployments, tokenized or blockchain-based reward rails to manage incentives and reduce fraud.
Competitive Landscape
The supplier base remains fragmented, with no vendor exceeding a double-digit slice of overall revenue, positioning the gamification market as an open arena for specialization. Microsoft embeds achievement layers in its Power Platform, eroding demand for standalone products unless they deliver niche functionality[3]Microsoft Corporation, “Power Apps and Power Automate,” microsoft.com. SAP, Oracle, and Salesforce race to match these capabilities, prompting a wave of acquisitions targeting analytics engines and behavioral-science intellectual property.
Specialist platforms compete on depth rather than breadth, offering configurable rule engines and AI-driven personalization. Patent filings, such as Niantic’s geo-based content recommendations, underline efforts to protect algorithmic differentiation. Emerging entrants leverage blockchain to tokenize rewards, positioning against fraud and offering cross-program interchangeability. Investors focus on evidence of sustained daily active users over vanity leaderboard metrics, shifting valuation criteria toward retention economics.
Industry-specific white-space remains, especially in healthcare where HIPAA compliance gates entry. Vendors that hard-wire audit trails and encryption into system architecture win pilot contracts ahead of broader rollouts. Partnerships with LMS, HRIS, and digital-experience-platform providers continue to define go-to-market speed. Despite consolidation rumors, abundant venture funding suggests that start-ups can still differentiate through vertical depth and real-time sentiment analytics.
Gamification Industry Leaders
Cognizant Technology Solution Corp.
MPS Interactive Systems Limited
Microsoft Corporation
SAP SE
Aon plc
- *Disclaimer: Major Players sorted in no particular order


Market Opportunities and Future Outlook
The largest whitespace is in enterprise change programs where gamification is used as an adoption control layer rather than a one-off campaign, particularly for AI and cloud workflow rollouts. Cognizants April 2026 launch of Skillspring, which uses a gamified AI Fluency Dashboard to score and track readiness, and The Walt Disney Companys internal use of streaks and badges to encourage employee AI tool usage (reported in April 2026) both point to buyer demand for measurable behavior change tied to skill progression, not just participation. This creates openings for vendors that connect game mechanics to HR, productivity, and performance datasets.
Another opportunity is in regulated and youth-adjacent digital experiences as policy attention shifts from content to product design, raising requirements for safety-by-design, consent, and auditability for engagement mechanics. The EUs Digital Services Act and 2026 U.S. state activity referencing gamification-like features, including South Carolinas Age-Appropriate Design Code Act and Michigans SB 758, increase demand for compliant design patterns, explainability, and risk controls. In parallel, telecom and digital wallet ecosystems in Asia-Pacific continue to commercialize incentive-based engagement at scale, including MyRepublics gamified customer experience launch in Singapore in April 2025, supporting demand for cloud-native platforms that can localize rewards, operate across partner ecosystems, and integrate analytics without exposing sensitive identity data.
Recent Industry Developments
- April 2026: Cognizant launched Cognizant Skillspring, an AI-native learning and talent transformation platform that includes a gamified AI Fluency Dashboard and scoring to track workforce readiness. The development aligns gamification with enterprise AI adoption metrics, reinforcing demand for measurable, role-based skill progression in HR and training deployments.
- October 2025: MPS Interactive Systems completed the 100% acquisition of Australia-based Liberate Group, expanding its capabilities in gamified training, immersive 360-degree simulations, and VR-based learning. The transaction strengthens end-to-end content and platform delivery for corporate learning programs and increases competitive pressure on smaller specialist training-gamification providers.
- December 2024: The European video-games industry recorded EUR 19 billion in turnover, reflecting continued scale of game ecosystems that supply talent, tools, and content patterns used in enterprise gamification. This backdrop supports cross-pollination of engagement mechanics and analytics practices from entertainment into retail loyalty and workplace learning use cases.


Research Methodology Framework and Report Scope
Market Definition and Coverage
For this report, the gamification market is defined as software platforms and related services that apply game mechanics such as points, levels, badges, and challenges to improve user participation and learning in digital and workplace programs.
Scope exclusions: We exclude pure entertainment gaming titles, gambling, and one-off campaign giveaways that are not delivered through a gamification platform or program.
Segmentation Overview
- By Deployment
- On-Premise
- Cloud
- By Organization Size
- Large Enterprises
- Small and Medium Enterprises (SMEs)
- By Industry Vertical
- Retail
- BFSI
- Government
- Healthcare
- Education and Research
- IT and Telecom
- Others
- By Application
- Marketing and Sales
- HR and Training
- Product Development and Innovation
- Customer Support and Experience
- Others
- By Geography
- North America
- United States
- Canada
- Mexico
- South America
- Brazil
- Argentina
- Colombia
- Rest of South America
- Europe
- Germany
- United Kingdom
- France
- Italy
- Spain
- Russia
- Netherlands
- Rest of Europe
- Asia-Pacific
- China
- Japan
- South Korea
- India
- Australia
- Singapore
- Rest of Asia-Pacific
- Middle East and Africa
- Middle East
- Saudi Arabia
- United Arab Emirates
- Rest of Middle East
- Africa
- South Africa
- Egypt
- Rest of Africa
- Middle East
- North America
Data Sources, Market Sizing, and Validation
Desk Research
Desk research was used to build the base structure of the market and set realistic assumptions for adoption and pricing. We leaned on public sources such as US Bureau of Labor Statistics and OECD workforce indicators, World Bank and IMF macro series, and digital economy and broadband statistics from ITU to connect demand with workforce and connectivity trends.
To keep the model grounded, we also reviewed sources such as SEC filings and investor presentations, public pricing pages and product documentation, app store and web-traffic signals, and reputable press coverage on enterprise learning and engagement programs. Patent databases were referenced selectively to track the direction of product capabilities (for example, personalization and analytics). In addition, paid subscriptions for company financials and intelligence and for news and financials were used to speed up cross-checks on revenue mix, partnerships, and geographic exposure. These desk sources are illustrative only, and many other references were used for data collection, validation, and clarification during the work.
Primary Interviews and Surveys
Primary work focused on interviews and structured surveys with solution providers, implementation partners, and enterprise buyers that run gamified programs in training, loyalty, and employee engagement. We also spoke with functional leaders who manage deployment choices (cloud versus on-premise) and with managers who track usage, renewals, and program outcomes across major regions, which helped tighten assumptions that were weak or inconsistent in desk research.
Distribution of primary research fieldwork respondents
| Company type | Respondent position | Region |
|---|---|---|
| Top tier: 30% | CXOs: 17% | APAC: 41% |
| Mid tier: 49% | Functional/Unit leaders: 29% | EMEA: 34% |
| Smaller Players: 21% | Managers: 54% | Americas: 25% |
Market-Sizing & Forecasting
Sizing starts from a top-down build that reconstructs the demand pool using digital workplace spending signals and adoption rates for engagement, learning, and loyalty programs across key industries, and then the totals are allocated by region and deployment. To keep the result practical, we corroborated the output with selective bottom-up checks such as sampling vendor price points, estimating active program volumes by large accounts, and applying realistic spend-per-user ranges, and then we adjusted for overlaps when the same platform is used across multiple departments.
A few inputs that mattered most were: cloud versus on-premise mix, enterprise versus SME adoption, platform model (open versus closed/enterprise), typical contract duration and renewal patterns, and the intensity of use cases in retail, banking, government, healthcare, education, and IT and telecom. Where direct revenue visibility was limited, gaps were handled by using proxy adoption indicators (program launches, hiring signals for learning and engagement roles, and disclosed customer counts) and then validating the implied revenue per customer through interview feedback.
For forecasting, scenario analysis was used with a base case anchored to expert views on enterprise software budgets, productivity and training priorities, and the pace of feature upgrades such as analytics-led personalization. The scenarios were then converted into annual market values through consistent penetration and pricing progression assumptions, so the steps stay repeatable and easy to review.
Data Validation & Update Cycle
Validation is done by triangulating model outputs against independent signals such as enterprise digital spending direction, cloud adoption indicators, and the relative weight of major end-user verticals. When a number looks off, we run variance checks by region, deployment, and end-user mix, and then we revisit the assumption that is driving the swing, followed by a second analyst review before sign-off.
Reports are refreshed annually, and interim updates are triggered when material events occur, such as major policy changes affecting workplace data handling, large M&A moves, or clear shifts in deployment preference. Before delivery, a final pass is done so the estimate reflects the latest information available at the time clients receive the report.
Mordor Intelligence's Gamification Market Size Compared With Other Published Estimates
Published market sizes for gamification often do not line up because the underlying scope and counting rules vary, even when the topic name looks the same. Differences usually come from what is treated as platform revenue versus adjacent services, how enterprise programs are counted across departments, and how quickly assumptions are refreshed when adoption patterns change.
Some published figures expand the scope to include broader training, analytics, and program management services that sit next to a gamification rollout, which can lift the total quickly. Mordor Intelligence counts spend only when it is tied to gamification platforms and directly associated program services across defined deployment modes, platform types, organization sizes, and end-user industries, and that narrower counting rule reduces double counting across HR, marketing, and customer programs.
Benchmark comparison
| Source | Market Size | Gaps in Research Methodology |
|---|---|---|
| Mordor Intelligence | USD 36.46 B (2026) | |
| Industry Research House A | USD 40.20 B (2024) | Uses an earlier base year and often bundles adjacent categories such as analytics dashboards and training-led service layers into the same total, which can inflate spend beyond direct gamification platform programs. |
| Market Advisory B | USD 18.68 B (2024) | Keeps a narrower value capture in some cases by emphasizing component splits and reported service revenue, and the conversion to a total market can undercount embedded gamification features delivered inside broader enterprise software contracts. |
The spread is mostly explained by year choice and what gets counted as gamification-related revenue versus nearby enablement services. By keeping the inclusion rules explicit and checking totals against adoption and pricing signals, the estimate stays traceable to clear demand drivers and can be repeated when assumptions are updated.


Key Questions Answered in the Report
What is the current value of the gamification market?
The gamification market size is USD 36.46 billion in 2026.
How fast is global demand growing?
Revenue is forecast to rise at a 25.24% CAGR between 2026 and 2031.
Which deployment model holds the lion’s share?
Cloud-based platforms capture 67.62% of 2025 revenue and continue to expand faster than on-premise solutions.
Which region will add the most new spending by 2031?
Asia-Pacific leads growth with a 28.6% CAGR, driven by mobile-first enterprise strategies and supportive government programs.
What is the leading enterprise application?
HR and training deployments are now the fastest-growing use case, driven by the need to upskill distributed workforces.
Page last updated on:




