Finished Vehicles Logistics Market Size and Share
Market Overview
| Study Period | 2020 - 2031 |
|---|---|
| Market Size (2026) | USD 152.1 Billion |
| Market Size (2031) | USD 185.35 Billion |
| Growth Rate (2026 - 2031) | 4.04% CAGR |
| Fastest Growing Market | Asia-Pacific |
| Largest Market | Asia Pacific |
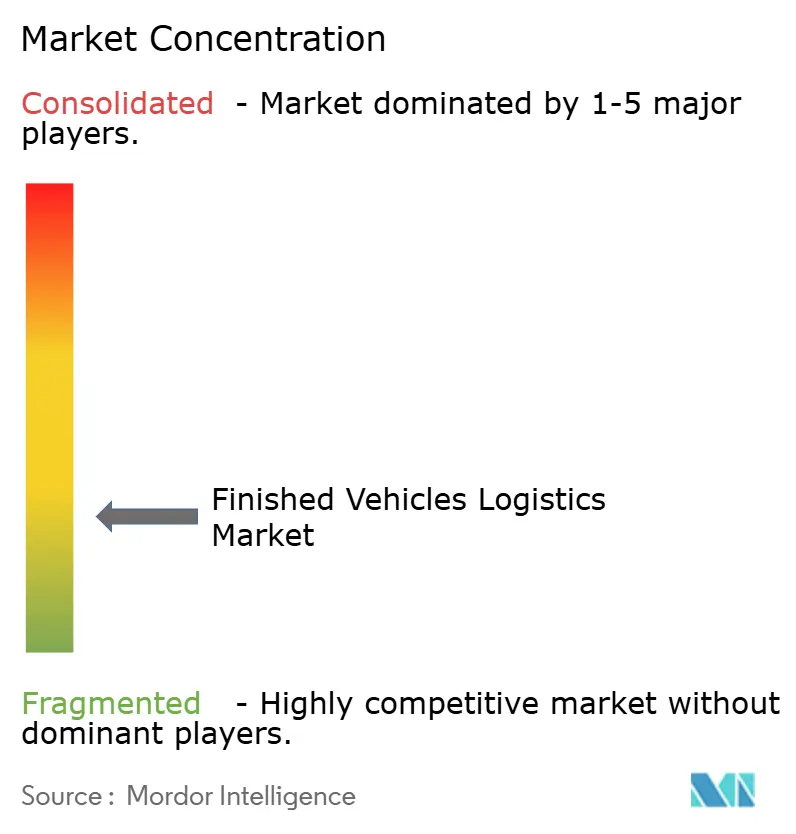
| Market Concentration | Low |
Major Players *Disclaimer: Major Players sorted in no particular order Image © Mordor Intelligence. Reuse requires attribution under CC BY 4.0. | |
Finished Vehicles Logistics Market Analysis by Mordor Intelligence
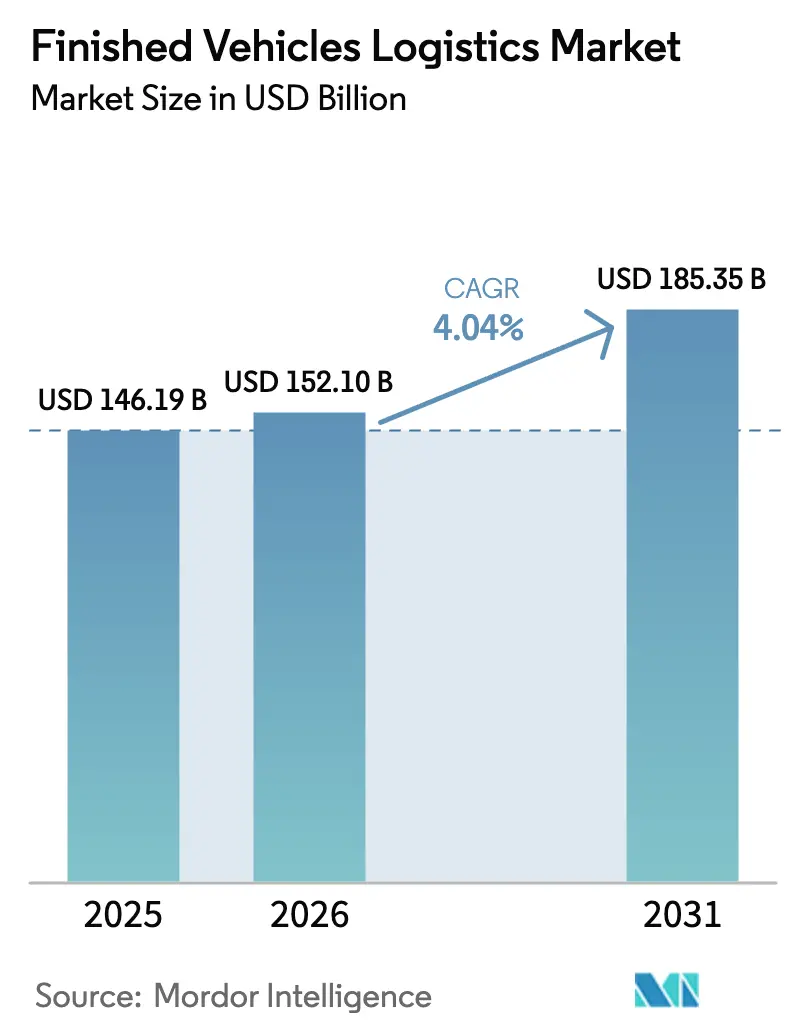
Finished Vehicles Logistics market size in 2026 is estimated at USD 152.1 billion, growing from 2025 value of USD 146.19 billion with 2031 projections showing USD 185.35 billion, growing at 4.04% CAGR over 2026-2031.
The steady trajectory reflects the transition from purely transportation-focused services to integrated, technology-enabled supply chains that accommodate rising vehicle production volumes, particularly in the Asia-Pacific region. Demand is underpinned by Chinese automotive exports that continue to reshape global trade lanes and catalyze new port, rail, and road investments. Competitive differentiation stems from digital freight-visibility platforms, value-added processing centers, and specialized handling solutions for electric vehicles. Providers able to bundle transportation, warehousing, and predictive analytics are capturing premium contracts as OEMs tighten delivery windows and seek end-to-end visibility. Cost headwinds from driver shortages and fuel price volatility are pushing the sector toward larger, well-capitalized operators that can absorb margin pressure and invest in alternative-energy fleets.
Key Report Takeaways
- By service type, transportation held 64.85% of the Finished Vehicles Logistics market share in 2025, while warehousing and distribution is projected to expand at a 3.84% CAGR through 2031.
- By destination, domestic logistics captured a 62.55% share of the Finished Vehicles Logistics market size in 2025; international flows are forecast to grow at a 3.52% CAGR to 2031.
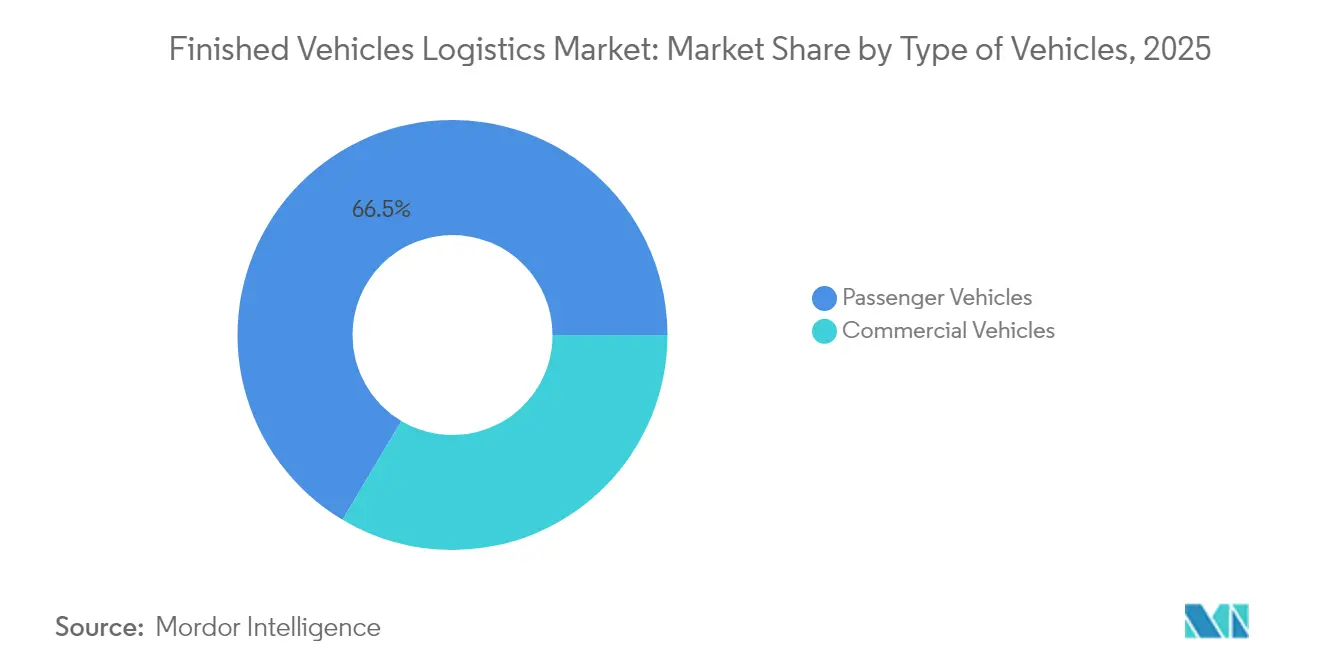
- By type of vehicles, passenger vehicles led with 66.45% share of the Finished Vehicles Logistics market in 2025 and are expected to advance at a 4.06% CAGR through 2031.
- By end-user industry, OEMs commanded 68.35% share of the Finished Vehicles Logistics market in 2025 and are expected to progress at a 4.24% CAGR to 2031.
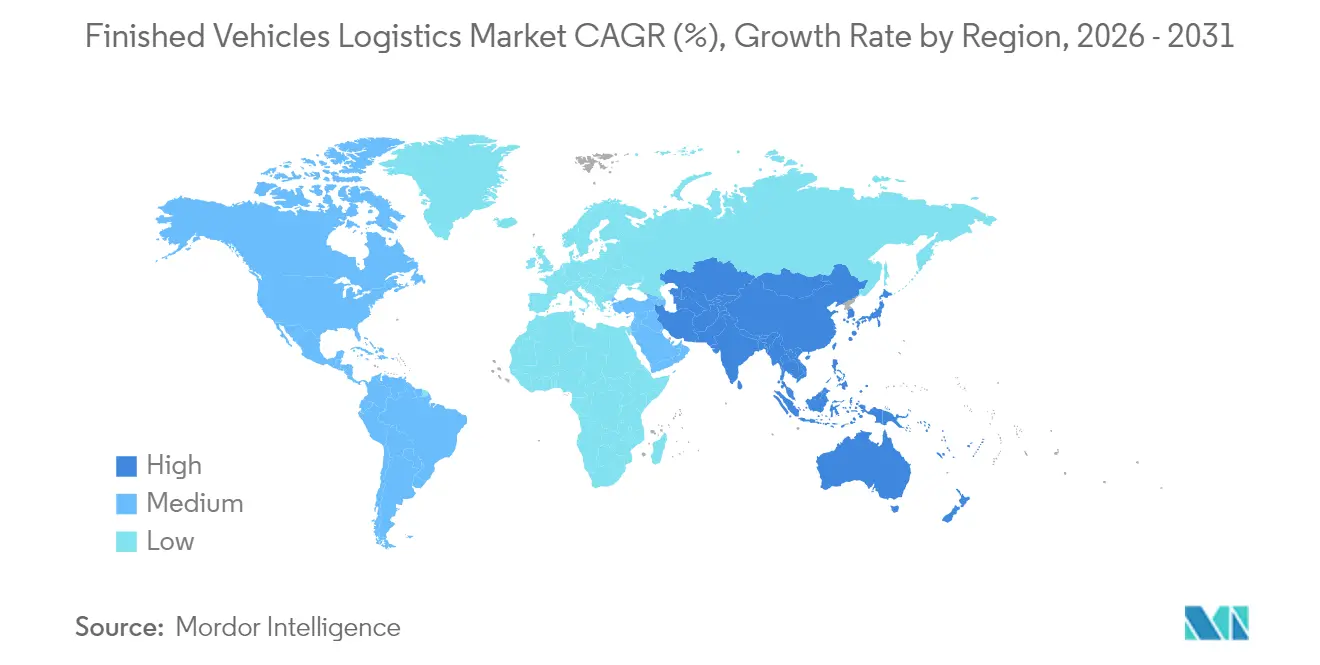
- By Geography, Asia-Pacific held a 38.70% share in 2025 and is projected to progress at a 4.43% CAGR to 2031.
Note: Market size and forecast figures in this report are generated using Mordor Intelligence’s proprietary estimation framework, updated with the latest available data and insights as of 2026.
Global Finished Vehicles Logistics Market Trends and Insights
Drivers Impact Analysis*
| Driver | (~) % Impact on CAGR Forecast | Geographic Relevance | Impact Timeline |
|---|---|---|---|
| Growing vehicle sales in emerging markets | +1.2% | APAC core, spill-over to Latin America | Medium term (2-4 years) |
| OEM push for just-in-sequence distribution | +0.8% | Global, with early adoption in North America & EU | Short term (≤ 2 years) |
| Expansion of Chinese vehicle exports | +0.6% | Global, strongest in APAC and Europe | Medium term (2-4 years) |
| Digital freight-visibility platforms | +0.4% | Global, led by North America and Europe | Long term (≥ 4 years) |
| Thermal-controlled EV battery handling | +0.3% | Global, concentrated in EV-leading markets | Long term (≥ 4 years) |
| OEM micro-hub decarbonisation networks | +0.2% | Europe and North America primarily | Long term (≥ 4 years) |
| Source: Mordor Intelligence | |||
Growing Vehicle Sales in Emerging Markets Drive Infrastructure Expansion
Robust demand across India, Indonesia, and Vietnam is prompting the construction of new vehicle processing centers, inland depots, and last-mile networks that can serve dispersed retail outlets. Automotive production records in India are spurring port upgrades at Chennai and Mundra to handle higher Ro-Ro volumes[1]Mike Colias, “India Auto Production Hits Record Levels in 2024,” Wall Street Journal, wsj.com. Logistics firms are placing regional hubs in Tier-2 cities to shorten delivery lead times and comply with in-country assembly rules. Specialized facilities now integrate pre-delivery inspection and light customization, reducing dealer inventory risk while raising throughput efficiency. Providers capable of navigating divergent customs rules and tax incentives are winning long-term contracts from OEMs looking to accelerate market entry.
OEM Push for Just-in-Sequence Distribution Transforms Service Requirements
Automakers are synchronizing vehicle drops with dealer sales velocity, replacing bulk shipments with smaller, high-frequency moves. This model relies on predictive analytics that merge plant schedules with point-of-sale data to trigger dispatch orders. Logistics partners must balance load factors against strict arrival windows, often combining road, rail, and short-sea legs in a single itinerary. Providers investing in ISO 9001-compliant control towers and real-time sensor data enjoy premium pricing as OEMs embed distribution KPIs into sourcing scorecards. The shift elevates inventory visibility from optional to mandatory, favoring operators with cloud-native platforms and automated exception handling.
Expansion of Chinese Vehicle Exports Reshapes Global Logistics Capacity
Chinese shipments surpassed 5 million units in 2024, with BYD and Geely chartering or commissioning ro-ro vessels to secure outbound slots[2]Joe Leahy, “Chinese Automakers Expand Shipping Capacity for International Markets,” Financial Times, ft.com. The influx is pushing European ports at Hamburg and Zeebrugge to expand berth allocations and yard acreage dedicated to Asian OEMs. Rising Asia-to-Latin America volumes are opening new direct services that bypass traditional transshipment hubs, compressing transit times and freight rates. Traditional third-party logistics providers are countering by layering value-added inspection, charging, and software update services on arrival, reinforcing relevance beyond ocean carriage.
Digital Freight-Visibility Platforms Enable Supply Chain Optimization
IoT trackers embedded in vehicle tie-downs feed telematics data to control towers that predict ETA, detect route deviations, and issue preventive maintenance alerts for railcars and car carriers. AI engines scan traffic, weather, and port congestion to re-route convoys hours before bottlenecks appear. Blockchain-based documentation accelerates customs clearance, cutting dwell times for high-value electric units that face enhanced safety checks. Providers report double-digit cuts in damage claims and fuel consumption, supporting both cost and ESG targets as carbon-pricing regimes tighten.
Restraints Impact Analysis*
| Restraint | (~) % Impact on CAGR Forecast | Geographic Relevance | Impact Timeline |
|---|---|---|---|
| Driver shortages & high labour costs | -0.7% | Global, most acute in North America and Europe | Short term (≤ 2 years) |
| Rising fuel prices & emission rules | -0.5% | Global, with varying regulatory intensity | Medium term (2-4 years) |
| Port congestion & Ro-Ro berth scarcity | -0.4% | Concentrated in major shipping hubs globally | Short term (≤ 2 years) |
| Railcar (autorack) capacity bottlenecks | -0.3% | Primarily North America, some European routes | Medium term (2-4 years) |
| Source: Mordor Intelligence | |||
Driver Shortages and High Labour Costs Constrain Operational Scaling
Industry vacancies exceed 100,000 positions in North America and Europe, pushing wage inflation to 6-8% annually and eroding margins for carriers locked into multiyear rate agreements[3]Paul Berger, “Truck Driver Shortage Reaches Critical Levels Across Industry,” Wall Street Journal, wsj.com. Specialized car-carrier drivers require extra training and certifications, lengthening onboarding timelines and raising insurance premiums. Aging workforces compound attrition, while hours-of-service limits restrict daily mileage, forcing fleets to add headcount just to maintain capacity. Automation pilots, including autonomous yard tractors and platooning on long-haul routes, remain nascent and capital-intensive, offering only gradual relief.
Rising Fuel Prices and Emission Rules Increase Operational Complexity
Fuel constitutes roughly 30% of operating costs, and volatility since 2024 has started to outpace contractual surcharge mechanisms. Concurrently, the European Union’s Euro VII proposal and expanding low-emission zones oblige operators to retrofit engines or procure alternative-fuel trucks. Capital outlays strain smaller carriers, accelerating consolidation. Disparate regional standards complicate fleet deployment strategies, elevating administrative spend on compliance monitoring. Modal shifts to rail and short-sea can cap emissions but introduce transloading costs and schedule rigidity, requiring sophisticated network design to avoid service degradation.
*Our forecasts treat driver/restraint impacts as directional, not additive. The impact forecasts reflect baseline growth, mix effects, and variable interactions.
Segment Analysis
By Service Type: Integrated Solutions Elevate Non-Transportation Growth
Transportation services contributed 64.85% to the Finished Vehicles Logistics market size in 2025, yet warehousing and distribution, while smaller, is projected to deliver the fastest incremental revenue at 3.84% CAGR (2026-2031). Consolidated vehicle processing centers now combine storage, customization, and charging operations, eliminating redundant handoffs and trimming dwell times. Transportation players are embedding API-enabled tracking tools that feed into OEM dashboards, creating new monetization streams from data services. Warehousing operators, in turn, deploy automated storage and retrieval cranes to stack vehicles vertically, expanding capacity without land acquisition. The convergence is blurring traditional service boundaries, leading clients to award multi-year, multi-service contracts to providers that can manage end-to-end distribution within a single SLA.
Despite transportation’s dominant Finished Vehicles Logistics market share, its margin profile is under pressure from driver shortages and fluctuating diesel costs. Conversely, value-added services, although contributing the smallest top-line share, secure double-digit gross margins by bundling software updates, light accessory installation, and OEM-branded pre-delivery detailing. Providers capable of scaling these offerings across international networks are positioned to defend pricing and win renewals. Digital twins of yards and vessels enable scenario planning that optimizes loading sequences and minimizes damage, an innovation increasingly factored into tender evaluations by procurement teams.


By Destination: International Growth Outpaces Domestic Base
Domestic operations accounted for 62.55% of 2025 revenue, but international volumes are accelerating as vehicle exports from China, Mexico, and Southeast Asia proliferate. Enhanced customs brokerage, multi-currency billing, and bonded storage capabilities are prerequisites for capturing this flow. Infrastructure bottlenecks, such as Ro-Ro berth constraints at Hamburg and Long Beach, heighten dwell charges and spark schedule variability. Providers that pre-book priority berths or operate dedicated feeder services mitigate these risks and command loyalty premiums.
International services also gain from the electric vehicle trade, as dedicated battery certifications and hazard-class documentation become mandatory. The Finished Vehicles Logistics market size for cross-border movements is projected to grow at a 3.52% CAGR (2026-2031). To hedge capacity risks, several Chinese OEMs are chartering vessels, squeezing space for spot shipments and prompting third-party providers to sign longer charter parties. These dynamics privilege financially robust operators able to lock in multi-year tonnage commitments.
By Type of Vehicles: Passenger Dominance Faces Commercial Upswing
Passenger units accounted for 66.45% of the Finished Vehicles Logistics market share in 2025, supported by predictable demand cycles and standardized handling processes. Moreover, passenger vehicle logistics is projected to outpace commercial vehicle logistics with a 4.06% CAGR (2026-2031) as e-commerce fleets and municipal electrification projects surge. Electric buses and delivery vans introduce unique height and weight profiles that require custom trailer fixtures and higher-capacity hoists.
OEMs adopt direct-to-consumer models in the passenger segment, cutting dealer lots and increasing demand for home delivery services that rely on flexible micro-hub networks. Commercial vehicle consignments often include telemetry calibration and fleet livery application, expanding time on site but generating higher ancillary revenue. Providers skilled in both segments leverage asset pooling to balance seasonality—passenger peaks align with model-year changeovers, while commercial surges occur around infrastructure funding cycles.
By End-user Industry: OEM Control Redefines Partnership Models
OEMs controlled 68.35% of demand in 2025 and are amplifying their influence as they pivot to omnichannel sales. Strategic collaborations feature joint control towers where visibility data is shared in real time, shrinking buffer inventories, and elevating partner accountability. Dealers, historically logistics gatekeepers, now rely on OEM-driven allocations that favor providers with proven on-time delivery metrics. Fleet leasing firms, classified under “Others,” are expanding orders for electric units, creating niche opportunities for thermal-controlled transport and on-site charging yard management.
The OEM segment’s 4.24% CAGR through 2031 highlights supplier rationalization: automakers consolidate from ten or more logistics vendors per region to three or fewer, favoring those able to guarantee performance across transportation, warehousing, and value-added services. Contract durations lengthen, but penalty clauses intensify, compelling providers to invest in redundancy and back-up capacity to avoid SLA breaches.
Geography Analysis
Asia-Pacific retained 38.70% of the Finished Vehicles Logistics market in 2025 and leads growth at a 4.43% CAGR to 2031. Chinese OEMs such as BYD are vertically integrating ocean freight with six Ro-Ro vessels, guaranteeing lift for export programs and reducing reliance on third-party charterers. Indian output strength is pressuring inland rail corridors, prompting investment in dedicated freight corridors and expanded storage at Chennai and Kandla. Southeast Asian assembly hubs are emerging as secondary export nodes, driving feeder services into regional transshipment centers like Singapore and Tanjung Pelepas.
North America remains structurally important, supported by strong replacement demand and the near-shoring of electric vehicle production into Mexico. Cross-border traffic via Laredo and El Paso is growing faster than U.S. domestic moves, requiring specialized customs clearance and security protocols. Driver shortages remain most acute in the United States, elevating rail’s modal share for long-haul vehicle moves despite autorack capacity bottlenecks. Battery-ready storage yards near California ports cater to rising EV imports while aligning with state zero-emission mandates.
Europe faces capacity pressures at key ro-ro gateways. Hamburg and Antwerp have launched multi-phase berth expansions to accommodate Asian import surges and outbound premium brands. Strict emission limits spur modal shifts to electrified rail and short-sea links, while urban micro-hubs support last-mile deliveries inside low-emission zones. Providers capable of executing cross-border rail-truck combinations gain share, especially on Central European corridors constrained by driver availability and toll increases.

Competitive Landscape
The Finished Vehicles Logistics market exhibits moderate fragmentation. The 2025 DSV acquisition of DB Schenker for EUR 14.3 billion (USD 14.9 billion) instantly created a top-tier provider with pan-regional rail, road, and ocean assets, signaling that scale is vital to absorb rising compliance and technology costs. Larger firms leverage balanced portfolios to cross-subsidize early-stage EV handling infrastructure, including battery-temperature monitoring and charging stations. Technology investment is the other competitive pillar: AI-driven route optimizers, blockchain documentation, and yard digital twins reduce claims and enhance utilization, quantifiable benefits valued in OEM tenders.
Vertical integration by OEMs introduces a disruptive vector. BYD’s self-owned ro-ro fleet compresses third-party ocean margins and forces logistics providers to focus on high-value services such as pre-delivery inspection, software flashing, and last-mile handover. To counter, providers are forming joint ventures with port authorities to secure long-term berth access and embed value-added services onsite. Mid-tier firms, squeezed between capex requirements and rate pressure, are ripe acquisition targets for strategics seeking infill capacity.
Environmental regulations shape competition as well. Firms operating LNG-fueled or battery-electric trucks differentiate on ESG compliance, winning business from automakers with stringent scope-3 emissions targets. Certification depth—ISO 14001, IATF 16949 logistics extensions, and ADR battery handling—now features prominently in RFP scorecards, raising entry barriers for new entrants.
Finished Vehicles Logistics Industry Leaders
Deutsche Post DHL Group
DSV
CEVA Logistics
UPS Supply Chain Solutions
Logisteed Ltd
- *Disclaimer: Major Players sorted in no particular order

Recent Industry Developments
- May 2025: CJ Logistics acquired a controlling stake in CJ Darcl Logistics, strengthening its footprint in India’s automotive corridors.
- April 2025: DSV completed its EUR 14.3 billion (USD 14.9 billion) acquisition of DB Schenker, forming one of the largest integrated providers of finished vehicle logistics worldwide.
- April 2025: Kuehne+Nagel and Changan Automobile signed an MoU to build aftermarket logistics for EV models across six European countries.
- December 2024: CEVA expanded its enclosed special-vehicle fleet across France, Spain, Germany, Italy, Slovakia, and the Czech Republic, lowering empty kilometers and CO₂ output.


Global Finished Vehicles Logistics Market Report Scope
The actions involved in the movement of a vehicle from the moment it leaves the OEM assembly line until it reaches the dealer or final client are referred to as finished vehicle logistics. The transportation industry's finished vehicle logistics are a highly specialized field.
The Finished Vehicles Logistics Market is segmented by Activity (Transport (Rail, Road, Air, Sea), Warehouse, Value-Added Services), and by Geography (North America, Asia-Pacific, Europe, the Middle East and Africa, and South America). The report offers market size and forecast values (in USD billions) for all the above segments. The report also covers the impact of COVID-19 on the market.
| Transportation | Road |
| Rail | |
| Air | |
| Sea | |
| Warehousing & Distribution | |
| Value-added Services (Assembly, Labelling, Kitting) |
| Domestic |
| International |
| Passenger Vehicles |
| Commercial Vehicles |
| OEMs |
| Dealers |
| Others (Rental Companies, Fleet leasing companies) |
| North America | United States |
| Canada | |
| Mexico | |
| South America | Brazil |
| Peru | |
| Chile | |
| Argentina | |
| Rest of South America | |
| Asia-Pacific | India |
| China | |
| Japan | |
| Australia | |
| South Korea | |
| South East Asia (Singapore, Malaysia, Thailand, Indonesia, Vietnam, and Philippines) | |
| Rest of Asia-Pacific | |
| Europe | United Kingdom |
| Germany | |
| France | |
| Spain | |
| Italy | |
| BENELUX (Belgium, Netherlands, and Luxembourg) | |
| NORDICS (Denmark, Finland, Iceland, Norway, and Sweden) | |
| Rest of Europe | |
| Middle East and Africa | United Arab of Emirates |
| Saudi Arabia | |
| South Africa | |
| Nigeria | |
| Rest of Middle East And Africa |
| By Service Type | Transportation | Road |
| Rail | ||
| Air | ||
| Sea | ||
| Warehousing & Distribution | ||
| Value-added Services (Assembly, Labelling, Kitting) | ||
| By Destination | Domestic | |
| International | ||
| By Type of Vehicles | Passenger Vehicles | |
| Commercial Vehicles | ||
| By End-user Industry | OEMs | |
| Dealers | ||
| Others (Rental Companies, Fleet leasing companies) | ||
| By Geography | North America | United States |
| Canada | ||
| Mexico | ||
| South America | Brazil | |
| Peru | ||
| Chile | ||
| Argentina | ||
| Rest of South America | ||
| Asia-Pacific | India | |
| China | ||
| Japan | ||
| Australia | ||
| South Korea | ||
| South East Asia (Singapore, Malaysia, Thailand, Indonesia, Vietnam, and Philippines) | ||
| Rest of Asia-Pacific | ||
| Europe | United Kingdom | |
| Germany | ||
| France | ||
| Spain | ||
| Italy | ||
| BENELUX (Belgium, Netherlands, and Luxembourg) | ||
| NORDICS (Denmark, Finland, Iceland, Norway, and Sweden) | ||
| Rest of Europe | ||
| Middle East and Africa | United Arab of Emirates | |
| Saudi Arabia | ||
| South Africa | ||
| Nigeria | ||
| Rest of Middle East And Africa | ||


Key Questions Answered in the Report
What is the current value of the Finished Vehicles Logistics market?
The market stands at USD 152.1 billion in 2026 and is projected to reach USD 185.35 billion by 2031.
Which service type generates the highest revenue?
Transportation services account for 64.85% of 2025 revenue, driven by the essential need to move vehicles between plants, ports, and dealers.
Why is Asia-Pacific growing the fastest in vehicle logistics?
Chinese exports and Indian production gains are expanding regional volumes, lifting Asia-Pacific to a 4.43% CAGR through 2031.
How are electric vehicles changing logistics requirements?
EVs need thermal-controlled handling and charging-enabled storage, prompting investment in specialized equipment and yard infrastructure.
What are the main challenges facing providers?
Acute driver shortages, volatile fuel costs, and tightening emission standards are compressing margins and raising compliance complexity.
How is technology improving logistics performance?
IoT sensors, AI route planners, and blockchain documentation are shortening transit times, reducing damage, and enhancing end-to-end visibility.
Page last updated on:


