Market Overview
| Study Period | 2020 - 2031 |
|---|---|
| Forecast Data Period | 2026 - 2031 |
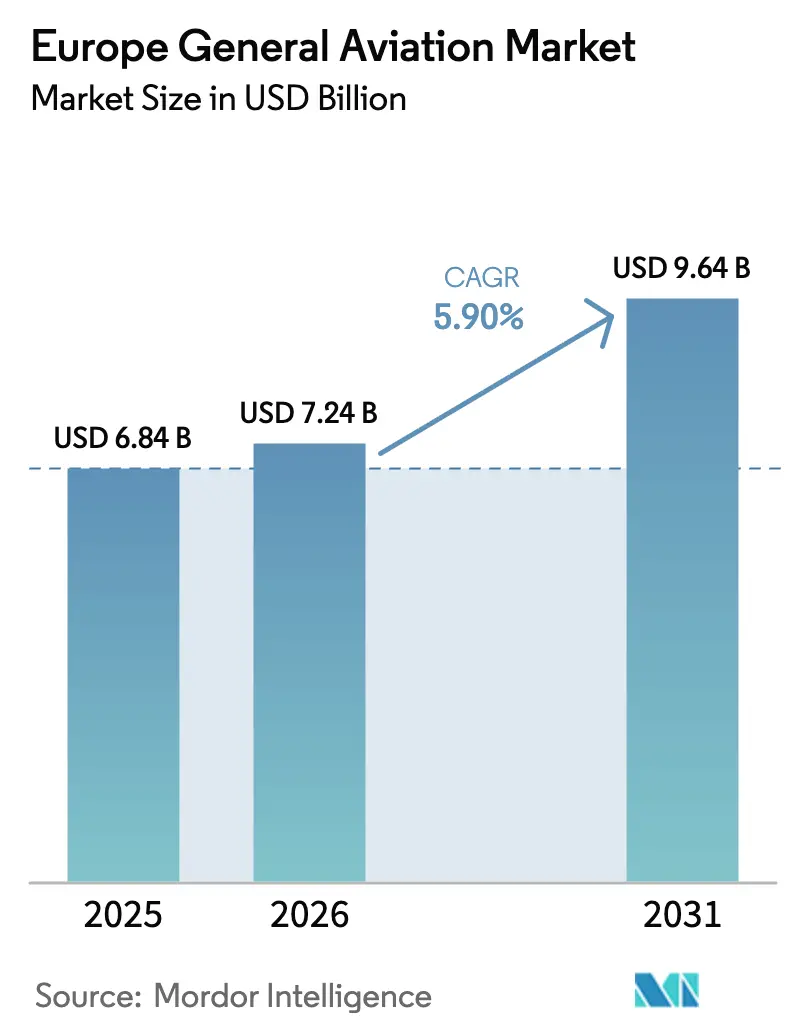
| Base Year Market Size (2025) | USD 6.84 Billion |
| Market Size (2026) | USD 7.24 Billion |
| Market Size (2031) | USD 9.64 Billion |
| Growth Rate (2026 - 2031) | 5.90% CAGR |
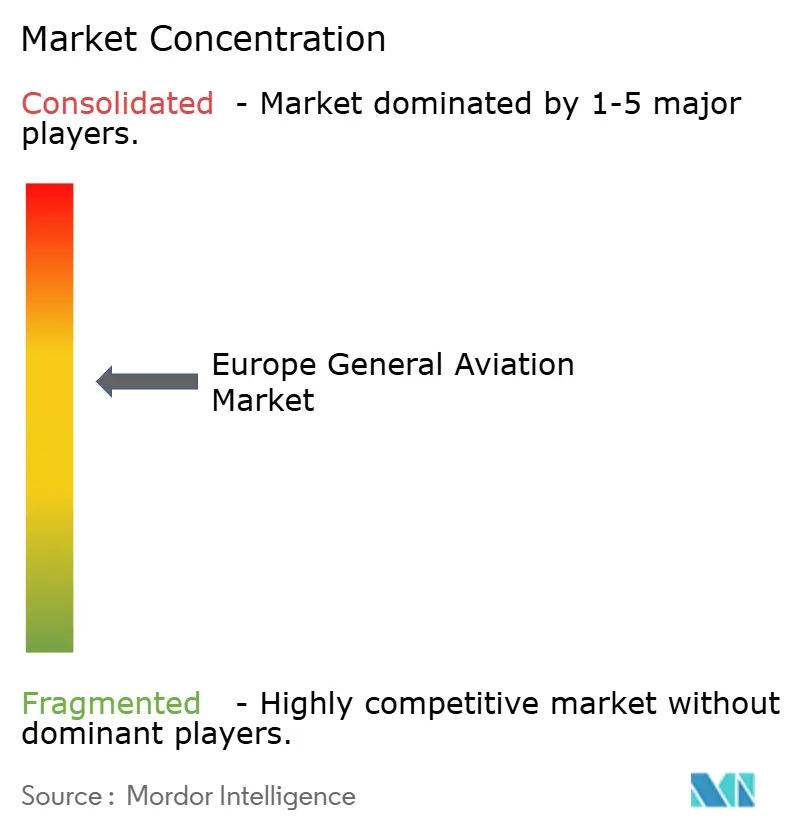
| Market Concentration | Medium |
Major Players *Disclaimer: Major Players sorted in no particular order Image © Mordor Intelligence. Reuse requires attribution under CC BY 4.0. | |
Europe General Aviation Market Analysis by Mordor Intelligence
European general aviation market size in 2026 is estimated at USD 7.24 billion, growing from 2025 value of USD 6.84 billion with 2031 projections showing USD 9.64 billion, growing at 5.9% CAGR over 2026-2031. Growth stems from steady wealth creation among high-net-worth individuals, accelerated replacement of aging fleets, and regulatory momentum toward sustainable propulsion. Fleet modernization amplifies demand for quieter, fuel-efficient aircraft that meet tightening airport limits, while emerging eVTOL platforms open fresh revenue pools in urban corridors. Charter models expand addressable demand by lowering entry barriers, and investments in sustainable aviation fuel (SAF) infrastructure position operators for forthcoming EU mandates. Macroeconomic headwinds, pilot scarcity, and supply constraints in avionics and composites temper the outlook but do not derail the long-term trajectory.
Key Report Takeaways
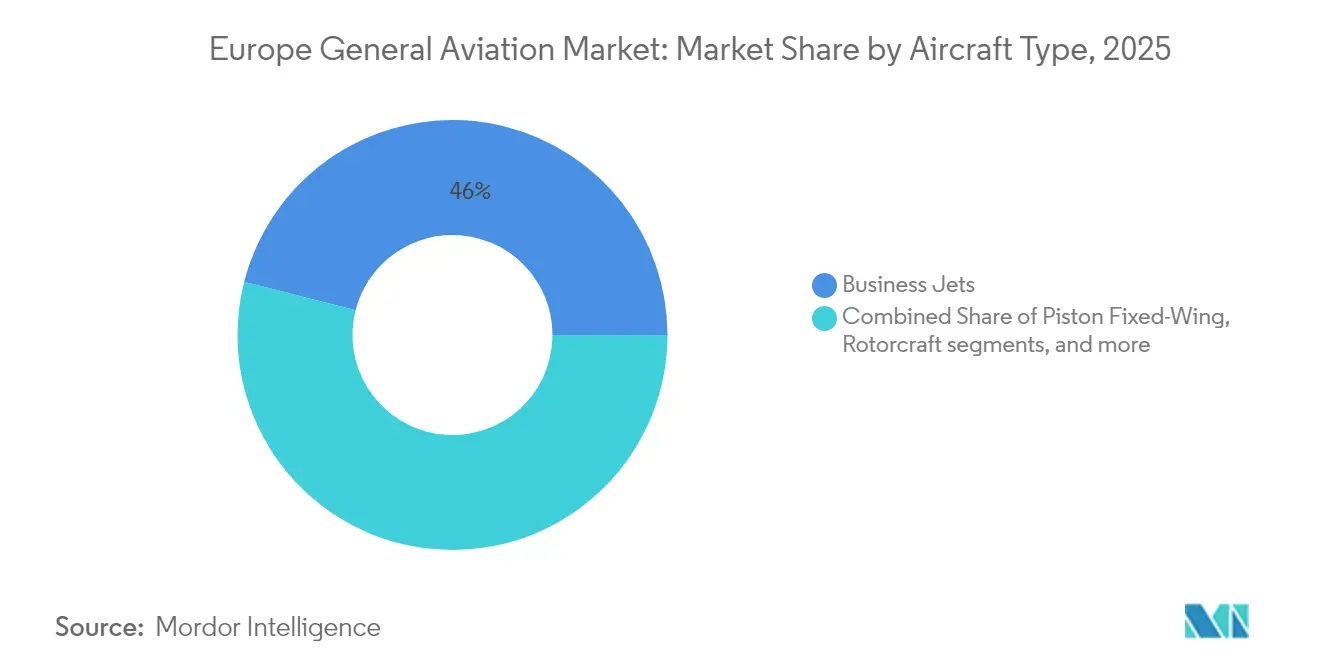
- By aircraft type, business jets led with 46.02% of the European general aviation market share in 2025; AAM eVTOLs are projected to post the fastest 6.85% CAGR through 2031.
- By propulsion, conventional piston and turbine systems accounted for 71.45% of Europe's general aviation market size in 2025, whereas all-electric propulsion is forecasted to advance at a 7.38% CAGR between 2026 and 2031.
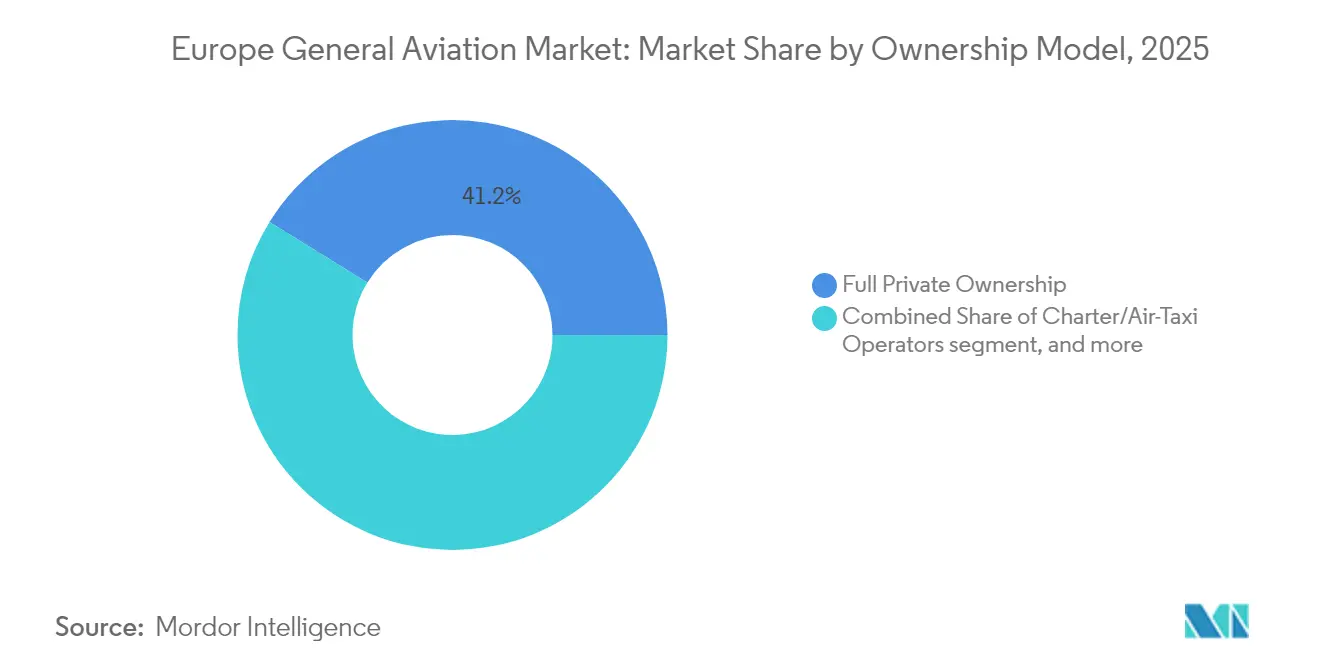
- By ownership, full private ownership held a 41.20% share of the European general aviation market size in 2025; charter and air-taxi fleets are set to register the quickest 6.05% CAGR through 2031.
- By end-user, corporate transport captured a 47.65% share in 2025, while emergency medical and air-ambulance services are forecasted to expand at a 8.74% CAGR to 2031.
- By geography, France commanded 22.60% of the European general aviation market share in 2025; the United Kingdom is expected to grow the fastest at 8.15% CAGR during the forecast window.
Note: Market size and forecast figures in this report are generated using Mordor Intelligence’s proprietary estimation framework, updated with the latest available data and insights as of 2026.
Europe General Aviation Market Trends and Insights
Drivers Impact Analysis*
| Driver | (~) % Impact on CAGR Forecast | Geographic Relevance | Impact Timeline |
|---|---|---|---|
| Rising HNWI base increasing business jet demand | +1.8% | Western Europe, extending to Eastern hubs | Medium term (2-4 years) |
| Fleet renewal for fuel-efficient aircraft | +1.2% | EU-wide, most visible in France, Germany, United Kingdom | Long term (≥4 years) |
| Growth of fractional and charter models | +0.9% | London, Paris, Frankfurt corridors | Short term (≤2 years) |
| EU “Fit-for-55” spurring hybrid/eVTOL uptake | +0.7% | EU members, early adoption in Nordic markets | Long term (≥4 years) |
| SAF-incentivized airport infrastructure | +0.5% | Primary hubs expanding toward regional airports | Medium term (2-4 years) |
| Defense-civil ISR conversion programs | +0.4% | Manufacturing clusters across multiple member states | Medium term (2-4 years) |
| Source: Mordor Intelligence | |||


Rising HNWI Base Boosting Business Jet Demand
Europe’s expanding wealth segment fuels new and pre-owned jet purchases as financial and technology capitals prioritize time-efficient mobility. Business aviation adds EUR 100 billion in annual economic value, indicating deep structural demand.[1]European Business Aviation Association, “Economic Impact Study,” EBAA, ebaa.org Deliveries to Europe equal 13% of global totals, a proportion that steadies even as other regions accelerate, underscoring market maturity rather than decline.[2]Honeywell Aerospace, “Business Aviation Outlook 2024,” Honeywell, aerospace.honeywell.com Fractional programs leverage this demand by offering cost-efficient access and widening the addressable customer base. Concentrated wealth in Switzerland, Monaco, and the City of London shapes aircraft allocation and service-facility placement. Clustering of assets around these hubs supports ancillary services and amplifies localized economic multipliers.
Fleet Renewal for Fuel-efficient Aircraft
Operators accelerate replacement cycles to satisfy tougher emission caps and realize 15–20% fuel-burn savings recorded on latest-generation jets.[3]European Aviation Safety Agency, “ReFuelEU Aviation Regulation,” EASA, easa.europa.eu EU rules mandate 2% SAF in 2025, rising steeply thereafter, making efficiency gains and SAF compatibility commercial imperatives. Quieter engines ease slot access at noise-sensitive airports, lifting aircraft utilization. Investments in advanced avionics and connectivity further enhance charter yields by improving passenger experience. EASA certification ensures new models integrate safety and sustainability upgrades, reinforcing the renewal trend.
Growth of Fractional and Charter Models
Flexible access outpaces outright ownership as companies prioritize liquidity and digital booking platforms compress lead times. Program hours at one leading fractional provider rose 74% yearly, confirming uptake.[4]VistaJet, “2024 Annual Market Report,” VistaJet, vistajet.com Higher utilization of up to 600 hours annually lowers per-flight costs relative to privately held aircraft and attracts middle-market clients. Technology entrepreneurs, in particular, adopt membership cards that minimize capital exposure while preserving schedule control. The shift encourages operators to diversify fleets and base aircraft near demand clusters for rapid dispatch.
EU “Fit-for-55” Spurring Hybrid/eVTOL Uptake
The EU earmarked USD 4.76 billion under the Clean Aviation Partnership, accelerating hybrid-electric research. The regulatory environment now supplies clear certification pathways; EASA published its eVTOL special condition standard in 2024, lowering compliance uncertainty. Manufacturers align product roadmaps to these milestones, enabling earlier commercial entry. Nordic markets seize first-mover advantage due to abundant renewable power for charging infrastructure. Technological progress in battery energy density and flight-control software shortens the timeline to operational rollout.
Restraints Impact Analysis*
| Restraint | (~) % Impact on CAGR Forecast | Geographic Relevance | Impact Timeline |
|---|---|---|---|
| Macro-economic uncertainty and inflation | −1.4% | EU-wide, dampening discretionary spend | Short term (≤2 years) |
| Stringent noise and emission airport limits | −0.8% | Major hubs and dense urban catchments | Medium term (2-4 years) |
| Acute pilot shortage in Europe | −0.6% | Most acute in Northern and Western markets | Long term (≥4 years) |
| Avionics and composites supply disruption | −0.5% | Manufacturing hubs exposed to global logistics volatility | Medium term (2-4 years) |
| Source: Mordor Intelligence | |||
Macro-economic Uncertainty and Inflation
Elevated interest rates raise financing costs, lengthening payback horizons and slowing new aircraft orders. Operators grapple with higher fuel, labor, and maintenance input costs, compressing margins during charter negotiations. Currency swings between the Euro and the US dollar complicate cross-border transactions and delay purchase decisions. Corporate travel budgets remain under tight scrutiny as companies prioritize core investments. Smaller operators with limited cash reserves face liquidity stress, increasing the prospect of consolidation.
Stringent Noise and Emission Airport Limits
Large European hubs impose nighttime curfews and slot quotas that limit general-aviation movements. Older aircraft incur higher landing fees tied to emission classes, eroding charter price competitiveness. Community pressure forces airports to revise environmental management plans, producing new reporting obligations and potential operational delays. Compliance requires investment in monitoring technology and quieter aircraft, adding capital and operating costs. Without upgrades, operators risk exclusion from key markets.
*Our forecasts treat driver/restraint impacts as directional, not additive. The impact forecasts reflect baseline growth, mix effects, and variable interactions.
Segment Analysis
By Aircraft Type: Business jets dominate while eVTOL builds momentum
Business jets held a 46.02% Europe general aviation market share in 2025 as their operating cost and airport versatility match intra-European stage lengths. Fleet planners value sub-3-hour endurance, 4-to-9-seat cabins, and access to secondary runways that bypass major-hub congestion. Large-cabin jets serve transcontinental missions linking corporate headquarters to overseas branches, although utilization remains below pre-2020 levels. Turboprop aircraft anchor regional connectivity and special-mission tasks in mountainous and island geographies. Rotorcraft fleets provide emergency medical services, offshore energy support, and point-to-point city transfers where ground routes underperform. The rapid ascent of eVTOL platforms, forecasted at a 6.85% CAGR, springs from lower trip cost, minimal noise footprint, and compatibility with renewable power grids. EASA's certification road map, published in 2024, clarifies manufacturers' design and safety requirements, catalyzing investment.
Fleet evolution shows operators retiring older business jets, favoring models with improved avionics and fuel efficiency to comply with airport limits. Charter brokers report that modern light jets attract higher load factors and better daily utilization than aging mid-size counterparts. Piston-engine aircraft remain vital for flight training and recreational flying, but confront noise restrictions near populated zones. Several European OEMs pursue hybrid-electric propulsion for turboprop categories, promising lower operating costs and emission compliance. The segment's technology trajectory indicates diversification rather than displacement, positioning each aircraft class to serve its optimal mission envelope within the expanding European general aviation market.


By Propulsion: Conventional Systems Prevail Amid Electric Acceleration
Due to well-established maintenance networks and proven dispatch reliability, conventional piston and turbine engines retain 71.45% of the European general aviation market. Operators continue to upgrade to more fuel-efficient variants that deliver double-digit fuel burn reduction relative to legacy models. All-electric propulsion leads the growth curve with a 7.38% CAGR as battery density improves and regulatory incentives take hold. Hybrid-electric projects bridge endurance gaps and extend route coverage while meeting emission thresholds. Developers showcase retrofit kits enabling older airframes to benefit from partial electrification, widening the addressable fleet.
Energy-infrastructure expansion underpins adoption. Nordic airports use hydro and wind power to install high-capacity chargers, creating early electric corridors. Training academies pilot electric two-seat trainers, citing 40% lower energy costs and quieter operations as attractive to communities. Yet range limitations restrict electric aircraft mainly to sub-300-kilometer sectors for now. Conventional engines evolve with sustainable aviation fuel compatibility, keeping them relevant in the European general aviation market while supplying a transition pathway until battery and hybrid systems fully mature.
By Ownership: Private Fleets Lead as Charter Accelerates
Full private ownership accounted for 41.20% of the European general aviation market size in 2025, reflecting entrenched preferences among ultra-wealthy individuals and corporations demanding immediate availability. Owners weigh higher capital outlay against schedule sovereignty and brand image advantages. Charter and air-taxi providers forecast a 6.05% CAGR, and court clients seek flexibility without asset risk. Fractional ownership fills the middle ground by slicing equity into hours-based shares, smoothing cost across user groups. The model benefits from pan-European regulatory harmonization that facilitates cross-border operations.
Digital disruption reshapes demand patterns. On-demand apps cut booking times to minutes, widen price transparency, and access younger clientele unattached to traditional brokers. Charter providers position diverse fleets at strategic airports to offer near-instant uplift, boosting utilization to 600 hours annually. Training institutions and government agencies remain steady owners, anchored by mission specificity and regulatory mandates. Overall, shifting attitudes toward asset-light options redeploy capital into core enterprises, lifting demand for shared-use offerings across the European general aviation market.
By End-User: Corporate Transport Dominates While Medical Missions Surge
Corporate travel held 47.65% of the European general aviation market share in 2025 as executives prize direct routing, privacy, and time savings. Financial hubs such as London, Frankfurt, and Zurich generate dense and predictable demand that underpins scheduling efficiency. Emergency medical and air-ambulance services, projected at a 8.74% CAGR, gain momentum through aging demographics and rural hospital consolidation. Helicopter emergency medical services fly critical patients within the “golden hour,” governments subsidize operations to bridge healthcare access gaps.
Geography Analysis
France maintains leadership through a dense national network of paved and grass strips that welcome everything from light piston trainers to large-cabin jets. The government channels R&D grants toward hybrid-electric prototypes, encouraging OEMs to co-locate testing facilities. Charter operators benefit from favorable landing-fee structures at regional airports that reduce reposition costs, reinforcing competitive pricing. International companies position aircraft in Paris-Le Bourget to capitalize on customs and immigration efficiency. Proximity to major aerospace suppliers shortens parts-delivery windows, sustaining high fleet availability across the European general aviation market.
The United Kingdom’s rapid expansion draws upon high-value industries demanding swift travel between London, Edinburgh, Manchester, and continental centers. Recent policy updates streamline aircraft import duties, trimming acquisition friction. Private-equity groups invest in FBO upgrades at Biggin Hill and Farnborough, enhancing passenger amenities and turnaround times. SAF blending trials achieve commercial scale at Heathrow and London City, demonstrating feasibility for business-aviation uplift. These steps support the region’s outsized contribution to projected market growth.
Germany sustains a stable demand through export-oriented corporations that favor time-compressed itineraries across plant networks. A strong tradition in engineering underpins a vibrant MRO sector, keeping life-cycle costs predictable. Italy merges corporate and leisure demand as Milan and Rome anchor business traffic while coastal and alpine resort areas generate seasonal peaks. Spain leverages tourism inflows, flight training weather advantages, and rising medical missions connecting island provinces. Although smaller in absolute terms, Nordic nations emerge as technological incubators for electric and autonomous flight, underscoring their strategic relevance to the broader European general aviation market.
Competitive Landscape
The European general aviation arena exhibits moderate concentration. Bombardier, Dassault Aviation, and Textron dominate jet deliveries through recurrent product refresh cycles that respond to noise and emission constraints. Each maintains factory-authorized service centers across major hubs, embedding high switching costs for operators while assuring uptime. Dassault leverages French aerospace policy to integrate cutting-edge avionics ahead of global rollouts. Bombardier expands its Berlin and Biggin Hill facilities, shrinking maintenance ferry time for customers.
New entrants such as Archer Aviation and Joby Aviation exploit the eVTOL segment, attracting venture capital and municipal partnerships for vertiport infrastructure. Certification savvy is a decisive advantage for incumbents; their track record with EASA shaves months off approval timelines, but streamlined electric-aircraft pathways level the field for innovators. Strategic alliances blossom: Rolls-Royce collaborates with Tecnam on electric trainers, and Safran teams with Diamond on hybrid systems, showing a cooperative landscape pursuing propulsion transformation.
Supply-chain fragility shapes competitive tactics. Airframe manufacturers lock multiyear contracts for composite materials to contain cost volatility. Engine OEMs explore localized casting capacity within the EU to buffer against overseas shipping delays. Pilot-training schools form strategic accords with aircraft makers to secure delivery slots, linking the human-capital pipeline to hardware availability. Digital platforms integrate charter booking, flight-planning, and carbon-offset modules, enhancing customer experience and yielding data streams that inform fleet-deployment decisions across the European general aviation market.
Europe General Aviation Industry Leaders
Bombardier Inc.
Textron Inc.
Airbus SE
Pilatus Aircraft Ltd.
Dassault Aviation SA
- *Disclaimer: Major Players sorted in no particular order

Recent Industry Developments
- October 2025: Archer Aviation secured a competitive bid to acquire Lilium's extensive portfolio of 300 eVTOL patents for USD 20.94 million. This acquisition strengthens Archer's technological capabilities with advanced innovations in ducted fans, battery systems, and flight controls, as the advanced air mobility sector continues to consolidate.
- May 2025: Leonardo commenced EBACE 2025 with a significant order for three additional AW109 Trekkers from its long-standing distributor for the UK and Ireland. Scheduled for delivery in 2027, these VIP-configured helicopters add to the five AW109 GrandNews that Sloane ordered earlier this year during the Verticon event in March, held in Dallas.
- December 2023: Tecnam announced that the renowned Scottish flight training academy, ACS Aviation, ordered two P-Mentors to be added to its current fleet to expand its capabilities in 2023.


Europe General Aviation Market Report Scope
By Aircraft Type
| Business Jets | Large Jet |
| Mid-Size Jet | |
| Light/Very-Light Jet | |
| Turboprop Fixed-Wing | |
| Piston Fixed-Wing | |
| Rotorcraft | |
| Advanced Air Mobility eVTOLs |
By Propulsion Type
| Conventional Piston/Turbine |
| Hybrid-Electric |
| All-Electric |
By Ownership Model
| Full Private Ownership |
| Fractional Ownership |
| Charter/Air-Taxi Operators |
| Training and Academic Institutions |
| Government and Special-Mission Operators |
By End-User Application
| Business/Corporate Transport |
| Personal and Leisure Flying |
| Special Mission (ISR, Surveillance, Law Enforcement) |
| Emergency Medical/Air-Ambulance |
| Pilot Training |
By Geography
| United Kingdom |
| France |
| Germany |
| Italy |
| Spain |
| Netherlands |
| Russia |
| Rest of Europe |
| By Aircraft Type | Business Jets | Large Jet |
| Mid-Size Jet | ||
| Light/Very-Light Jet | ||
| Turboprop Fixed-Wing | ||
| Piston Fixed-Wing | ||
| Rotorcraft | ||
| Advanced Air Mobility eVTOLs | ||
| By Propulsion Type | Conventional Piston/Turbine | |
| Hybrid-Electric | ||
| All-Electric | ||
| By Ownership Model | Full Private Ownership | |
| Fractional Ownership | ||
| Charter/Air-Taxi Operators | ||
| Training and Academic Institutions | ||
| Government and Special-Mission Operators | ||
| By End-User Application | Business/Corporate Transport | |
| Personal and Leisure Flying | ||
| Special Mission (ISR, Surveillance, Law Enforcement) | ||
| Emergency Medical/Air-Ambulance | ||
| Pilot Training | ||
| By Geography | United Kingdom | |
| France | ||
| Germany | ||
| Italy | ||
| Spain | ||
| Netherlands | ||
| Russia | ||
| Rest of Europe |


Market Definition
- Aircraft Type - General Aviation includes aircraft used for corporate aviation, business aviation and other aerial works.
- Sub-Aircraft Type - Business Jets, Piston Fixed-Wing Aircraft, and helicopters and turboprop aircraft are taken into consideration.
- Body Type - Light Jets, Mid-Size Jets, and Large Jets according to their ability to carry passengers and flying distance ranges have been included under this study.
| Keyword | Definition |
|---|---|
| IATA | IATA stands for the International Air Transport Association, a trade organization composed of airlines around the world that has an influence over the commercial aspects of flight. |
| ICAO | ICAO stands for International Civil Aviation Organization, a specialized agency of the United Nations that supports aviation and navigation around the globe. |
| Air Operator Certificate (AOC) | A certificate granted by a National Aviation Authority permitting the conduct of commercial flying activities. |
| Certificate Of Airworthiness (CoA) | A Certificate Of Airworthiness (CoA) is issued for an aircraft by the civil aviation authority in the state in which the aircraft is registered. |
| Gross Domestic Product (GDP) | Gross domestic product (GDP) is a monetary measure of the market value of all the final goods and services produced in a specific time period by countries. |
| RPK (Revenue Passenger Kilometres) | The RPK of an airline is the sum of the products obtained by multiplying the number of revenue passengers carried on each flight stage by the stage distance - it is the total number of kilometers traveled by all revenue passengers. |
| Load Factor | The load factor is a metric used in the airline industry that measures the percentage of available seating capacity that has been filled with passengers. |
| Original Equipment Manufacturer (OEM) | An original equipment manufacturer (OEM) traditionally is defined as a company whose goods are used as components in the products of another company, which then sells the finished item to users. |
| International Transportation Safety Association (ITSA) | International Transportation Safety Association (ITSA) is an international network of heads of independent safety investigation authorities (SIA). |
| Available Seats Kilometre (ASK) | This metric is calculated by multiplying Available Seats (AS) in one flight, defined above, multiplied by the distance flown. |
| Gross Weight | The fully-loaded weight of an aircraft, also known as “takeoff weight,” which includes the combined weight of passengers, cargo, and fuel. |
| Airworthiness | The ability of an aircraft, or other airborne equipment or system, to operate in flight and on the ground without significant hazard to aircrew, ground crew, passengers or to other third parties. |
| Airworthiness Standards | Detailed and comprehensive design and safety criteria applicable to the category of aeronautical product (aircraft, engine or propeller). |
| Fixed Base Operator (FBO) | A business or organization that operates at an airport. An FBO provides aircraft operating services like maintenance, fueling, flight training, charter services, hangaring, and parking. |
| High Net worth Individuals (HNWIs) | High Net worth Individuals (HNWIs) are individuals with over USD 1 million in liquid financial assets. |
| Ultra High Net worth Individuals (UHNWIs) | Ultra High Net worth Individuals (UHNWIs) are individuals with over USD 30 million in liquid financial assets. |
| Federal Aviation Administration (FAA) | The division of the Department of Transportation is concerned with aviation. It operates Air Traffic Control and regulates everything from aircraft manufacturing to pilot training to airport operations in the United States. |
| EASA (European Aviation Safety Agency) | The European Aviation Safety Agency is a European Union agency established in 2002 with the task of overseeing civil aviation safety and regulation. |
| Airborne Warning and Control System (AW&C) aircraft | Airborne Warning and Control System (AEW&C) aircraft is equipped with a powerful radar and on-board command and control center to direct the armed forces. |
| The North Atlantic Treaty Organization (NATO) | The North Atlantic Treaty Organization (NATO), also called the North Atlantic Alliance, is an intergovernmental military alliance between 30 member states – 28 European and two North American. |
| Joint Strike Fighter (JSF) | Joint Strike Fighter (JSF) is a development and acquisition program intended to replace a wide range of existing fighter, strike, and ground attack aircraft for the United States, the United Kingdom, Italy, Canada, Australia, the Netherlands, Denmark, Norway, and formerly Turkey. |
| Light Combat Aircraft (LCA) | A light combat aircraft (LCA) is a light, multirole jet/turboprop military aircraft, commonly derived from advanced trainer designs, designed for engaging in light combat. |
| Stockholm International Peace Research Institute (SIPRI) | Stockholm International Peace Research Institute (SIPRI) is an international institute that provides data, analysis, and recommendations for armed conflict, military expenditure, and arms trade as well as disarmament and arms control. |
| Maritime Patrol Aircraft (MPA) | A maritime patrol aircraft (MPA), also known as maritime reconnaissance aircraft is a fixed-wing aircraft designed to operate for long durations over water in maritime patrol roles, in particular, anti-submarine warfare (ASW), anti-ship warfare (AShW), and search and rescue (SAR). |
| Mach Number | The Mach number is defined as the ratio of true airspeed to the speed of sound at the altitude of a given aircraft. |
| Stealth Aircraft | Stealth is a Common term applied to low observable (LO) technology and doctrine, that makes an aircraft near invisible to radar, infrared or visual detection. |


Research Methodology
Mordor Intelligence follows a four-step methodology in all our reports.
- Step-1: Identify Key Variables: In order to build a robust forecasting methodology, the variables and factors identified in Step-1 are tested against available historical market numbers. Through an iterative process, the variables required for market forecast are set and the model is built on the basis of these variables.
- Step-2: Build a Market Model: Market-size estimations for the historical and forecast years have been provided in revenue and volume terms. For sales conversion to volume, the average selling price (ASP) is kept constant throughout the forecast period for each country, and inflation is not a part of the pricing.
- Step-3: Validate and Finalize: In this important step, all market numbers, variables and analyst calls are validated through an extensive network of primary research experts from the market studied. The respondents are selected across levels and functions to generate a holistic picture of the market studied.
- Step-4: Research Outputs: Syndicated Reports, Custom Consulting Assignments, Databases & Subscription Platforms


