Europe Fungicide Market Size and Share
Market Overview
| Study Period | 2018 - 2031 |
|---|---|
| Forecast Data Period | 2026 - 2031 |
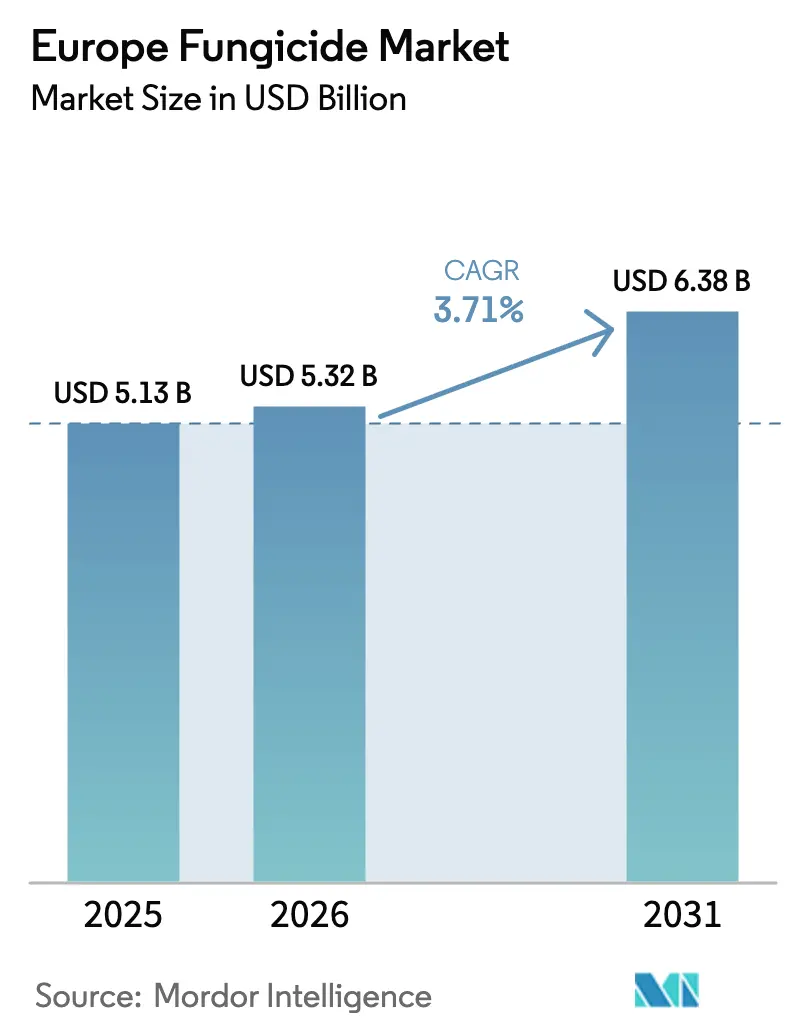
| Base Year Market Size (2025) | USD 5.13 Billion |
| Market Size (2026) | USD 5.32 Billion |
| Market Size (2031) | USD 6.38 Billion |
| Growth Rate (2026 - 2031) | 3.71% CAGR |
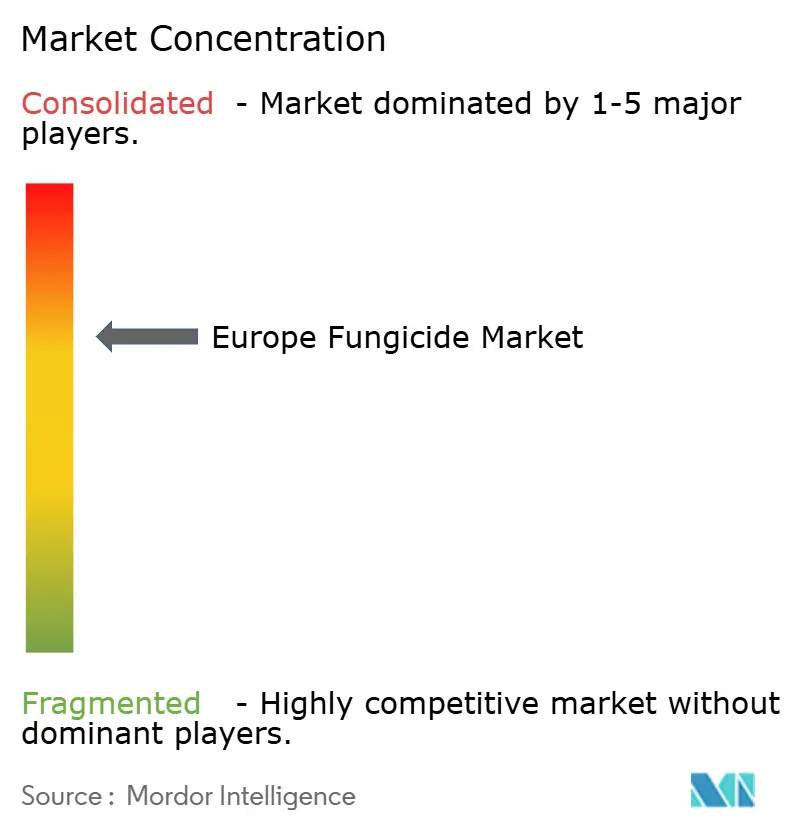
| Market Concentration | Medium |
Major Players *Disclaimer: Major Players sorted in no particular order Image © Mordor Intelligence. Reuse requires attribution under CC BY 4.0. | |
Europe Fungicide Market Analysis by Mordor Intelligence
The Europe fungicide market size is expected to grow from USD 5.13 billion in 2025 to USD 5.32 billion in 2026 and is forecast to reach USD 6.38 billion by 2031 at 3.71% CAGR over 2026-2031. Climatic volatility is intensifying fungal pressure in every major production belt, while the European Union’s Farm to Fork strategy mandates chemical-use reduction that is reshaping portfolio priorities across the Europe fungicide market. Growers are shifting from calendar sprays to sensor-guided programs, and the pace of synthetic triazole withdrawals is widening demand for bio-based active ingredients compatible with organic certifications. Controlled-environment acreage is expanding rapidly in the Netherlands, Denmark, and the United Kingdom, creating new use cases for residue-free formulations. At the same time, post-Brexit regulatory divergence obliges suppliers to juggle dual maximum-residue-limit (MRL) regimes when serving the Europe fungicide market, further complicating product positioning and inventory planning.
Key Report Takeaways
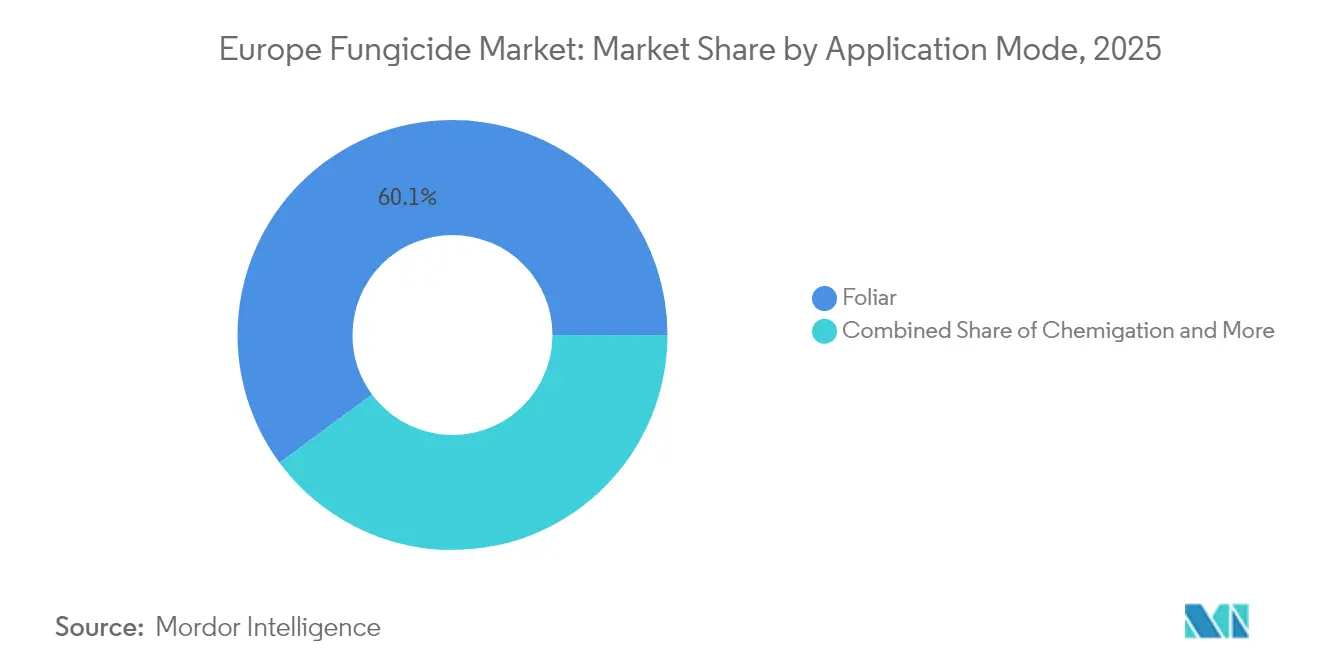
- By application mode, foliar treatments held 60.12% of Europe fungicide market share in 2025, and are forecast to expand at a 3.82% CAGR through 2031.
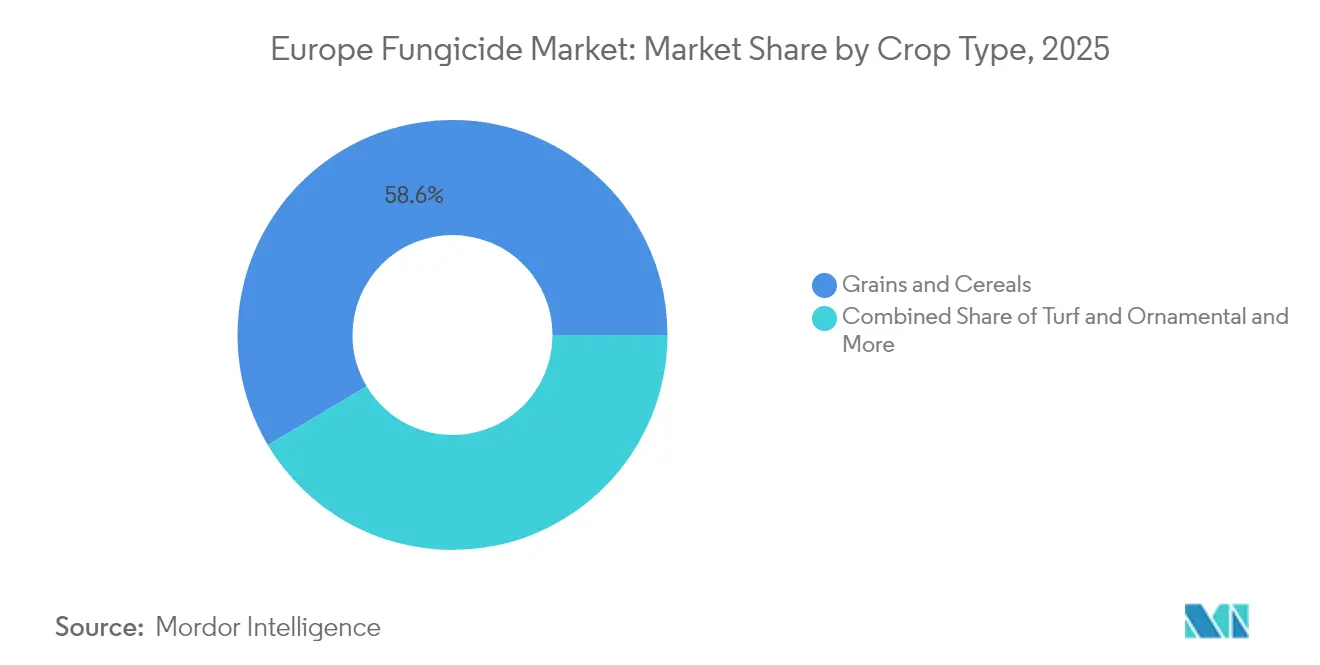
- By crop type, grains and cereals commanded a 58.55% share of Europe fungicide market size in 2025; turf and ornamental uses are projected to grow at a 4.02% CAGR to 2031.
- By geography, Spain led with an 17.65% revenue slice of the Europe fungicide market in 2025, whereas France is advancing at a 5.74% CAGR through 2031.
Note: Market size and forecast figures in this report are generated using Mordor Intelligence’s proprietary estimation framework, updated with the latest available data and insights as of 2026.
Europe Fungicide Market Trends and Insights
Drivers Impact Analysis*
| Driver | (~) % Impact on CAGR Forecast | Geographic Relevance | Impact Timeline |
|---|---|---|---|
| Rising incidence of fungal diseases under climate volatility | +0.8% | Spain, France, Italy, Central Europe | Long term (≥ 4 years) |
| Europe Union-wide adoption of integrated pest and resistance-management programs | +1.2% | Germany, France, Netherlands, Eastern Europe | Medium term (2-4 years) |
| Continuous launch of low-toxicity and bio-based active ingredients | +0.6% | Northern Europe, organic belts | Medium term (2-4 years) |
| Expansion of controlled-environment agriculture across Northern Europe | +0.9% | Netherlands, Denmark, Germany, United Kingdom | Short term (≤ 2 years) |
| Rapid growth of biostimulant–fungicide co-formulations during organic transition | +0.7% | France, Germany, and Italy | Medium term (2-4 years) |
| Post-Brexit divergence in United Kingdom MRLs reshaping usage patterns | +0.5% | United Kingdom, Europe exporters | Short term (≤ 2 years) |
| Source: Mordor Intelligence | |||


Rising Incidence of Fungal Diseases Under Climate Volatility
Climate volatility fundamentally alters European disease pressure patterns, with Spain reporting a 34% increase in downy mildew incidence across wine-growing regions during 2024's unprecedented rainfall events [1]Source: European Environment Agency, “Climate Change Adaptation in Agriculture Sector,” eea.europa.eu . Rising temperatures enable pathogen survival in previously inhospitable northern latitudes, while erratic precipitation creates optimal infection windows that challenge traditional spray timing protocols. The European Centre for Disease Prevention and Control documents shifting disease maps that require adaptive management strategies, particularly for high-value crops where yield losses translate directly to economic impact. France's wine industry invests EUR 127 million (USD 135 million) annually in climate-adaptive disease management systems that integrate weather monitoring with precision fungicide application technologies.
Europe Union-wide Adoption of Integrated Pest and Resistance-Management Programs
Integrated pest management adoption accelerates across EU member states, with Germany's Federal Office of Consumer Protection mandating IPM protocols for 89% of commercial agricultural operations by 2024. The European Farm to Fork Strategy targets a 50% reduction in chemical pesticide use by 2030, driving systematic adoption of resistance management protocols that rotate fungicide modes of action and integrate biological control agents. The Netherlands' precision agriculture initiatives demonstrate 23% fungicide reduction while maintaining yield stability through sensor-guided application timing and targeted disease forecasting models.
Continuous Launch of Low-toxicity and Bio-based Active Ingredients
Bio-based active ingredient development accelerates through Europe's regulatory pathways, with EFSA (European Food Safety Authority) approving 12 new biological fungicides in 2024 compared to 3 conventional synthetic compounds. The European Commission's Horizon Europe program allocates EUR 2.4 billion (USD 2.6 billion) to sustainable agriculture research, prioritizing biological control solutions that meet organic certification standards while delivering commercial efficacy. Denmark's agricultural biotechnology sector attracts USD 340 million in venture capital funding for microbial fungicide development, leveraging the country's fermentation expertise and regulatory-friendly environment.
Expansion of Controlled-Environment Agriculture Across Northern Europe
Controlled-environment agriculture expansion transforms Northern European fungicide demand patterns, with the Netherlands adding 847 hectares of high-tech greenhouse capacity in 2024, representing 12% annual growth. These systems require specialized fungicide formulations optimized for enclosed environments, where humidity control and air circulation create unique disease pressure dynamics that favor precision application technologies. Denmark's vertical farming initiatives attract EUR 156 million (USD 166 million) in investment capital, creating demand for residue-free fungicides compatible with hydroponic systems and consumer safety requirements. The United Kingdom's post-Brexit agricultural strategy emphasizes controlled-environment food security, with government incentives supporting 23 new greenhouse projects that prioritize sustainable crop protection protocols and energy-efficient production systems.
Restraints Impact Analysis*
| Restraint | (~) % Impact on CAGR Forecast | Geographic Relevance | Impact Timeline |
|---|---|---|---|
| Stringent European restrictions and non-renewal of high-risk triazoles | -0.9% | Europe-wide, fast phase-outs in Germany, France, Netherlands | Short term (≤ 2 years) |
| Consumer shift toward pesticide-free produce limiting spray frequency | -0.6% | Northern Europe, organic clusters | Medium term (2-4 years) |
| Supply bottlenecks for key triazole intermediates from Asia | -1.1% | Import-dependent markets | Short term (≤ 2 years) |
| Increasing adoption of disease-resistant crop cultivars | -0.4% | Germany, France, and Netherlands | Long term (≥ 4 years) |
| Source: Mordor Intelligence | |||
Stringent European Restrictions and Non-Renewal of High-Risk Triazoles
European regulatory authorities accelerate triazole fungicide restrictions, with EFSA declining renewal for 6 active ingredients in 2024 and initiating review procedures for an additional 11 compounds based on endocrine disruption concerns[2]Source: European Food Safety Authority, “Pesticides Database and Risk Assessment,” efsa.europa.eu. The European Commission's precautionary approach to chemical safety creates market disruptions as farmers lose access to established disease control tools, particularly for cereals, where triazole resistance management has become standard practice. Germany's Federal Office of Consumer Protection implements emergency use restrictions on tebuconazole formulations, affecting 340,000 hectares of winter wheat production and forcing rapid adoption of alternative chemistry platforms.
Consumer Shift Toward Pesticide-free Produce Limiting Spray Frequency
Consumer preference for pesticide-free produce intensifies across European markets, with organic food sales reaching EUR 52.8 billion (USD 56.2 billion) in 2024, representing 9.1% annual growth and 4.2% of total food expenditure. Retail chains implement zero-residue certification programs that restrict fungicide applications beyond organic standards, creating market premiums for producers who eliminate synthetic chemical inputs entirely [3]Source: European Commission, “Organic Farming in the EU,” ec.europa.eu. Germany's discount retailers mandate residue testing protocols that effectively limit spray frequency for conventional producers supplying private-label programs, reducing fungicide demand despite maintained acreage under production.
*Our forecasts treat driver/restraint impacts as directional, not additive. The impact forecasts reflect baseline growth, mix effects, and variable interactions.
Segment Analysis
By Application Mode: Foliar Applications Lead Precision Integration
Precision agriculture integration drives foliar application dominance at 60.12% market share in 2025, with the segment projecting 3.82% CAGR through 2031 as controlled-environment agriculture expansion across Northern Europe creates demand for specialized enclosed-system formulations. This significant market position is attributed to the method's superior efficiency in delivering fungicides directly to plant surfaces and its widespread adoption across various crop types.
Farmers across Europe prefer foliar application due to its ability to provide better coverage and direct contact with target pathogens, making it particularly effective in controlling diseases such as powdery mildew, rust, blight, and other foliar diseases. The method's popularity is further enhanced by its flexibility in application timing, allowing farmers to respond quickly to disease outbreaks and apply treatments when conditions are optimal for disease control. Additionally, the advancement in spraying technologies and equipment has made foliar application more precise and cost-effective, contributing to its continued dominance in the market.


By Crop Type: Cereals Anchor Volume While Specialty Segments Drive Innovation
Grains and cereals maintain a 58.55% market share in 2025, reflecting the continent's food security priorities and climate-adaptive production systems that require consistent disease protection despite regulatory restrictions on traditional chemistry platforms. The segment's dominance is further reinforced by the widespread cultivation of crops like wheat, corn, rice, and barley across the region, which are highly susceptible to fungal diseases such as rust, smut, and fusarium head blight. Farmers in major grain-producing countries like France, Germany, and Russia heavily rely on fungicides to protect their crops and ensure high yields. The adoption of precision agriculture techniques and advanced spraying equipment has enabled more accurate and targeted application of fungicides in grain crops, further strengthening the segment's market position.
Turf and ornamental segments project the fastest growth at 4.02% CAGR through 2031, driven by urbanization trends and expanding hospitality infrastructure that demands consistent landscape aesthetics across European metropolitan areas. The segment's expansion is particularly notable in countries like the Netherlands, which has a strong floriculture industry and an extensive logistics network for ornamental plants. The increasing recognition of the importance of disease management in maintaining the aesthetic value and health of turf and ornamental plants is driving the demand for specialized fungicide solutions. Additionally, the growing investment in golf courses, sports fields, and public spaces across Europe is creating new opportunities for fungicide applications in the turf sector.
Geography Analysis
Spain leads with 17.65% market share in 2025, leveraging diverse agricultural systems spanning Mediterranean horticulture, Atlantic cereals, and intensive greenhouse production that create sustained demand for specialized fungicide solutions. The country's agricultural export orientation drives adoption of residue-compliant formulations that meet international market standards, while climate volatility intensifies disease pressure across wine-growing regions and citrus production areas. Spanish farmers have increasingly adopted sophisticated disease management practices, particularly in protecting high-value crops such as olives, wheat, and barley. The combination of a diverse crop portfolio, intensive farming practices, and the prevalence of fungal diseases has established Spain as a crucial market for commercial fungicide manufacturers.
France emerges as the fastest-growing market with 5.74% CAGR through 2031, propelled by government-backed organic transition programs that create demand for biostimulant-fungicide co-formulations and biological alternatives. The country's agricultural practices emphasize disease management through both chemical fungicides and resistant variety cultivation. The dominance of foliar fungicide application methods, preferred by farmers for their effectiveness in controlling foliar diseases, has contributed to the market's robust growth. French agricultural policies and farmer awareness programs have further strengthened the market's expansion potential.
Northern European markets, including the Netherlands and Denmark, drive controlled-environment agriculture expansion, with greenhouse systems requiring specialized formulations optimized for enclosed production environments where humidity control and precision application create unique disease management opportunities. Germany maintains a significant market presence through precision agriculture adoption and controlled-environment expansion, while Italy's specialty crop focus generates premium pricing opportunities for innovative formulations.
Competitive Landscape
The European fungicide market exhibits a moderately consolidated structure dominated by global agrochemical conglomerates with extensive research capabilities and established distribution networks. Syngenta Group, BASF SE, Bayer AG, UPL Limited, and Corteva Agriscience are major players that leverage their broad product portfolios, technical expertise, and strong financial resources to maintain their market positions. Local specialists maintain their presence through niche market focus and a deep understanding of regional agricultural needs, though their market share remains limited compared to multinational corporations.
The market has witnessed significant merger and acquisition activities, primarily driven by the need to expand product portfolios and geographical reach. These consolidations have resulted in stronger market positions for acquiring companies, enabling them to offer comprehensive crop protection chemical solutions. The integration of acquired technologies and distribution networks has created more robust market offerings, while also leading to increased market concentration. Companies are increasingly focusing on strategic partnerships with local distributors and agricultural service providers to enhance their market penetration and customer reach.
Success in the European fungicide market increasingly depends on companies' ability to develop sustainable and environmentally friendly solutions while maintaining product efficacy. Market incumbents are strengthening their positions through continuous investment in research and development, focusing on novel active ingredients and improved formulations. Building strong relationships with distributors and farmers through technical support and integrated crop management solutions has become crucial for maintaining market share. Companies are also expanding their digital capabilities to provide precision agriculture solutions and improve product application efficiency.
Europe Fungicide Industry Leaders
Syngenta Group
BASF SE
Bayer AG
Corteva Agriscience
UPL Limited
- *Disclaimer: Major Players sorted in no particular order

Recent Industry Developments
- February 2023: Corteva Agriscience launched Univoq, the company's first fungicide product designed specifically for grains. With Inatreq's distinctive mode of action, Univoq delivers preventative, curative, and long-lasting efficacy on the main diseases that endanger cereals as compared to the already available tools.
- February 2023: Syngenta affirmed its intent to maintain its position as the industry standard in the tomato market by introducing Orondis Ultra, a significant advancement in mildew avoidance.
- January 2023: Bayer formed a new partnership with Oerth Bio to enhance crop protection technology and create more eco-friendly crop protection solutions.


Europe Fungicide Market Report Scope
Chemigation, Foliar, Fumigation, Seed Treatment, Soil Treatment are covered as segments by Application Mode. Commercial Crops, Fruits & Vegetables, Grains & Cereals, Pulses & Oilseeds, Turf & Ornamental are covered as segments by Crop Type. France, Germany, Italy, Netherlands, Russia, Spain, Ukraine, United Kingdom are covered as segments by Country.| Chemigation |
| Foliar |
| Fumigation |
| Seed Treatment |
| Soil Treatment |
| Commercial Crops |
| Fruits & Vegetables |
| Grains & Cereals |
| Pulses & Oilseeds |
| Turf & Ornamental |
| France |
| Germany |
| Italy |
| Netherlands |
| Russia |
| Spain |
| Ukraine |
| United Kingdom |
| Rest of Europe |
| Application Mode | Chemigation |
| Foliar | |
| Fumigation | |
| Seed Treatment | |
| Soil Treatment | |
| Crop Type | Commercial Crops |
| Fruits & Vegetables | |
| Grains & Cereals | |
| Pulses & Oilseeds | |
| Turf & Ornamental | |
| Geography | France |
| Germany | |
| Italy | |
| Netherlands | |
| Russia | |
| Spain | |
| Ukraine | |
| United Kingdom | |
| Rest of Europe |


Market Definition
- Function - Fungicides are chemicals used to control or prevent fungi from damaging the crop and prevent yield loss.
- Application Mode - Foliar, Seed Treatment, Soil Treatment, Chemigation, and Fumigation are the different type of application modes through which crop protection chemicals are applied to the crops.
- Crop Type - This represents the consumption of crop protection chemicals by Cereals, Pulses, Oilseeds, Fruits, Vegetables, Turf, and Ornamental crops.
| Keyword | Definition |
|---|---|
| IWM | Integrated weed management (IWM) is an approach to incorporate multiple weed control techniques throughout the growing season to give producers the best opportunity to control problematic weeds. |
| Host | Hosts are the plants that form relationships with beneficial microorganisms and help them colonize. |
| Pathogen | A disease-causing organism. |
| Herbigation | Herbigation is an effective method of applying herbicides through irrigation systems. |
| Maximum residue levels (MRL) | Maximum Residue Limit (MRL) is the maximum allowed limit of pesticide residue in food or feed obtained from plants and animals. |
| IoT | The Internet of Things (IoT) is a network of interconnected devices that connect and exchange data with other IoT devices and the cloud. |
| Herbicide-tolerant varieties (HTVs) | Herbicide-tolerant varieties are plant species that have been genetically engineered to be resistant to herbicides used on crops. |
| Chemigation | Chemigation is a method of applying pesticides to crops through an irrigation system. |
| Crop Protection | Crop protection is a method of protecting crop yields from different pests, including insects, weeds, plant diseases, and others that cause damage to agricultural crops. |
| Seed Treatment | Seed treatment helps to disinfect seeds or seedlings from seed-borne or soil-borne pests. Crop protection chemicals, such as fungicides, insecticides, or nematicides, are commonly used for seed treatment. |
| Fumigation | Fumigation is the application of crop protection chemicals in gaseous form to control pests. |
| Bait | A bait is a food or other material used to lure a pest and kill it through various methods, including poisoning. |
| Contact Fungicide | Contact pesticides prevent crop contamination and combat fungal pathogens. They act on pests (fungi) only when they come in contact with the pests. |
| Systemic Fungicide | A systemic fungicide is a compound taken up by a plant and then translocated within the plant, thus protecting the plant from attack by pathogens. |
| Mass Drug Administration (MDA) | Mass drug administration is the strategy to control or eliminate many neglected tropical diseases. |
| Mollusks | Mollusks are pests that feed on crops, causing crop damage and yield loss. Mollusks include octopi, squid, snails, and slugs. |
| Pre-emergence Herbicide | Preemergence herbicides are a form of chemical weed control that prevents germinated weed seedlings from becoming established. |
| Post-emergence Herbicide | Postemergence herbicides are applied to the agricultural field to control weeds after emergence (germination) of seeds or seedlings. |
| Active Ingredients | Active ingredients are the chemicals in pesticide products that kill, control, or repel pests. |
| United States Department of Agriculture (USDA) | The Department of Agriculture provides leadership on food, agriculture, natural resources, and related issues. |
| Weed Science Society of America (WSSA) | The WSSA, a non-profit professional society, promotes research, education, and extension outreach activities related to weeds. |
| Suspension concentrate | Suspension concentrate (SC) is one of the formulations of crop protection chemicals with solid active ingredients dispersed in water. |
| Wettable powder | A wettable powder (WP) is a powder formulation that forms a suspension when mixed with water prior to spraying. |
| Emulsifiable concentrate | Emulsifiable concentrate (EC) is a concentrated liquid formulation of pesticide that needs to be diluted with water to create a spray solution. |
| Plant-parasitic nematodes | Parasitic Nematodes feed on the roots of crops, causing damage to the roots. These damages allow for easy plant infestation by soil-borne pathogens, which results in crop or yield loss. |
| Australian Weeds Strategy (AWS) | The Australian Weeds Strategy, owned by the Environment and Invasives Committee, provides national guidance on weed management. |
| Weed Science Society of Japan (WSSJ) | WSSJ aims to contribute to the prevention of weed damage and the utilization of weed value by providing the chance for research presentation and information exchange. |


Research Methodology
Mordor Intelligence follows a four-step methodology in all our reports.
- Step-1: Identify Key Variables: In order to build a robust forecasting methodology, the variables and factors identified in Step-1 are tested against available historical market numbers. Through an iterative process, the variables required for market forecast are set and the model is built on the basis of these variables.
- Step-2: Build a Market Model: Market-size estimations for the forecast years are in nominal terms. Inflation is not a part of the pricing, and the average selling price (ASP) is kept constant throughout the forecast period.
- Step-3: Validate and Finalize: In this important step, all market numbers, variables and analyst calls are validated through an extensive network of primary research experts from the market studied. The respondents are selected across levels and functions to generate a holistic picture of the market studied.
- Step-4: Research Outputs: Syndicated Reports, Custom Consulting Assignments, Databases & Subscription Platforms


