
Market Overview
| Study Period | 2020 - 2031 |
|---|---|
| Forecast Data Period | 2026 - 2031 |
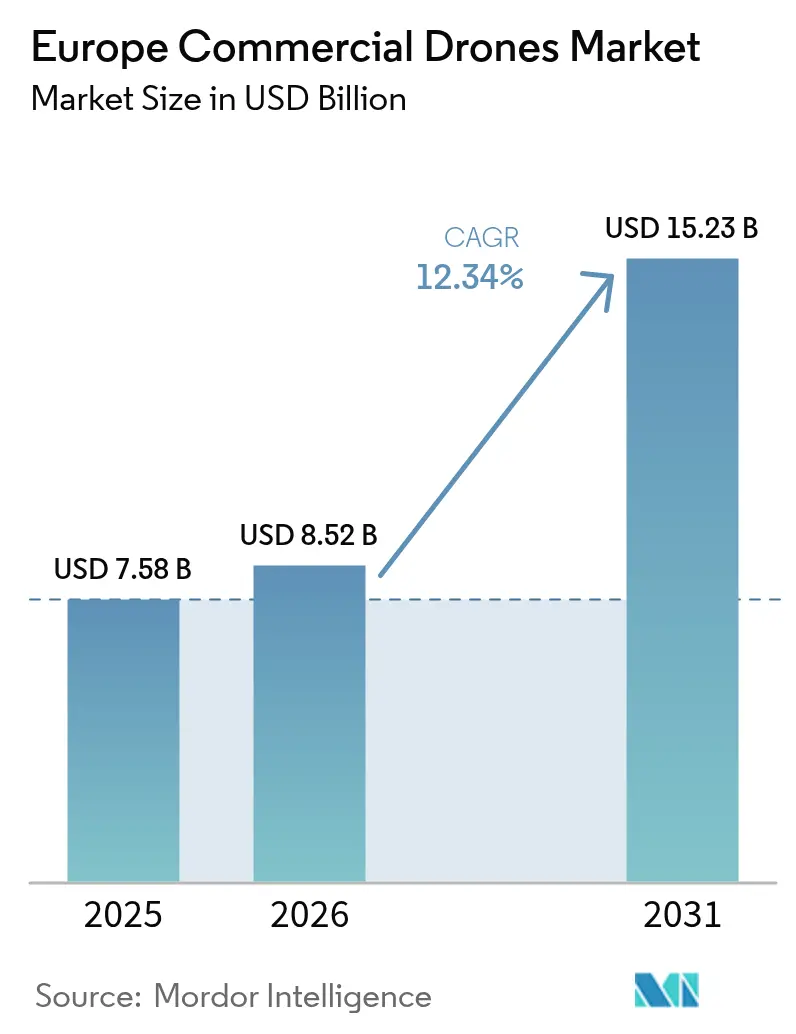
| Base Year Market Size (2025) | USD 7.58 Billion |
| Market Size (2026) | USD 8.52 Billion |
| Market Size (2031) | USD 15.23 Billion |
| Growth Rate (2026 - 2031) | 12.34% CAGR |
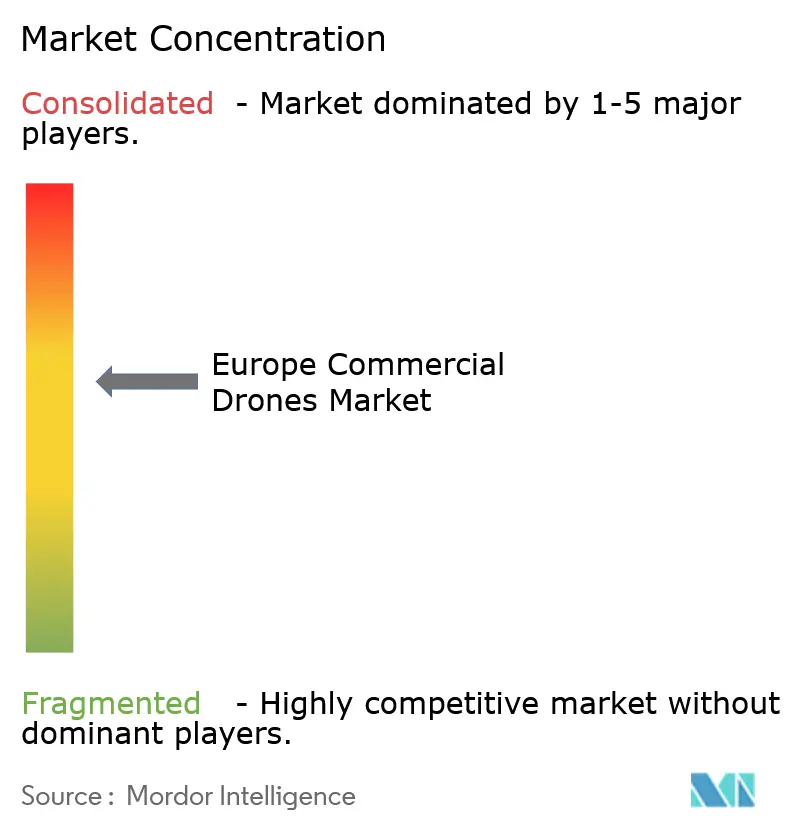
| Market Concentration | Medium |
Major Players *Disclaimer: Major Players sorted in no particular order Image © Mordor Intelligence. Reuse requires attribution under CC BY 4.0. | |
Europe Commercial Drones Market Analysis by Mordor Intelligence
The Europe commercial drones market size is worth USD 7.58 billion in 2025. The Europe commercial drones market is expected to grow from USD 7.58 billion in 2025 to USD 8.52 billion in 2026 and is forecast to reach USD 15.23 billion by 2031 at 12.34% CAGR over 2026-2031. Regulatory clarity, expanding industrial use cases, and steady capital investment underpin this momentum. Construction, agriculture, and energy companies continue to replace manual inspection with airborne data capture at scale, while government agencies adopt drones for public-safety and border-control missions. Demand is also shifting toward larger payload classes and hybrid/VTOL airframes that combine long-range efficiency with vertical take-off flexibility. Competitive pressure remains moderate, allowing niche firms that solve specialized tasks—such as indoor swarm inspections or offshore wind-turbine blade surveys—to carve out defensible positions.
Key Report Takeaways
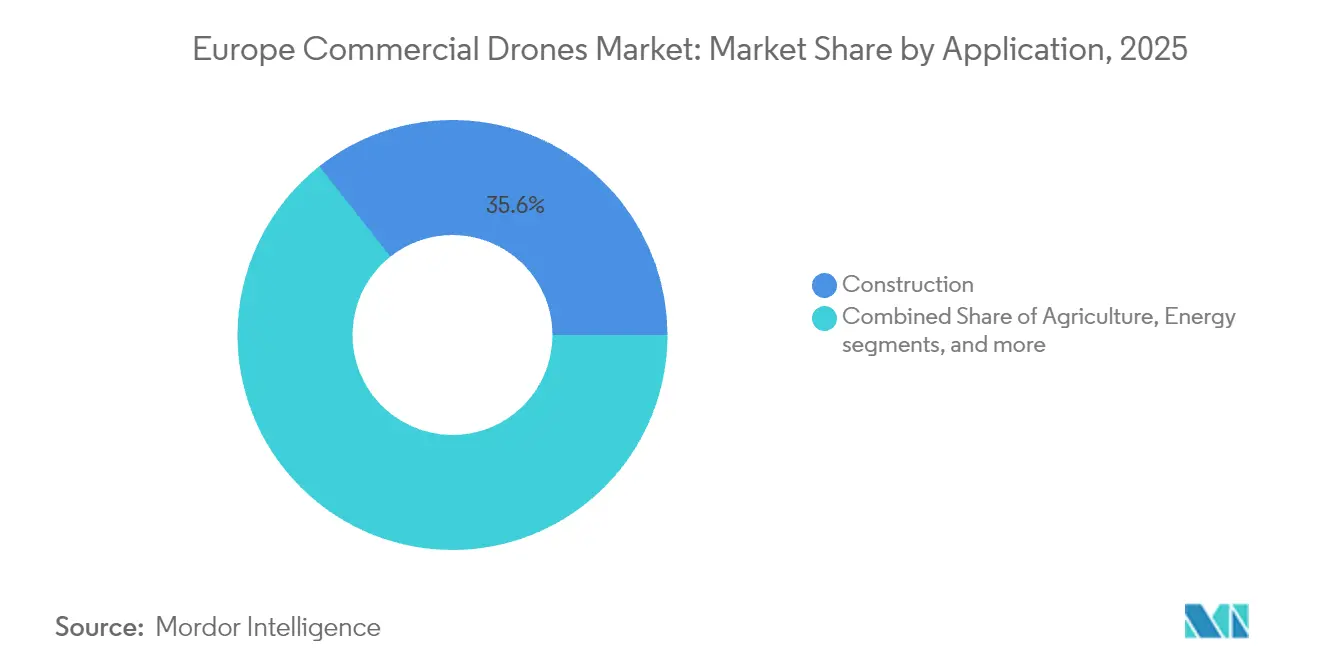
- By application, construction led with 35.64% revenue share in 2025; the energy segment is projected to advance at 14.07% CAGR through 2031.
- By drone type, fixed-wing systems held 45.62% of the Europe commercial drones market share in 2025, while hybrid/VTOL platforms are set to grow 13.82% every year to 2031.
- By weight class, small drones (2 to 25 kg) accounted for 37.11% of the European commercial drone market in 2025; large drones (greater than 150 kg) are expanding at a 12.46% CAGR.
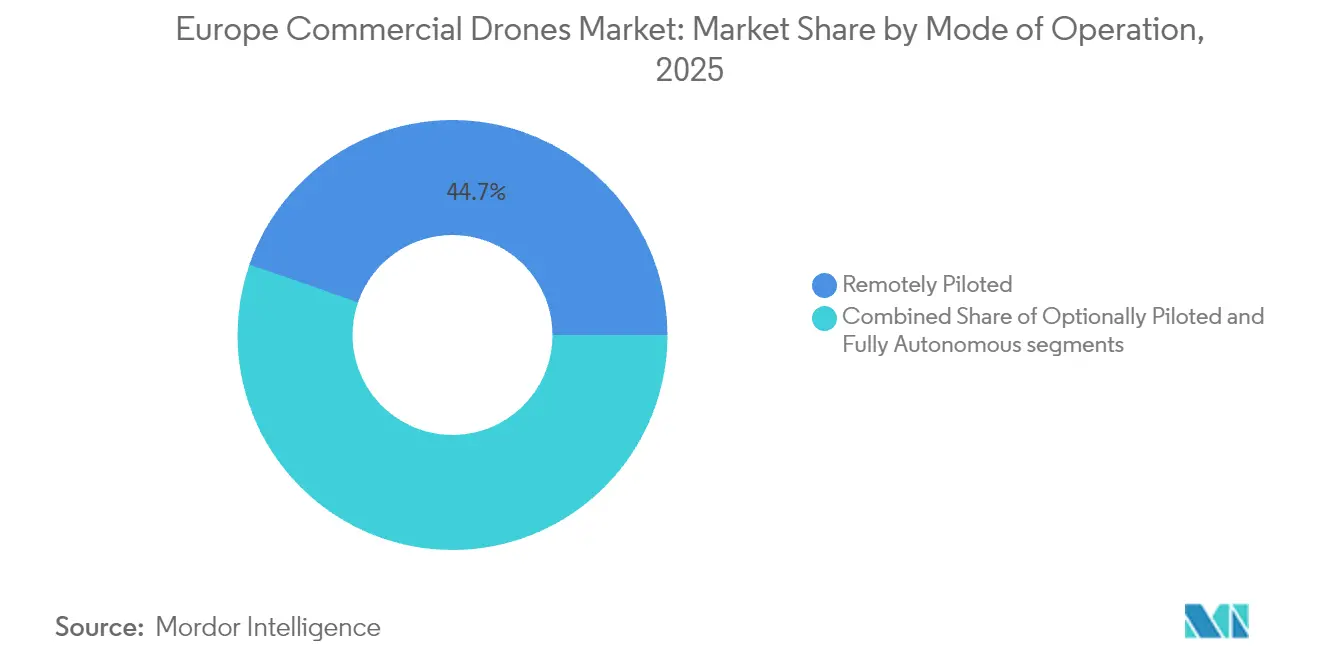
- By operational mode, remotely piloted aircraft represented 44.68% of sales in 2025; fully autonomous platforms are scaling fastest at 14.45% CAGR.
- By end user, commercial and consumer/hobbyist held 56.05% of the market in 2025, while government and civil agencies segment is forecasted to grow at 12.18% CAGR through 2031.
- By geography, the United Kingdom commanded a 26.58% share in 2025, while Italy is on track for a 12.11% CAGR as the fastest-growing national market.
Note: Market size and forecast figures in this report are generated using Mordor Intelligence’s proprietary estimation framework, updated with the latest available data and insights as of 2026.
Europe Commercial Drones Market Trends and Insights
Drivers Impact Analysis*
| Driver | (~) % Impact on CAGR Forecast | Geographic Relevance | Impact Timeline |
|---|---|---|---|
| EU-wide U-space regulatory rollout (2025-27) | +2.8% | All member states; early moves in Germany, Netherlands, France | Medium term (2-4 years) |
| Surge in drone-enabled BIM and digital-twin workflows | +2.1% | UK, Germany, Scandinavia | Short term (≤2 years) |
| Precision agriculture subsidies accelerating drone adoption | +1.7% | France, Spain, Poland | Medium term (2-4 years) |
| Renewable energy asset inspection demand | +1.9% | Offshore wind North Sea; solar Iberia | Long term (≥4 years) |
| Growth of indoor swarm-inspection service contracts | +1.2% | Industrial zones in Germany, Netherlands, UK | Short term (≤2 years) |
| EDF-backed dual-use tech spin-offs | +0.8% | France and adjacent markets | Medium term (2-4 years) |
| Source: Mordor Intelligence | |||
EU-wide U-space Regulatory Rollout Accelerates Market Integration
Europe’s unified U-space rules create a single traffic-management layer for drones below 120 m and remove legacy fragmentation that previously forced operators to meet different national rules for every cross-border mission.[1]European Union Aviation Safety Agency, “U-space regulatory package,” easa.europa.eu Automated flight authorizations, remote-ID, and common risk assessments reduce overhead for scale operators and let service providers confidently plan long-range routes. National civil aviation agencies in Germany, the Netherlands, and France already run pilot corridors, demonstrating that fully automated airspace coordination can support hundreds of daily flights without incident. As implementation phases conclude in 2027, international fleet operators will treat the continent as a contiguous addressable market, boosting demand for hardware and software designed around the U-space interface.
BIM and Digital-Twin Workflows Transform Construction Applications
Drone photogrammetry paired with Building Information Modeling helps contractors detect site clashes at centimeter-level accuracy, cutting rework and improving worker safety. Kier Group documented USD 2 million cost avoidance on motorway upgrades by feeding high-resolution orthomosaics into its digital-twin engine.[2] DroneDeploy, “Kier Group lowers rework cost with drones,” dronedeploy.com Scandinavia’s strict worker-safety laws and high labor costs accelerate adoption, while German general contractors increasingly specify drone mapping in tender documents. As 5G connectivity becomes pervasive, real-time site streaming will allow off-site engineers to validate progress daily, further embedding drones into core project workflows.
Precision Agriculture Subsidies Catalyze Rural Technology Adoption
The Common Agricultural Policy funds remote-sensing and variable-rate spraying equipment for more than 274,000 farms, offering direct reimbursements on drone purchases and data-platform subscriptions.[3]European Commission, “Common Agricultural Policy—Digital Farming Support,” ec.europa.eu Germany’s Ministry of Food and Agriculture estimates that drone-based spraying lowers herbicide use 20% on cereal fields, translating into measurable operating-expense savings. Poland and Spain run regional data-co-missioning pilots where growers upload multispectral imagery to national crop-health portals for subsidy verification, creating a positive feedback loop for drone service providers.
Renewable Energy Infrastructure Drives Inspection Demand
European utilities are deploying long-range, BVLOS drones that finish offshore wind-turbine blade inspections in 45 minutes compared with multi-day rope-access routines, reducing downtime and cutting inspection budgets by half.[4]Energy Global, “Offshore wind turbine inspections via drones,” energyglobal.com Germany’s transmission-grid operators use fixed-wing drones fitted with thermal sensors to map power-line hotspots miles offshore. At the same time, Iberian solar-farm owners rely on VTOL craft to scan thousands of panels daily for micro-cracks. The urgency to maximize renewable uptime, mandated by climate goals, keeps inspection slots full year-round.
Restraints Impact Analysis*
| Restraint | (~) % Impact on CAGR Forecast | Geographic Relevance | Impact Timeline |
|---|---|---|---|
| GDPR-driven data-privacy compliance cost | −1.4% | EU-wide; stricter enforcement in Germany, France | Short term (≤ 2 years) |
| Pilot-training and licensing bottlenecks | −1.8% | Across Europe; especially acute in Eastern Europe | Medium term (2-4 years) |
| Lithium-battery transport restrictions | −1.2% | EU-wide | Medium term (2-4 years) |
| Urban anti-drone counter-measure rollout | −1.0% | Eastern European member states | Medium term (2-4 years) |
| Source: Mordor Intelligence | |||
GDPR Compliance Creates Operational Cost Pressures
Every drone flight over populated areas triggers personal-data safeguards. Operators must run Data Protection Impact Assessments, encrypt onboard storage, and publish public-access notice sites. Embedding privacy-by-design features adds non-recurring engineering costs at the manufacturing stage. Small service providers—especially start-ups in France and Belgium—struggle with the legal fees for ongoing compliance audits, forcing some to restrict operations to unpopulated zones or subcontract data handling to certified processors.
Pilot Training Infrastructure Constrains Market Expansion
Europe graduates only one-quarter of the drone pilots it needs annually. Commercial certificates cost upward of EUR 10,000 (USD 11,760.15) and require simulator hours that many academies cannot supply quickly. Eastern European states like Romania and Bulgaria face course backlogs of six months, restricting service availability during peak farming and construction seasons. National authorities are experimenting with remote-proctored exams and modular syllabi, but widespread relief is unlikely before 2028.
*Our forecasts treat driver/restraint impacts as directional, not additive. The impact forecasts reflect baseline growth, mix effects, and variable interactions.
Segment Analysis
By Application: Construction Dominance Meets Energy Innovation
Construction generated 35.64% of revenue in 2025, anchoring the Europe commercial drones market through routine site mapping and structure inspection. The sector is expected to keep its lead as national infrastructure programs specify drone-verified progress reports. While smaller today, energy is on course for a 14.07% CAGR thanks to mandatory visual checks on new offshore wind arrays. Agriculture remains an early adopter, aided by subsidy incentives, and public-safety agencies now incorporate drones into crowd-management standard operating procedures.
Europe's commercial drone market operators serving construction often bundle data analytics, letting site managers track cubic-yard earthworks or concrete pour volumes in real time. Energy-focused vendors increasingly equip VTOL airframes with AI crack-detection algorithms, moving the task from manual review to automatic defect tagging. This shift supports higher sortie rates without proportional head-count growth.



By Type: Fixed-Wing Leadership Challenged by VTOL Innovation
Fixed-wing platforms held a 45.62% share in 2025 because long-range mapping remains essential in agriculture and border patrol. Hybrid/VTOL designs, however, are growing 13.82% annually as buyers seek runway-free operations. Rotary-wing craft keep their foothold in confined-space tasks such as bridge-cavity inspection, yet payload limits cap their reach.
TEKEVER’s ARX system illustrates the transition: the 600 kg take-off-weight craft combines 12-hour endurance with vertical launch and can ferry modular sensor pods. Operators who formerly ran mixed fleets now prefer a single VTOL that lands in a 25 m clearing yet still covers 200 km of pipelines. Software autonomy reduces pilot workloads, easing compliance with tight duty-time rules.
By Weight Class: Small Drones Dominate While Large Systems Gain Traction
Small craft (2 to 25 kg) accounts for 37.11% of sales because they satisfy most survey and media needs without complex certification. Larger drones above 150 kg post the fastest 12.46% CAGR, led by heavy-lift logistics and long-range inspection flights, where battery-only micro-craft fall short. Nano airframes tackle tank-interior checks, whereas medium 25 to 150 kg units balance endurance and payload in agriculture.
DJI’s C-class launch tailored to the Europe commercial drones market aligns props, prop-guards, and firmware with EASA’s new product-label rules, smoothing cross-border operations. By contrast, cargo air carriers like Dronamics push beyond the small category to meet the same-day delivery of 350 kg goods across Mediterranean islands. Platform choice increasingly follows regulatory and insurance thresholds rather than technical merit alone.
By Mode of Operation: Autonomous Systems Challenge Remote Piloting
Remote piloting still controls 44.68% of 2025 shipments, but autonomy adds 14.45% CAGR as AI advances. Drone-in-a-box stations now reload batteries, run self-checks, and file flight plans with zero human touch. Optionally piloted modes appeal to operators who require manual override in proximity to populated zones.
Autonomous growth rests on risk assessment frameworks under EASA’s Specific category. Once an operator validates a risk class, identical missions run on a standing approval, unlocking daily inspection corridors around solar farms or rail tracks. Insurance carriers have begun discounting premiums for approved automated operations, accelerating uptake.
By End-User: Commercial Dominance with Government Acceleration
Private companies and consumers comprise 56.05% of 2025 spending, reflecting mature use cases in construction, real estate, and event cinematography. Government and civil agencies contribute the fastest expansion at 12.18% CAGR as budgets shift toward persistent aerial situational awareness.
Border-security consortia under NATO’s “Drone Wall” plan procure fixed-wing surveillance fleets, while fire brigades in Spain buy thermal-camera quadcopters to detect hot spots in forest canopies. Convergence between commercial and public requirements spurs platform standardization: a model proven for utility inspection often meets tender specs for highway patrol with minor sensor swaps.
Geography Analysis
The United Kingdom leads the Europe commercial drones market with a 26.58% share in 2025. Civil Aviation Authority policies that permit beyond-visual-line-of-sight trials over the North Sea give British firms a regulatory edge, and government innovation grants lower prototype risk for domestic suppliers.
Germany ranks second, buoyed by EUR 86 million (USD 101.11 million) in venture funding for drone start-ups during 2024 and a diversified industrial customer base. Stringent safety rules demand redundant navigation and emergency-parachute systems, steering buyers toward certified European vendors.
Italy posts the highest 12.11% CAGR as subsidy-backed vineyard mapping, motorway viaduct surveys, and farm-spraying missions proliferate. Leonardo’s joint venture with Baykar further localizes value capture. France, Spain, Netherlands, Switzerland, and Poland add distinct growth pockets: EDF dual-use programs in France, solar-farm scanning in Spain, logistics corridor tests in the Netherlands, alpine-pass inspections in Switzerland, and crop-health imaging campaigns across Poland’s grain belt.
Regulatory Landscape
Europe commercial drone operations sit under the EASA framework established by Regulation (EU) 2018/1139, implemented through the open, specific, and certified categories, with requirements codified in (EU) 2019/947 (operations) and (EU) 2019/945 (product requirements). Cross-border scalability is increasingly tied to U-space, governed by Commission Implementing Regulation (EU) 2021/664, which standardizes airspace services and interfaces for drone traffic management across EU member states.
In 2026, the regulatory agenda broadened from flight safety into resilience and security. The European Commission published its Action Plan on Drone and Counter-Drone Security (February 2026), and EASA issued a revised Easy Access Rules package for Unmanned Aircraft Systems (June 2026) incorporating JARUS SORA 2.5, tightening and clarifying risk-assessment expectations for Specific-category missions such as BVLOS and higher-density operations. Regulation (EU) 2021/664 also introduced information-security risk requirements applicable from 22 February 2026, adding new compliance steps for operators and U-space service ecosystems handling operational data.
Value Chain Analysis
The Europe commercial drone value chain spans upstream components (airframes, propulsion, batteries, cameras and payload sensors, GNSS and communications modules), midstream manufacturing and integration (platform assembly, payload integration, software autonomy stacks, and compliance labeling), and downstream channels (direct OEM sales, distributor networks, and drone-as-a-service providers that bundle flight operations with analytics). The enabling layer increasingly includes UTM/U-space service providers and compliance partners that help operators navigate EASA open/specific/certified categories, including SORA-based approvals for scalable inspection and monitoring missions.
Two linkages are reshaping how value is captured: regulatory integration and supply chain auditability. The June 2026 EASA update to the Easy Access Rules for UAS (with SORA 2.5) increases the value of standardized documentation, safety cases, and recurring mission templates, lifting demand for consultative services and software platforms alongside hardware. At the same time, procurement pressure for transparent and sovereign supply chains is rising for defense-adjacent and critical infrastructure use cases, pushing OEMs and integrators to qualify components, localize assembly where feasible, and align product roadmaps with EU U-space and member-state implementation pathways.
Competitive Landscape
Market concentration remains moderate: the top five suppliers hold a major percentage combined share, leaving room for focused entrants. DJI maintains volume leadership through broad SKU availability and aggressive pricing. European firms—Parrot, Delair, Flyability, Quantum-Systems—win niche bids by aligning early with EASA compliance labels and offering data-sovereign cloud hosting.
Strategic moves highlight consolidation. Unifly bought EuroUSC Italia in May 2025 to integrate regulatory consulting with its traffic-management stack, while Patria’s 2024 purchase of Nordic Drones expanded its Nordic market access. Counter-UAS specialists such as Alpine Eagle raised EUR 10.25 million (USD 12.05 million) to tackle airspace-security tenders. Feature differentiation now favors AI perception, onboard edge compute, and seamless U-space integration rather than pure airframe endurance.
White-space opportunities span indoor swarm robots for refinery assets, drone-delivered cell-tower inspections, and modular cargo pods for island logistics. Certification hurdles keep copycat entrants at bay, letting early movers capture durable gross margins.
Europe Commercial Drones Industry Leaders
SZ DJI Technology Co., Ltd.
Parrot Drones SAS
Delair SAS
Flyability SA
Skydio, Inc.
- *Disclaimer: Major Players sorted in no particular order

Market Opportunities and Future Outlook
Near-term whitespace concentrates where regulatory harmonization and security priorities translate into funded programs and repeatable deployments. The European Commission Action Plan on Drone and Counter-Drone Security (February 2026) elevates demand for detection, identification, and response capabilities that sit adjacent to commercial operations. That dynamic creates opportunities for dual-use platform builders and sensor and software suppliers that can support civil protection, airports, and critical infrastructure operators. On the civil side, the June 2026 EASA update that incorporates SORA 2.5 strengthens the case for productized compliance, including standard scenarios, reusable safety cases, and pre-packaged operational risk evidence. It also favors OEMs and UTM/U-space platforms that reduce the administrative burden of scaling BVLOS inspection and monitoring.
Industrial scaling is being reinforced by capital formation and consolidation that improve production capacity and go-to-market reach. Quantum-Systems announced a EUR 1 billion Series D round in July 2026, supporting scale-up for autonomous systems and supply chain depth. Unifly announced the acquisition of EuroUSC-Benelux in March 2026, tightening the linkage between regulatory and safety consultancy and UTM platform delivery for enterprise customers. End-market pull-through is also showing up in professional segment performance, with Parrot reporting EUR 21.3 million in Q1 2026 professional micro-UAV revenue, reflecting continuing procurement appetite for mission-focused platforms in Europe.
Recent Industry Developments
- July 2026: DJI released a SAIL III declaration of compliance package for DJI Dock 3 and the Matrice 4D series, aimed at simplifying SORA-based applications across EASA member states. By productizing risk evidence and documentation, the move reduces friction for operators scaling BVLOS and higher-risk inspection missions and strengthens DJI’s positioning in regulated enterprise deployments.
- May 2026: Parrot reported a sharp increase in professional micro-UAV revenues in Q1 2026, reaching EUR 21.3 million and citing demand for its ANAFI UKR line. The update pointed to active procurement momentum in mission-oriented segments and reinforced the commercial importance of security-aligned, professional-grade small drones in Europe.
- June 2024: Patria completed its acquisition of Nordic Drones, expanding its unmanned portfolio and access to Nordic operational footprints. The transaction tightened regional integration between platforms, services, and public-sector customer pathways, supporting broader deployment of unmanned capabilities across civil and government users.


Research Methodology Framework and Report Scope
Market Definition and Coverage
For this study, the Europe drones market covers the value generated from commercially used unmanned aerial vehicles and related onboard payloads sold and operated across Europe, where spending is driven by civil and business use cases.
Scope exclusions: This sizing excludes purely recreational toy drones and any defense-only UAV procurement that is budgeted and managed as a military program.
Segmentation Overview
- By Application
- Construction
- Agriculture
- Energy
- Entertainment
- Law Enforcement
- Other Applications
- By Type
- Fixed-Wing Drones
- Rotary-Wing Drones
- Hybrid/VTOL Drones
- By Weight Class
- Nano/Micro (Less than 2 kg)
- Small (2 to 25 kg)
- Medium (25 to 150 kg)
- Large (Greater than 150 kg)
- By Mode of Operation
- Remotely Piloted
- Optionally Piloted
- Fully Autonomous
- By End-User
- Commercial and Consumer/Hobbyist
- Government and Civil
- By Country
- United Kingdom
- Germany
- France
- Spain
- Italy
- Netherlands
- Switzerland
- Poland
- Rest of Europe
Data Sources, Market Sizing, and Validation
Desk Research
Desk work was used first to set the market boundary and to build a fact base using demand signals and regulatory readiness in Europe. We relied on public source types such as EASA publications on UAS rules, Eurostat trade and industry statistics, national civil aviation authority updates, and procurement portals that publish tenders and awards in Europe. In addition, research papers and standards documents (for example, journals covering remote sensing and photogrammetry, and ISO-related guidance where relevant) were reviewed to understand typical payload types and operating constraints.
Next, company filings, investor presentations, press releases, and reputable news coverage were used to map the supplier landscape and to sanity-check pricing direction for common commercial drone configurations. Where needed, paid subscriptions for company financials and intelligence, a patent database, and a contracts and tenders database helped confirm ownership links, product launches, and contract values without depending on any single source. The desk sources listed here are illustrative, and many other public documents and datasets were also used for data collection, validation, and clarification.
Primary Interviews and Surveys
Primary work was done to test the model inputs that are hard to verify from public data, especially average selling prices by payload class, typical replacement cycles, and the share of spending that sits with service providers versus direct drone ownership. We spoke with manufacturers, distributors, service operators, and large commercial users across major European markets, so the final numbers reflect how demand and pricing behave in practice across the region.
Distribution of primary research fieldwork respondents
| Company type | Respondent position | Region |
|---|---|---|
| Top tier: 28% | CXOs: 18% | |
| Mid tier: 53% | Functional/Unit leaders: 38% | |
| Smaller Players: 19% | Managers: 44% |
Market-Sizing & Forecasting
Sizing starts with a top-down build where aviation activity signals, commercial adoption readiness, and reported enterprise drone spend patterns are converted into a Europe demand pool, and then translated into value using price bands seen in the market. To keep the result realistic, we also run selective bottom-up checks using sampled ASP times unit volumes by drone class, plus distributor and integrator channel checks, which are then used to adjust totals when gaps appear.
A few market fingerprints were treated as key inputs, including EASA-aligned operating permissions and category rules, the mix of drone types used in Europe (for example, multirotor versus fixed wing), payload mix (RGB, thermal, and LiDAR), typical replacement cycles tied to flight hours, and the project cadence in inspection and mapping work that drives utilization. For forecasting, scenario analysis is used to reflect different adoption speeds tied to regulation execution, funding cycles in infrastructure and energy, and the pace of automation in survey workflows, and then the path is smoothed with simple time-series logic so year-to-year movement stays explainable. When bottom-up signals are incomplete for smaller countries, gaps are handled using comparable-country adoption ratios and confirmed through expert feedback before totals are finalized.
Data Validation & Update Cycle
After the first model run, outputs are cross-checked against independent signals such as tender activity, reported project backlogs, and shipment and pricing direction discussed by industry participants. Any sharp jumps are reviewed, assumptions are re-opened, and follow-up calls are triggered when a variance cannot be explained by a clear market event.
Before sign-off, the work goes through a multi-step internal review where inputs, math, and year labeling are checked, followed by a final pass to confirm the scope has been applied consistently across countries. The report is refreshed annually, and interim updates are made when material regulation changes, large contract wins, or macro shocks meaningfully shift demand.
Mordor Intelligence's Europe Drones Market Sizing Compared With Other Published Estimates
Different published market sizes for Europe drones can look far apart because the scope line is drawn differently, and because not every estimate uses the same real-world checks for volumes and prices. We kept the approach traceable to observable demand signals, and then used interviews to confirm how those signals translate into spending.
Tender awards, EASA rule rollouts, and ASP direction discussed by integrators are the evidence points that keep Mordor Intelligence's estimate tied to commercial drone hardware and payload spending in Europe rather than broader service revenue or defense budgets.
Benchmark comparison
| Source | Market Size | Gaps in Research Methodology |
|---|---|---|
| Mordor Intelligence | USD 8.52 B (2026) | |
| Regional Consultancy A | USD 12.06 B (2024) | This figure appears to use a wider definition of the drone market, which can blend hardware with services and wider use cases, and it is also anchored to an earlier year that may not be normalized for current pricing and regulation timing. |
| Trade Journal B | USD 4.56 B (2024) | This estimate looks more conservative on adoption and may be closer to a narrower subset of commercial applications, with less explicit validation against procurement signals and country-level readiness differences that impact conversion from activity to revenue. |
The spread in the table is mainly explained by scope boundaries and the year each publisher anchors to, which affects how pricing and adoption are carried forward. By keeping assumptions linked to visible demand indicators and then confirming key ratios through interviews, we end up with a balanced number that a reader can reproduce and update with the same inputs.


Key Questions Answered in the Report
What is the current value of the Europe commercial drones market?
The market stands at USD 8.52 billion in 2026.
How fast is the Europe commercial drones market expected to grow?
Revenue is projected to rise at a 12.34% CAGR, reaching USD 15.23 billion by 2031.
Which application segment leads spending today?
Construction applications hold 35.64% of 2025 revenue due to widespread use in site mapping and progress tracking.
Which European country is the largest market for commercial drones?
The United Kingdom accounts for 26.58% of the region’s 2025 sales.
What regulatory change most benefits operators?
The EASA-led U-space framework standardizes low-altitude air-traffic management across the EU, simplifying cross-border missions.
Are fully autonomous drones commercially viable now?
Yes; autonomy shows the fastest growth at 14.45% CAGR as EASA’s Specific category approvals expand.
Page last updated on:




