
Elevator Control Market Size and Share
Market Overview
| Study Period | 2020 - 2031 |
|---|---|
| Market Size (2026) | USD 9.59 Billion |
| Market Size (2031) | USD 12.19 Billion |
| Growth Rate (2026 - 2031) | 4.93 % |
| Fastest Growing Market | Asia Pacific |
| Largest Market | Asia Pacific |
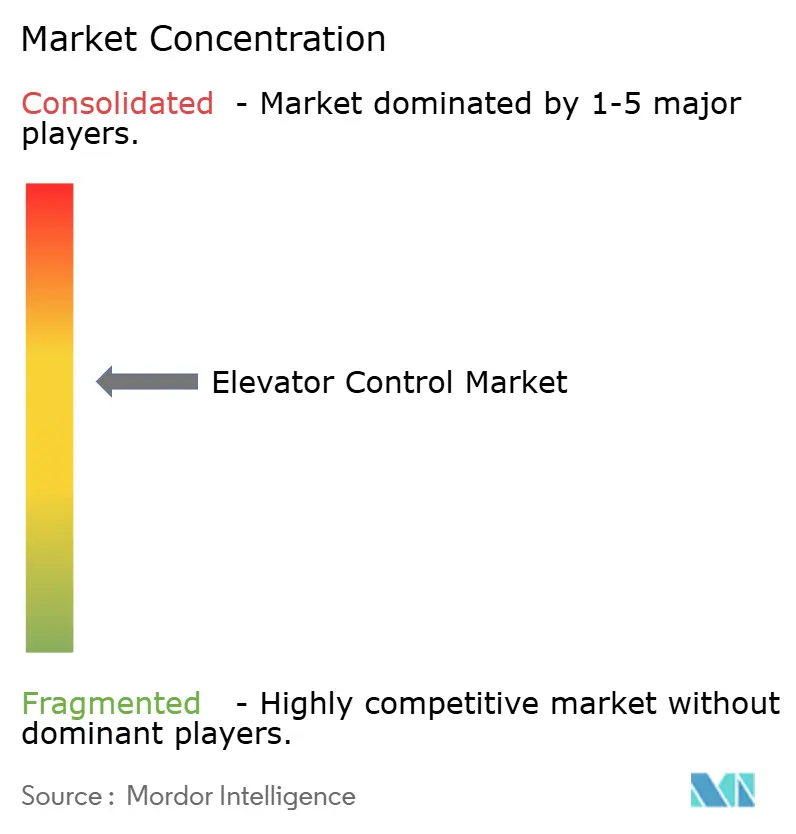
| Market Concentration | Medium |
Major Players *Disclaimer: Major Players sorted in no particular order Image © Mordor Intelligence. Reuse requires attribution under CC BY 4.0. | |
Elevator Control Market Analysis by Mordor Intelligence
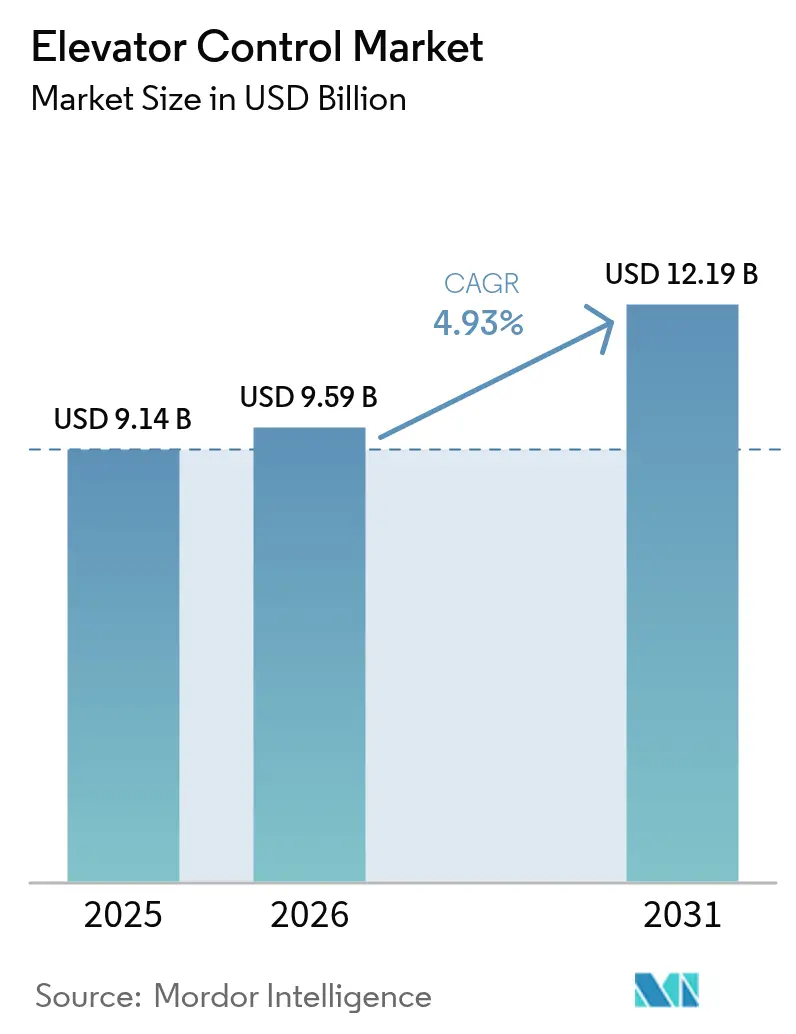
The elevator control market size is expected to grow from USD 9.14 billion in 2025 to USD 9.59 billion in 2026 and is forecast to reach USD 12.19 billion by 2031 at 4.93% CAGR over 2026-2031. The elevator control market is benefiting from the rapid migration away from relay-based logic toward IoT-enabled controllers that embed predictive maintenance, destination dispatch, and energy-optimization algorithms. Accelerating high-rise construction, especially in Asia–Pacific megacities, is spurring fresh installations, while tightening safety and accessibility codes are pushing building owners in North America and Europe to modernize aging units. Semiconductor shortages that plagued 2024 have eased, allowing manufacturers to clear backlogs and replenish inventories, yet lingering supply-chain risk keeps lead times above pre-pandemic levels. Rising cybersecurity scrutiny is nudging operators to invest in encrypted communication protocols and secure firmware updates, a trend that turns software maintenance into a recurring revenue stream for leading OEMs. Competitive differentiation is therefore moving beyond hardware toward data analytics, remote diagnostics, and service bundling, reshaping the elevator control market’s growth trajectory.
Key Report Takeaways
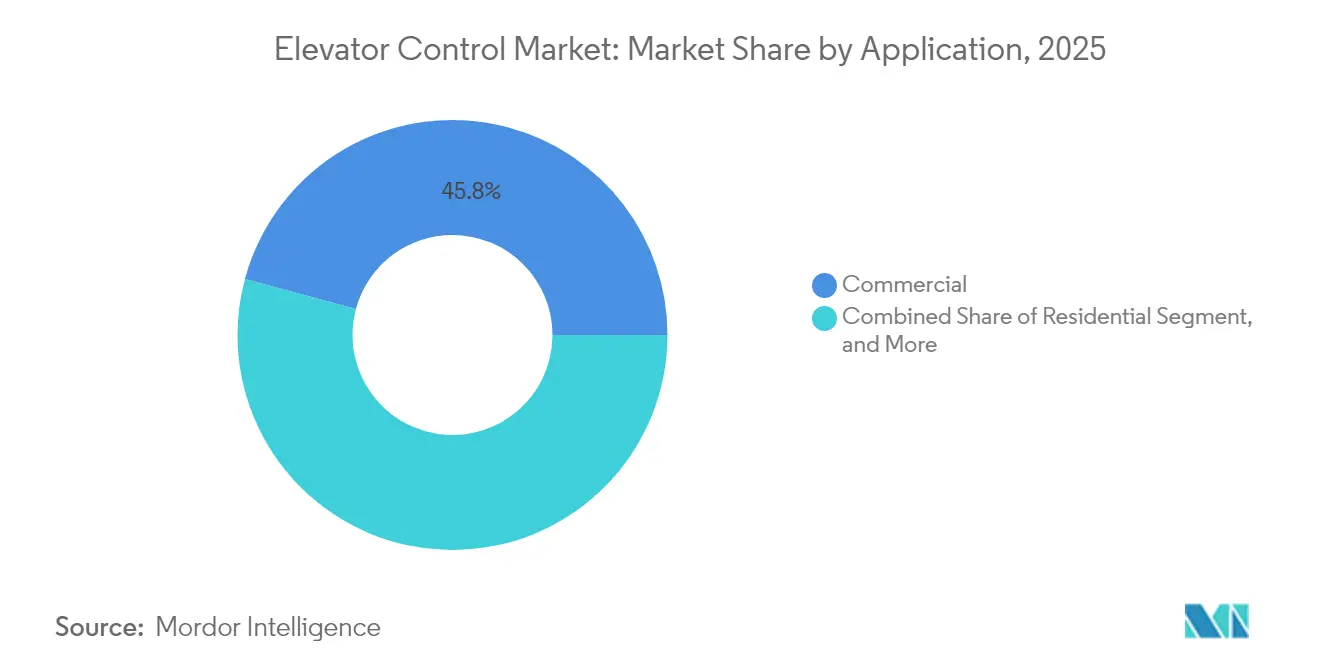
- By application, commercial buildings led with 45.80% of the elevator control market share in 2025, while industrial and logistics applications are forecast to expand at a 6.05% CAGR through 2031.
- By component, controllers accounted for 38.20% of the elevator control market size in 2025, whereas software and connectivity platforms are projected to post the fastest growth at a 6.25% CAGR.
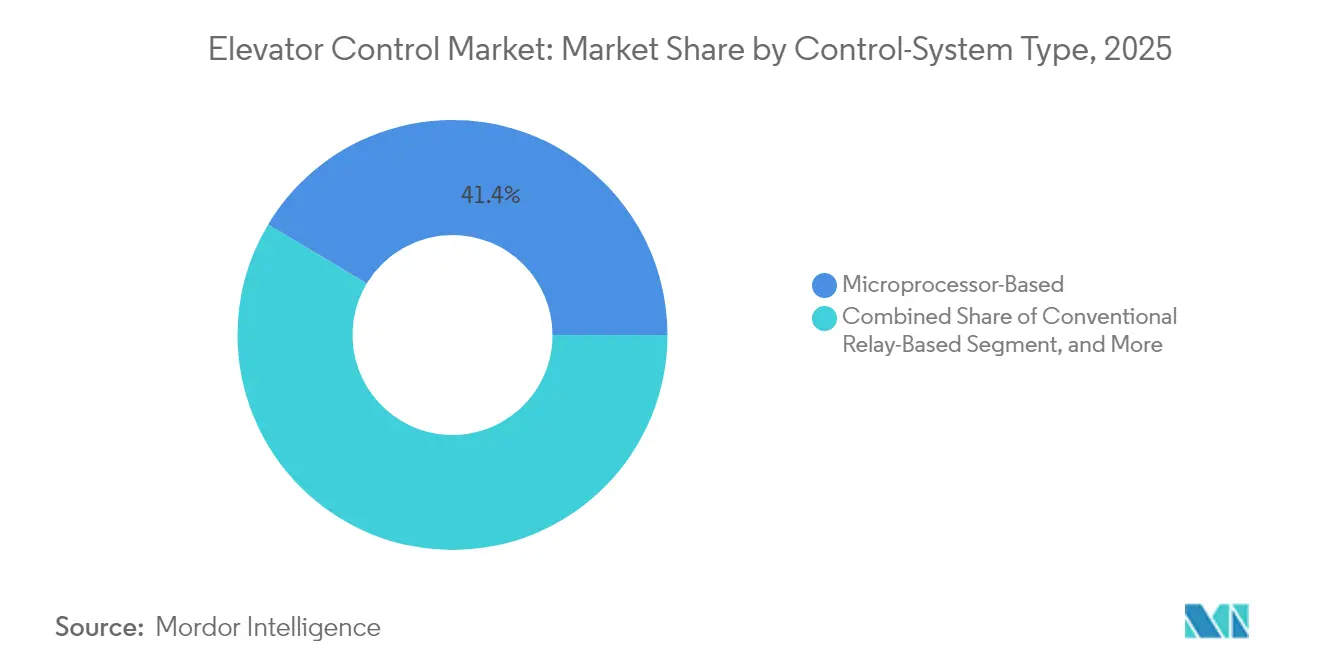
- By control-system type, microprocessor-based solutions held 41.40% share of the elevator control market in 2025, but IoT-enabled smart controls are on track for a 7.55% CAGR.
- By elevator technology, traction systems secured a 54.70% share in 2025, with machine-room-less traction forecast to register a 7.25% CAGR up to 2031.
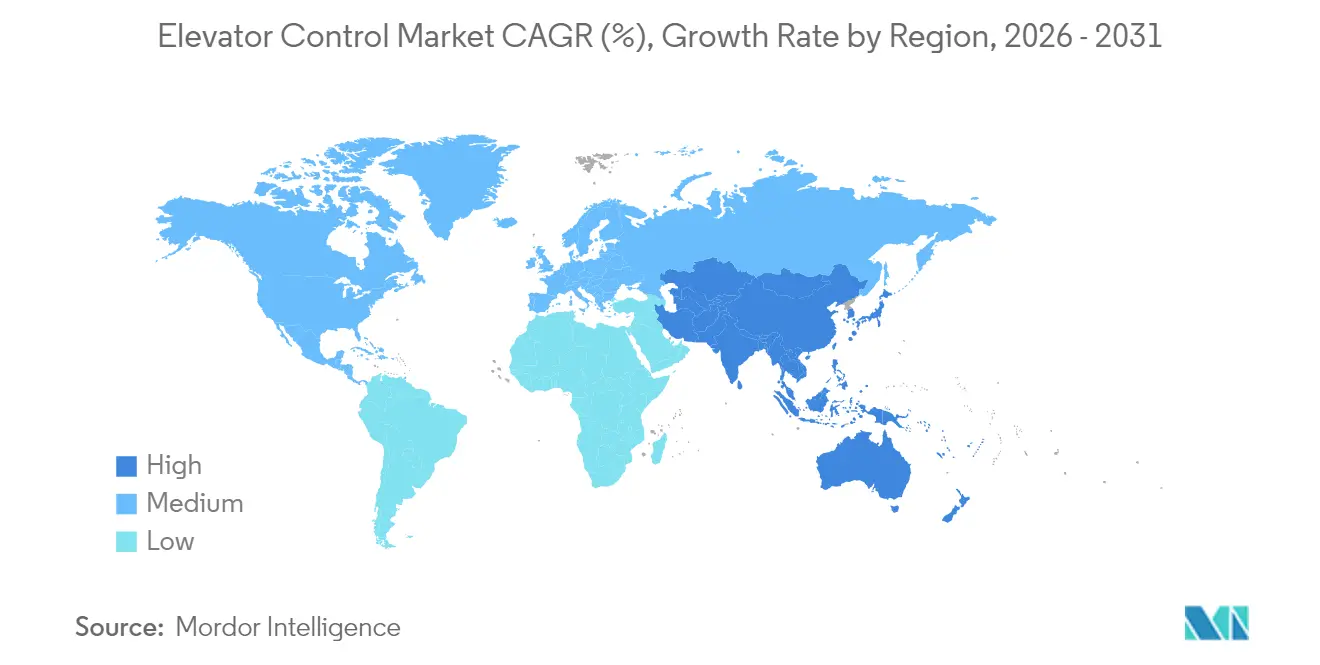
- By geography, Asia-Pacific commanded 43.30% of 2025 revenue and is positioned for the quickest regional advance at an 7.95% CAGR.
Note: Market size and forecast figures in this report are generated using Mordor Intelligence’s proprietary estimation framework, updated with the latest available data and insights as of 2026.
Market Trends and Insights
Drivers Impact Analysis of Elevator Control Market*
| Driver | (~) % Impact on CAGR Forecast | Geographic Relevance | Impact Timeline |
|---|---|---|---|
| Rapid implementation of advanced technologies in elevator controls | +1.20% | Global, with concentration in North America and Europe | Medium term (2-4 years) |
| Infrastructure spending on high-rise buildings and metros | +0.90% | Asia-Pacific core, spill-over to Middle East and Latin America | Long term (≥ 4 years) |
| Accelerated modernization of aging elevator stock | +0.80% | North America and Europe, emerging in developed Asia-Pacific | Medium term (2-4 years) |
| Rise of AI-based predictive-maintenance platforms | +0.70% | Global, early adoption in North America and Northern Europe | Medium term (2-4 years) |
| Adoption of touch-free human-machine interfaces | +0.40% | Global, accelerated in high-traffic commercial environments | Short term (≤ 2 years) |
| Mandates for energy-efficient destination-dispatch systems | +0.60% | Europe and North America, expanding to Asia-Pacific | Long term (≥ 4 years) |
| Source: Mordor Intelligence | |||
Rapid Implementation of Advanced Technologies
Elevator groups are embedding artificial intelligence to analyze passenger flow, historical traffic, and real-time occupancy data, trimming wait times and cutting energy use by as much as 30% compared with conventional controls.[1] Cloud-connected sensors feed live performance metrics to analytics dashboards, enabling predictive alerts weeks before a failure point. Edge processors resident in the controller cabinet maintain responsiveness even when network connectivity drops, ensuring dispatch quality during service interruptions. The feature set appeals to premium office towers that value tenant experience and energy-benchmark ratings. Simultaneously, retrofit kits are bringing similar capability to mid-tier properties, expanding the elevator control market beyond new build opportunities.
Infrastructure Spending on High-Rise Buildings and Metros
Mega-projects in China, India, Indonesia, and Saudi Arabia are allocating record budgets to vertical-transport infrastructure, including destination-dispatch elevators integrated with metro hubs and mixed-use skyscrapers.[2] Smart-city mandates now place elevator controls within the broader building-management and smart-grid ecosystems, creating pull-through demand for controllers that support open protocols and battery-backed rescue drives. Funding visibility stretching to 2030 gives OEMs confidence to expand local manufacturing footprints and service centers across Asia–Pacific and the Gulf, reinforcing first-mover advantages in high-growth corridors.
Accelerated Modernization of Aging Elevator Stock
In the United States and Europe, more than 4 million elevators exceed 20 years of service and rely on obsolete relay logic that fails to meet current EN 81-20/50 or ASME A17.1 safety clauses.[3] Modernization packages typically replace controllers, drives, and hall fixtures, extending unit life by up to 20 years and lowering energy bills by 40-60%. Insurance carriers increasingly require such upgrades before renewing coverage, shrinking payback periods for owners. Manufacturers offer modular kits with factory-prewired harnesses that reduce on-site labor, accelerating the elevator control market’s retrofit cycle.
Rise of AI-Based Predictive Maintenance Platforms
Sensor arrays mounted on motors, doors, and guide rails capture vibration spectra, torque curves, and door-cycle counts. Machine-learning models trained on millions of run hours predict failure modes with accuracy rates above 85%, reducing unplanned outages by up to 80%.[4] Service firms monetize these insights through uptime-guaranteed contracts, underpinning a shift from reactive repairs to outcome-based maintenance. Integration with augmented-reality headsets lets junior technicians diagnose faults in near real time, partially alleviating labor shortages and improving first-visit fix rates.
Restraints Impact Analysis of Elevator Control Market*
| Restraint | (~) % Impact on CAGR Forecast | Geographic Relevance | Impact Timeline |
|---|---|---|---|
| High upfront capital expenditure | -0.80% | Global, particularly acute in price-sensitive emerging markets | Short term (≤ 2 years) |
| Shortage of certified installation technicians | -0.60% | North America and Europe, emerging in Asia-Pacific | Medium term (2-4 years) |
| Cyber-security and data-privacy concerns in connected controls | -0.40% | Global, heightened in regulated industries and government facilities | Medium term (2-4 years) |
| Volatility in semiconductor and power-electronics supply chains | -0.50% | Global, with regional variations in component availability | Short term (≤ 2 years) |
| Source: Mordor Intelligence | |||
High Upfront Capital Expenditure
Full controller retrofits run between USD 15,000 and USD 50,000 per car, and ancillary electrical and IT work can add another 20-30%. In price-sensitive emerging markets, owners postpone upgrades despite energy savings because financing windows remain short and interest rates high. Temporary service outages also deter tenants, leading landlords to stage work during off-hours at premium labor rates, prolonging return-on-investment periods.
Shortage of Certified Installation Technicians
Vacancy rates exceed 15% for union-licensed elevator mechanics in major U.S. and European metros. The skill mix has shifted from mechanical know-how toward software commissioning and cybersecurity, but training pipelines have not kept pace. Variable certification rules limit cross-border talent mobility, stretching project timelines and inflating labor costs. OEMs now operate proprietary academies and remote-support centers to bridge the gap, but field capacity remains a gating factor for the elevator control market.
*Our forecasts treat driver/restraint impacts as directional, not additive. The impact forecasts reflect baseline growth, mix effects, and variable interactions.
Elevator Control Market Segment Analysis
By Application:
Commercial Leadership and Logistics MomentumCommercial buildings contributed USD 4.19 billion to the elevator control market size in 2025 and retained a 45.80% share as property managers demanded sophisticated destination dispatch and remote-monitoring suites to enhance tenant experience. Energy benchmarking programs such as LEED and BREEAM intensified the adoption of regenerative drives and AI-based traffic-optimization modules. Meanwhile, the 6.05% CAGR forecast for industrial and logistics facilities underlines e-commerce operators’ appetite for vertical lift modules that integrate seamlessly with warehouse-execution software.
The residential segment is adding growth on the back of smart-home ecosystems that link elevator calls to mobile credentials and building security. Infrastructure and public facilities, including airports and metro stations, seek vandal-resistant hall fixtures and redundant safety relays to handle heavy passenger loads. Across applications, retrofit demand is rising as owners chase lower energy bills and seek to comply with disability-access mandates such as EN 81-70. Commercial landlords especially prize controllers that harvest granular ride data, feeding occupancy analytics and informing space-utilization strategies—effects that reinforce the elevator control market’s service-revenue loop.

By Component:
Controllers Rule but Software SurgesControllers delivered 38.20% of 2025 revenue by serving as the command brain that enforces safety logic, group dispatch, and network connectivity. Controller upgrades remain the cornerstone of modernization packages, ensuring the elevator control market share associated with this component stays broad-based across geographies. Yet, software and connectivity platforms are poised for a 6.25% CAGR through 2031 as OEMs push subscription-based dashboards, cybersecurity updates, and predictive-maintenance engines.
Drives and inverters hold stable volume because every modernization swings in a high-efficiency variable-voltage drive to curb electricity draw and enable regenerative braking. Hall fixtures and COP/LOP panels are morphing into touchless and mobile-enabled interfaces, a shift accelerated by post-pandemic hygiene expectations. Sensor and I/O modules proliferate as condition-monitoring becomes the norm. Overall, the value migrates from hardware margins to recurring software fees, a shift reshaping revenue models across the elevator control market.
By Control-System Type:
Smart Controls Gain GroundMicroprocessor-based units represented 41.40% of 2025 shipments, a testament to their balance of cost and capability. However, IoT smart controls are growing 7.55% annually, fueled by building-management integration requirements and tenant demand for real-time elevator status updates. The elevator control market size allocated to smart controls is expected to more than double by 2031, partly at the expense of conventional microprocessor replacements.
Relay logic remains in legacy freight and low-rise stock but commands a limited future share. Destination dispatch systems continue to penetrate premium offices where travel-time savings justify higher capex. Group and AI traffic-optimized controls occupy the top tier, harnessing cloud analytics to adapt sequences during exceptional events. Connectivity and analytics have thus become decisive purchase criteria, tilting competitive advantage toward vendors with robust digital ecosystems.
By Elevator Technology:
Traction Dominates, MRL AcceleratesTraction elevators held 54.70% of revenue in 2025, leveraging high energy efficiency and adaptability to mid- and high-rise buildings. Yet, machine-room-less (MRL) traction designs are rising at 7.25% CAGR as architects aim to reclaim mechanical-room space for leasable area. Controllers for MRL deployments must withstand higher ambient temperatures and tighter footprints, prompting innovation in compact power electronics.
Hydraulic systems remain cost-effective for low-rise installations but confront environmental headwinds tied to fluid leakage and energy intensity. Pneumatic and linear-motor technologies linger in niche segments such as panoramic lifts and high-speed observation decks. Even so, all technologies are migrating toward regenerative drives and power-factor-correction modules, trends that buttress demand across the elevator control market.
Geography Analysis
APAC Elevator Control Market
Asia–Pacific captured 43.30% of 2025 revenue, reflecting dense new-building pipelines and policy support for smart-city rollouts. China’s urban-renewal schemes and India’s 100-smart-cities program ensure sustained controller demand, while Southeast Asian nations embrace machine-room-less designs to fit constrained footprints. Local OEM assembly plants shorten lead times and tailor features to regional codes, insulating the elevator control market from severe currency shocks.
North America Elevator Control Market
North America constitutes a mature installed base ripe for modernization. Legislative updates, including California’s seismic safety amendments and New York City’s door-lock monitoring requirement, incentivize owners to replace mid-1990s controllers. Predictive-maintenance subscriptions resonate with real-estate investment trusts that prioritize uptime metrics, supporting premium pricing. Additionally, Canada’s green-building policies accelerate the adoption of regenerative drives and energy-reporting dashboards.
EMEA and LATAM Elevator Control Market
Europe remains steady as EN 81-20/50 compliance vaults safety and accessibility to the top of procurement criteria. High penetration means growth hinges on retrofits, yet strong sustainability agendas trigger adoption of destination dispatch and energy-recovery hardware. Meanwhile, the Middle East and Africa witness rapid greenfield activity across Gulf megaprojects, demanding climate-resilient controllers with dust-ingress protection. Latin America’s gradual economic rebound lifts new installations, though currency volatility tempers capex, stalling some elevator control market conversions.
Regulatory Landscape
Elevator control suppliers operate under safety and electrical-equipment codes that shape controller hardware, firmware logic, and certification timelines. In North America, ASME A17.1-2025/CSA B44:25 is the binational safety code baseline for design and installation, while ASME A17.5-2025/CSA B44.1:25 updates requirements for control-system electrical components and qualification pathways.
In Europe, the Lifts Directive 2014/33/EU remains the core framework for safety and market access, and Directive (EU) 2024/2749 amends it with national transposition required by May 29, 2026 and application starting May 30, 2026. Accessibility and evacuation requirements also continue to tighten through harmonized EN standards, including Commission Implementing Decision (EU) 2025/2383 (published November 25, 2025), which adopted EN 81-76:2025 on evacuation of persons with disabilities using lifts. That change increases demand for modernization-ready compliant controls, interfaces, and operating modes.
Value Chain Analysis
The elevator control value chain starts with upstream electronics and power components, including microcontrollers/ASICs, IGBTs and silicon carbide (SiC) power modules for drives, sensors, and communications interfaces used in connected controllers. These inputs flow to control-system manufacturers and subsystem specialists that design and assemble controllers, drives/inverters, safety circuits, and human-machine interfaces, before integrating software layers for group dispatch, diagnostics, and remote connectivity. Compliance and testing organizations (for example, CSA-linked pathways aligned to ASME A17.5/CSA B44.1) sit alongside OEM qualification processes, influencing approved vendor lists and extending lead times when electrical designs change.
Downstream, OEMs and independent modernization providers configure and install control packages, then sustain recurring revenue through maintenance, firmware/security updates, and monitoring services. The chain remains sensitive to electronics availability and reliability requirements in safety-critical applications, and industry guidance such as National Elevator Industry, Inc. (NEII) cybersecurity best practices (revised July 2024) adds requirements for secure maintenance tools and network interfaces. Component innovation also feeds into the chain, including supplier work on SiC modules for elevator variable-frequency drives aimed at efficiency and thermal performance improvements in compact machine-room-less deployments.
Competitive Landscape
The elevator control market is moderately consolidated; the top four companies collectively hold major revenue from global service contracts. Their nationwide technician fleets, proprietary spare parts, and bundled service subscriptions create high switching costs for property owners. Product roadmaps emphasize cloud dashboards, encrypted firmware pipelines, and AI-driven traffic optimization, differentiating brands through software rather than motors and relays.
Mid-tier specialists such as Thames Valley Controls and Lester Controls focus on open-protocol retrofits, appealing to independent maintenance firms that wish to avoid OEM lock-in. Suppliers of vertical lift modules, notably SSI SCHAEFER, extend advanced control algorithms to logistics applications, carving out a high-growth adjacency. Component vendors, including Nidec and SICK AG, concentrate on drives and safety sensors, partnering with OEMs to integrate condition-monitoring features at the board level.
M&A has accelerated as majors seek geographic reach and digital capability. KONE’s 2024 buyout of Capitol Elevator widened its U.S. modernization network. Otis continues to acquire regional service companies to shore up aftermarket revenue, while Kings III’s purchase of LiftNet in April 2025 bolstered telemetry and emergency-communication capacity. Patent filings cluster around cybersecurity, AI dispatch, and regenerative power capture, signaling where future elevator control market competition will intensify.
Elevator Control Industry Leaders
-
Mitsubishi Electric Corporation
-
Hyundai Elevator Co., Ltd.
-
Toshiba Elevator and Building Systems Corporation
-
Thames Valley Controls Ltd.
-
Honeywell International Inc.
- *Disclaimer: Major Players sorted in no particular order
Elevator Control Market Companies Covered in this Report
- Otis Worldwide Corporation
- Schindler Holding AG
- KONE Corporation
- TK Elevator GmbH
- Mitsubishi Electric Corporation
- Hitachi Ltd.
- Fujitec Co., Ltd.
- Hyundai Elevator Co., Ltd.
- Toshiba Elevator and Building Systems Corporation
- Nidec Motion Control Engineering Inc.
- Thames Valley Controls Ltd.
- Honeywell International Inc.
- SICK AG
- STEP Electric Corporation
- Arkel Elektronik San. ve Tic. A.?.
- Lester Controls Ltd.
- Monarch Control Technology Co., Ltd.
- Blue Light Inc.
- Inovance Technology Co., Ltd.
- Kleemann Hellas S.A.
- Canny Elevator Co., Ltd.
- Wittur Holding GmbH
- Suzhou Torin Drive Equipment Co., Ltd.
Market Opportunities and Future Outlook
Interoperability and open-protocol integration are creating whitespace for control vendors that can support multi-vendor modernization without forcing building owners into a single OEM stack. A concrete signal is the June 2026 revision to the CAN in Automation (CiA) 417 application profile (CANopen Lift), which expanded process data objects and added a power supply unit definition to support more standardized communication between elevator control components and simplify integration with building-management systems.
A second opportunity is closer-to-edge inspection and condition-detection, where it can be applied during installation, alignment, and service workflows. In May 2026, Fail Safe Elevator Systems, Inc. launched an AI-assisted pattern-recognition system for elevator alignment detection at the IAEC Forum 2026 (with engineering partner Croxel), indicating active commercialization of inspection tooling that targets technician productivity and quality assurance. Both developments align with architectures that separate a safety domain from an application/connectivity domain inside the controller cabinet, which can make it easier for vendors to add analytics and cybersecurity updates while preserving safety-critical determinism and managing compliance across regions.
Recent Industry Developments in Elevator Control Market
- April 2026: Hyundai Elevator commercialized the ENOBLOC modular elevator system for buildings of 20 stories or higher, with initial deployment reported at the Songdo Hillstate Centerpark site in Incheon, Korea. Modularization is aimed at shorter on-site installation cycles and more repeatable commissioning, which increases emphasis on pre-engineered control cabinets and standardized interfaces. The approach also supports developers seeking schedule certainty in high-rise residential projects.
- April 2025: Kings III Emergency Communications acquired LiftNet to deepen its cloud-based elevator monitoring and emergency-communications capabilities. The transaction expands integrated telemetry and analytics offerings that connect to elevator control and communication systems in the installed base. It reinforces the shift toward recurring revenue models tied to monitoring, compliance, and service workflows.
- August 2024: KONE finalized the purchase of Capitol Elevator to expand its service footprint in the United States, particularly across the Southeast. The added regional density strengthens modernization capacity, where controller replacements and connectivity upgrades are central to meeting newer safety and monitoring requirements. It also improves KONE's ability to bundle controller upgrades with long-term maintenance contracts.
Elevator Control Market Report Scope and Research Methodology
Market Definition and Coverage
This market covers elevator control systems and the related hardware and software that manage elevator movement, door operations, speed regulation, timing delays, and leveling in buildings. It includes control units used in new installations and modernization projects where older elevators are upgraded.
Scope exclusions: We do not count complete elevator or escalator packages, building construction value, and non-elevator building automation that is not directly tied to elevator operation.
Segments Covered in This Report
- By Application
- Residential
- Commercial
- Industrial and Logistics
- Infrastructure and Public Facilities
- By Component
- Controllers
- Drives and Inverters
- Control Panels and COP/LOP
- Sensors and I/O Modules
- Software and Connectivity Platforms
- By Control-System Type
- Conventional Relay-Based
- Microprocessor-Based
- Destination-Control Systems
- IoT-Enabled Smart Controls
- Group / AI Traffic-Optimised Controls
- By Elevator Technology
- Traction
- Machine-Room-Less Traction
- Hydraulic
- Others (Pneumatic, Linear-Motor)
- By Geography
- North America
- United States
- Canada
- Mexico
- South America
- Brazil
- Argentina
- Rest of South America
- Europe
- Germany
- United Kingdom
- France
- Italy
- Spain
- Russia
- Rest of Europe
- Asia-Pacific
- China
- Japan
- India
- South Korea
- South-East Asia
- Rest of Asia-Pacific
- Middle East and Africa
- Middle East
- Saudi Arabia
- United Arab Emirates
- Turkey
- Rest of Middle East
- Africa
- South Africa
- Nigeria
- Rest of Africa
- Middle East
- North America
Data Sources, Market Sizing, and Validation
Desk Research
Desk work starts with mapping what is sold as an elevator control system and where it shows up in new build and retrofit spending. We anchor the model using public sources such as building and construction statistics, housing and commercial building completions, and urban development indicators from government agencies and city development bodies.
To avoid guessing demand, we also review elevator safety and inspection requirements, code updates, and modernization triggers from standards bodies and national elevator safety agencies, along with trade association publications on elevator and building services. Import and export customs summaries help us sanity check the direction of component flows in regions with high equipment reliance. Company annual reports, product catalogs, investor presentations, and reputable press coverage are used to confirm product boundaries and pricing logic, and then a paid subscription for company financials and news is used to cross-check revenue mix and exposure. These examples are not exhaustive, and many other public sources were reviewed for data collection, validation, and clarification.
Primary Interviews and Surveys
Primary work is used to pressure test assumptions that desk sources cannot fully explain, such as modernization share, typical controller replacement cycles, and how pricing moves with building height and traffic needs. We speak with a mix of control system suppliers, elevator OEM channels, installers, maintenance providers, consultants, and large building operators across APAC, EMEA, and the Americas, so regional construction patterns and retrofit intensity can be reflected in the final numbers.
Distribution of primary research fieldwork respondents
| Company type | Respondent position | Region |
|---|---|---|
| Top tier: 30% | CXOs: 14% | APAC: 50% |
| Mid tier: 54% | Functional/Unit leaders: 32% | EMEA: 32% |
| Smaller Players: 16% | Managers: 54% | Americas: 18% |
Market-Sizing & Forecasting
Sizing starts with a top-down demand pool build that links construction activity and installed base dynamics to control system spending, then it is adjusted using grounded bottom-up checks. For elevator control, the demand pool is reconstructed using indicators such as new elevator installations tied to residential and commercial completions, the aging profile of installed elevators that drives modernization, and typical replacement cycles for controllers and door operators.
We then layer in pricing logic that reflects mix changes, including destination dispatch adoption, connectivity features, and the share of projects that require higher-spec controllers for high-rise traffic patterns. Where regional data is patchy, gaps are handled by using proxied indicators such as permitting intensity, urban population growth, and retrofit policy signals, followed by targeted expert follow-ups to keep assumptions realistic. Forecasts are built using scenario analysis supported by short input series smoothing, because construction cycles and retrofit waves do not always move in a straight line. The final model totals are corroborated with selective roll-ups using sampled supplier revenues, channel checks on modernization volumes, and a volume times ASP cross-check for key controller categories.
Data Validation & Update Cycle
Validation is done in steps so the number is not driven by one data point. We compare outputs against independent signals such as construction starts, elevator installation activity, and modernization intensity, and then we run variance checks by region to spot outliers that do not match known building cycles.
If large gaps appear between modeled demand and what interviews suggest, we re-check the scope boundary, the assumed replacement rates, and the pricing curve before sign-off. Each report is refreshed annually, and interim updates are made when material events occur, such as major code changes or sharp shifts in construction demand. Before delivery, a final analyst review pass is completed so clients receive an updated view aligned to the latest public data and interview learnings.
Mordor Intelligence's Elevator Control Market Estimate Compared With Other Published Estimates
Different published market sizes for elevator control can look confusing, even when they are all trying to describe a similar space. The spread usually comes from how each study draws the product boundary, which year is treated as the base, and how retrofit and software elements are counted.
Installed base modernization signals, such as controller replacement cycles and the share of aging elevators moving into upgrade programs, are used as cross-checks that keep Mordor Intelligence tied to the control-system demand pool counted in USD 9.59 B (2026). Other estimates can shift upward when they bundle broader elevator packages, use aggressive pricing progression, or rely more heavily on vendor-reported totals without the same set of independent checks by region.
Benchmark comparison
| Source | Market Size | Gaps in Research Methodology |
|---|---|---|
| Mordor Intelligence | USD 9.59 B (2026) | |
| Industry Research Outlet A | USD 14.47 B (2024) | Uses an earlier base year and appears to apply a broader revenue frame with multiple segment lenses, which can pull in adjacent elevator electronics and service-linked revenue that is not limited to control operation and modernization replacements. |
| Global Consultancy B | USD 9.80 B (2024) | Anchors the series on a different base year and growth window, and the scope description is less explicit on what is excluded, which can change how software features, connected monitoring, and controller upgrades are valued across regions. |
The table shows that year selection and scope boundaries explain most of the gap, not just growth expectations. By keeping the demand pool tied to installation and modernization triggers, and then checking the totals against pricing and replacement patterns, we end up with a market size that is easier to trace and repeat when assumptions are updated.
Key Questions Answered in the Report
How large is the elevator control market in 2026?
The elevator control market size reached USD 9.59 billion in 2026 and is forecast to hit USD 12.19 billion by 2031.
Which region leads demand for elevator controls?
Asia-Pacific holds 43.30% of global revenue thanks to rapid urbanization and smart-city investments.
What segment grows fastest to 2031?
Industrial and logistics applications post the quickest advance at a 6.05% CAGR as warehouses adopt vertical lift modules.
Why are smart controls gaining share?
IoT-enabled controllers deliver predictive maintenance, energy savings, and tenant-experience gains that outweigh higher capex.
What is the main restraint on adoption?
High upfront capital expenditure, ranging from USD 15,000 to USD 50,000 per car, deters owners despite long-term savings.
Which companies dominate the competitive landscape?
Otis, KONE, Schindler, and TK Elevator lead, controlling over half of global service revenue through expansive maintenance networks.