Electric Bus Battery Pack Market Size and Share
Market Overview
| Study Period | 2019 - 2031 |
|---|---|
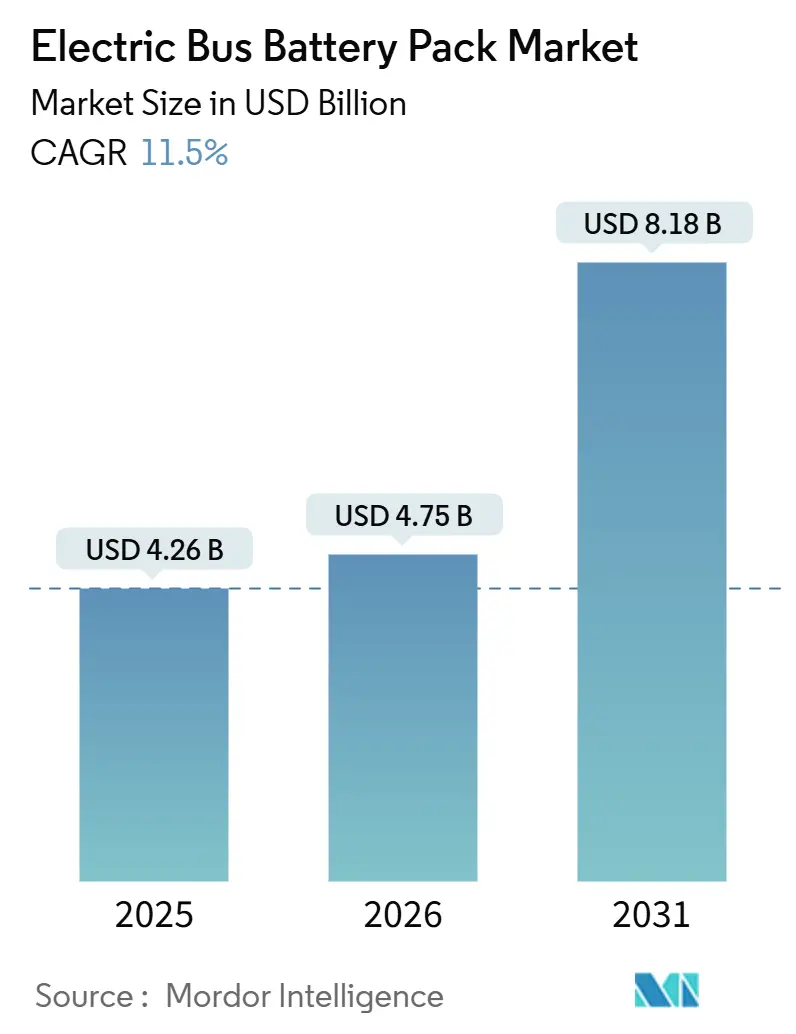
| Market Size (2026) | USD 4.75 Billion |
| Market Size (2031) | USD 8.18 Billion |
| Growth Rate (2026 - 2031) | 11.50% CAGR |
| Fastest Growing Market | South America |
| Largest Market | Asia Pacific |
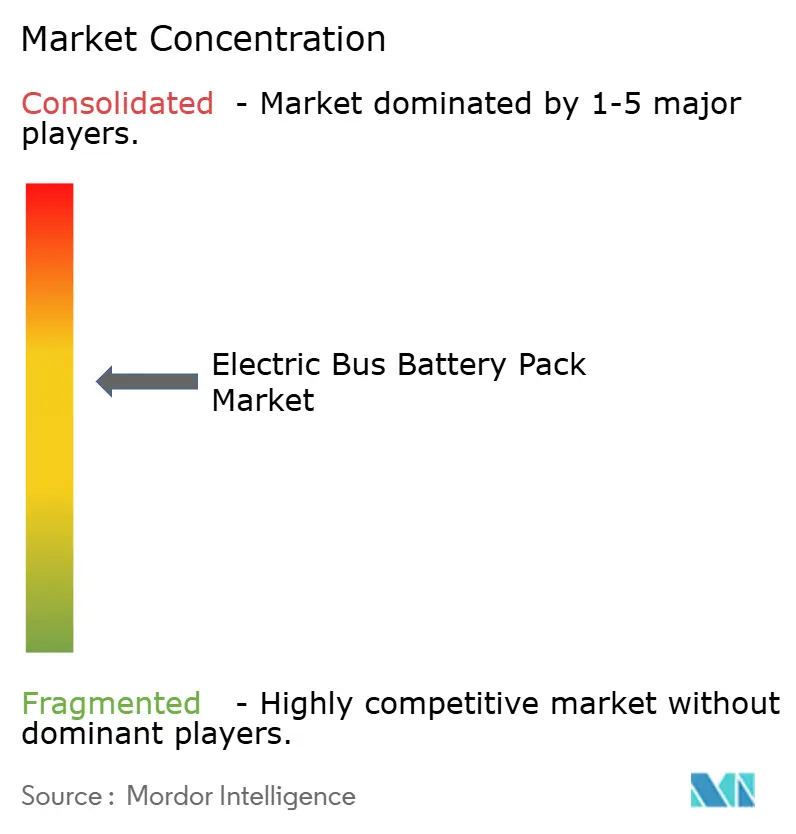
| Market Concentration | Medium |
Major Players *Disclaimer: Major Players sorted in no particular order Image © Mordor Intelligence. Reuse requires attribution under CC BY 4.0. | |
Electric Bus Battery Pack Market Analysis by Mordor Intelligence
The electric bus battery pack market size is expected to increase from USD 4.26 billion in 2025 to USD 4.75 billion in 2026 and reach USD 8.18 billion by 2031, advancing at an 11.50% CAGR over 2026-2031. Accelerating zero-emission mandates, sharper declines in lithium iron phosphate (LFP) pricing, and scaled manufacturing footprints across Asia are anchoring this upward trajectory. Transit agencies increasingly favor high-capacity packs that extend route length, while megawatt charging pilots shorten recharging windows, reinforcing confidence in all-day electric operations. At the same time, technology convergence around cell-to-pack (CTP) integration and 800 V+ electrical architectures signals a shift from component cost cutting toward holistic system optimization. Competitive dynamics hinge on cost-per-kilowatt-hour leadership, chemistry diversification, and compliance with local content requirements as manufacturers race to secure long-term supply contracts with global bus OEMs.
Key Report Takeaways
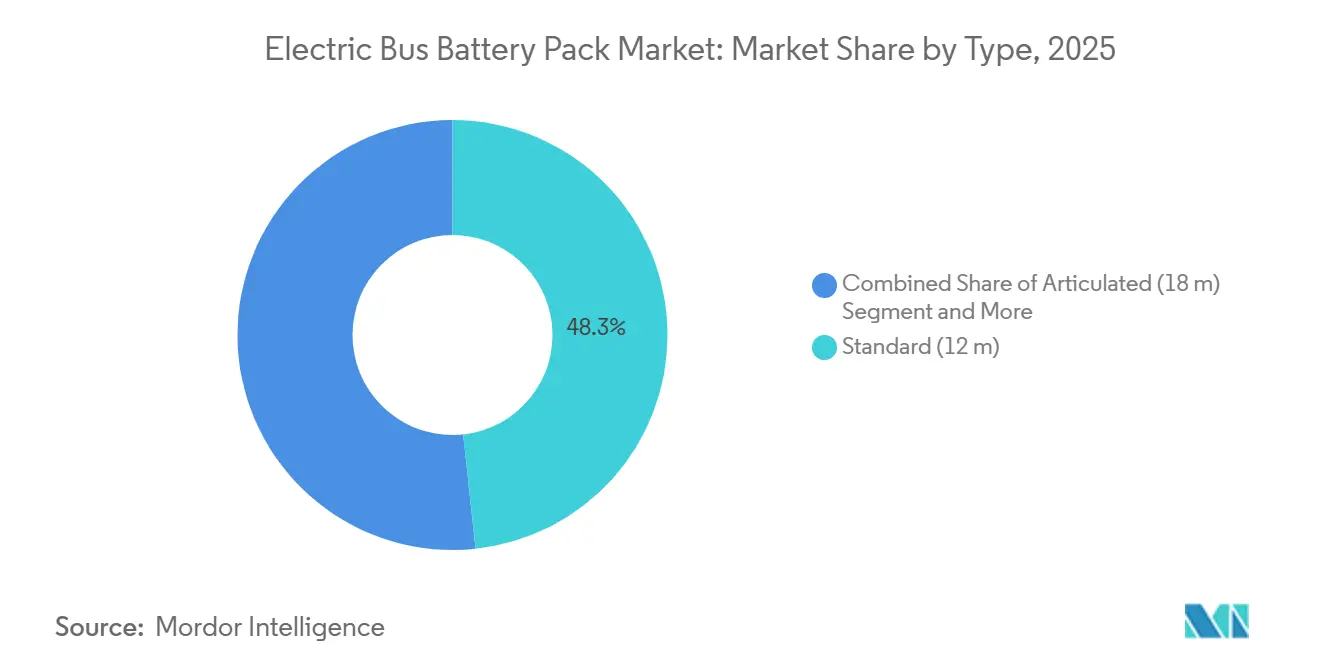
- By type, standard (12 m) buses led with 48.25% of the electric bus battery pack market share in 2025, while articulated (18 m) buses are expanding at a 13.64% CAGR through 2031.
- By propulsion type, battery-electric vehicles captured 89.33% of the electric bus battery pack market in 2025 and are advancing at a 12.58% CAGR through 2031.
- By battery chemistry, LFP retained 57.02% of the electric bus battery pack market share in 2025, while LMFP is rising fastest at a 13.97% CAGR through 2031.
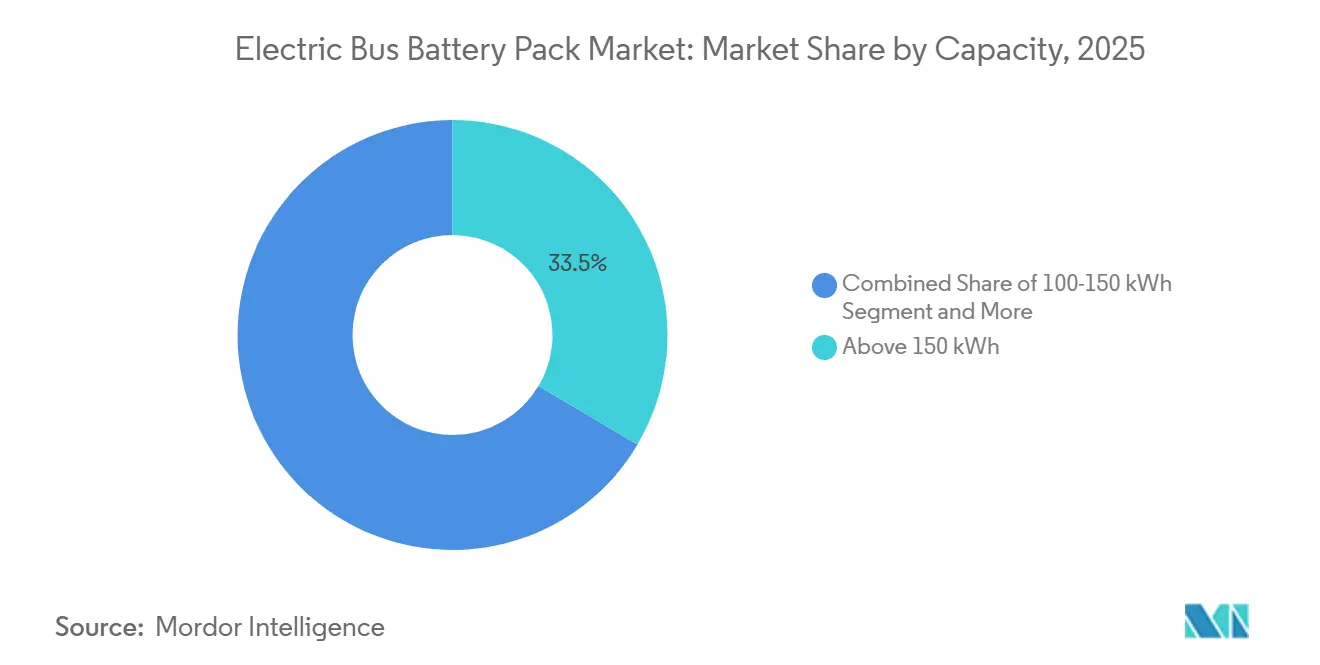
- By capacity, packs above 150 kWh commanded a 33.46% share of the electric bus battery pack market size in 2025; the 100-150 kWh tier shows the highest projected CAGR at 15.68% to 2031.
- By battery form, prismatic models held 64.22% share in 2025, whereas cylindrical formats are set to expand at a 14.57% CAGR through 2031.
- By voltage class, 600-800 V systems held 49.17% share in 2025, whereas 800 V+ platforms are growing at 13.04% CAGR through 2031.
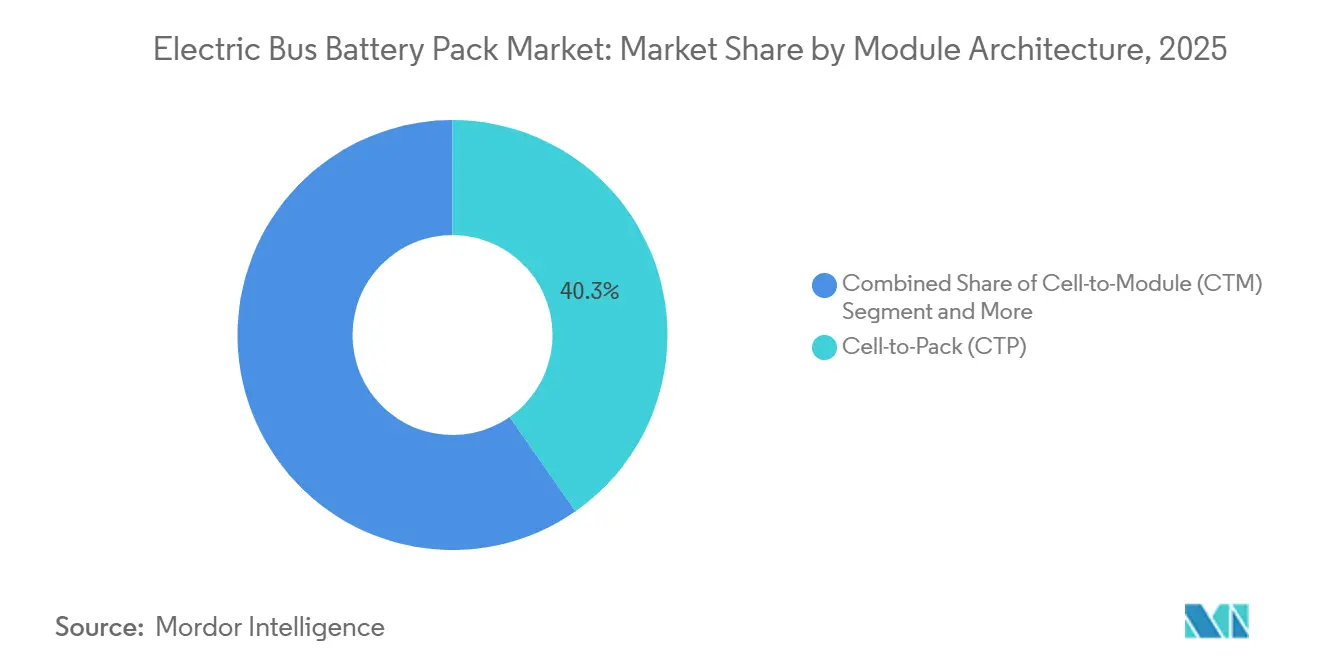
- By module architecture, cell-to-pack captured 40.26% of the electric bus battery pack market in 2025 and is advancing at a 12.03% CAGR through 2031.
- By component, the cathode held a 36.14% share in 2025, whereas the anode is set to grow with the fastest CAGR of 14.06% by 2031.
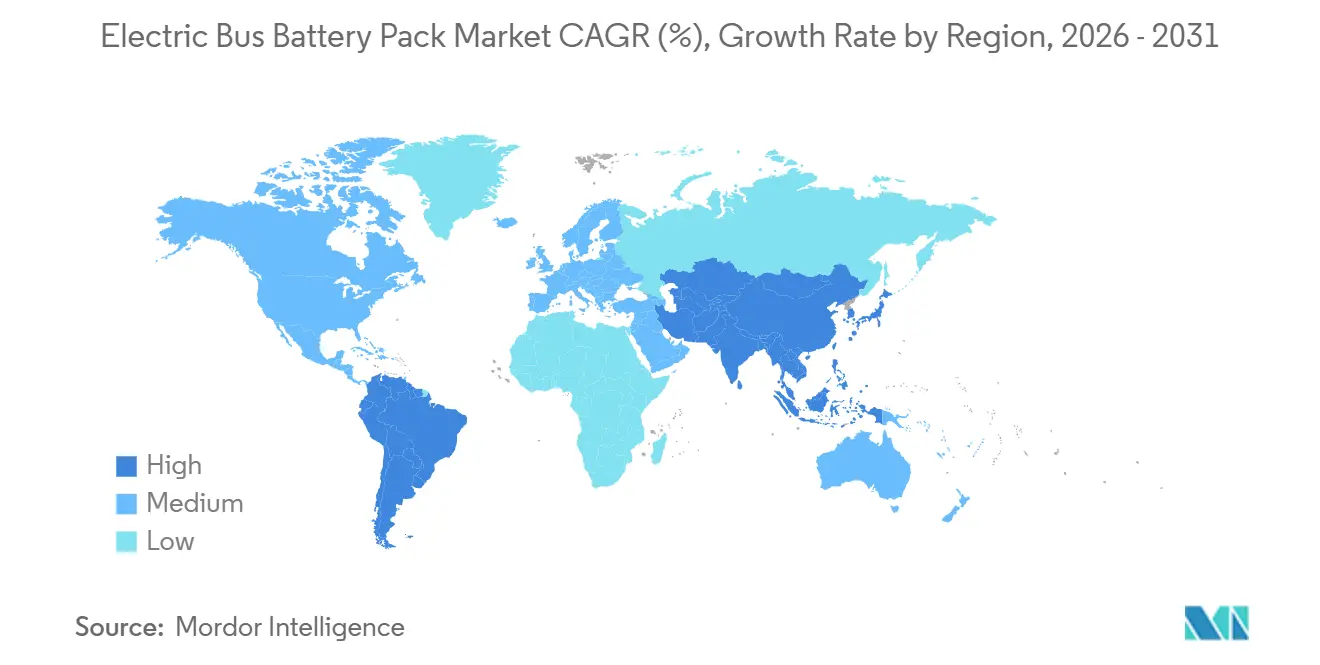
- By geography, Asia-Pacific accounted for 63.22% of the electric bus battery pack market share in 2025; South America records the fastest regional CAGR at 15.12% to 2031.
Note: Market size and forecast figures in this report are generated using Mordor Intelligence’s proprietary estimation framework, updated with the latest available data and insights as of January 2026.
Global Electric Bus Battery Pack Market Trends and Insights
Drivers Impact Analysis*
| Driver | (~) % Impact on CAGR Forecast | Geographic Relevance | Impact Timeline |
|---|---|---|---|
| Zero-Emission Bus Mandates | +2.8% | North America, EU, China | Medium term (2-4 years) |
| Declining Prices for LFP+LMFP | +2.1% | Global | Short term (≤ 2 years) |
| Battery-As-A-Service Scaling | +1.6% | Asia-Pacific, South America | Long term (≥ 4 years) |
| Telematics-Driven TCO Analytics | +1.4% | North America, EU, Asia-Pacific | Medium term (2-4 years) |
| Megawatt Charging Pilots | +1.2% | EU, North America | Long term (≥ 4 years) |
| Solid-State Prototype Milestones | +0.9% | Global | Long term (≥ 4 years) |
| Source: Mordor Intelligence | |||


Zero-Emission-Bus Mandates (United States, EU, China)
California’s Innovative Clean Transit rule requires 100% zero-emission transit agency new bus purchases by 2029, while the EU Clean Vehicles Directive sets binding electric‐bus procurement quotas that tighten over time. Beijing and other tier-one Chinese cities apply parallel dual-credit incentives that penalize diesel procurement and reward the uptake of battery electric vehicles. Together, these mandates increase tender volumes, shifting agency focus from budgetary optimization to delivery-schedule certainty. Suppliers able to certify packs above 800 V and to integrate with standardized CCS or MCS connectors gain preference as regulators align on interoperability. The policy momentum thus accelerates volume aggregation and steers global designs toward compliance-ready configurations.
Declining USD/kWh for LFP + LMFP Chemistries
In 2025, average pricing for LFP packs declined, while LMFP prices also decreased, narrowing the historical gap with nickel-manganese-cobalt (NMC) alternatives. As both chemistries are expected to become more cost-competitive in the coming years, transit agencies stand poised to achieve lifetime cost parity with diesel across the majority of duty cycles. LMFP’s energy-density uplift over LFP unlocks articulated bus range targets without thermal-runaway risk, which is decisive for operators in hot climates. The combination of lower cost and higher density tilts tenders toward cobalt-free chemistries, softening exposure to volatile upstream metal prices. Manufacturers that secured manganese supply contracts early now leverage cost stability as a bidding advantage.
Battery-Leasing and As-A-Service Models Scaling in Asia-Pacific
Chinese and Indian transit operators increasingly sign per-kilometer energy service contracts that transfer battery ownership to suppliers such as BYD and CATL. Up-front bus prices fall, easing municipal budget constraints and accelerating tender approvals. Providers recoup investment through energy tariffs, second-life resale, and end-of-life recycling economics, aligning manufacturer incentives with lifetime performance. Early adopters report significant reductions in total cost of ownership versus outright purchase models, encouraging American fleets to pilot similar schemes. The service pivot also insulates agencies from lithium or nickel price swings, stabilizing long-term financial planning.
Fleet-Telematics-Driven TCO Analytics Adoption
Real-time telemetry pairs state-of-health data with route-level energy modeling, enabling agencies to forecast degradation, schedule opportunistic top-ups, and optimize driver behavior. Predictive maintenance modules alert technicians before cell imbalance reaches critical thresholds, reducing on-route failures and warranty claims. Data-driven scheduling cuts idle charging windows, raising asset utilization rates. As telematics dashboards evolve into procurement decision tools, buyers prioritize battery packs that offer open API access and deep-cycle analytics over legacy, closed-loop platforms. Consequently, total-cost-per-kilometer metrics now include avoided downtime and residual value projections rather than equipment cost alone.
Restraints Impact Analysis*
| Restraint | (~) % Impact on CAGR Forecast | Geographic Relevance | Impact Timeline |
|---|---|---|---|
| Upstream Mineral Price Volatility | -2.3% | Global | Medium term (2-4 years) |
| High-Voltage Safety Certification | -1.8% | EU, North America | Short term (≤ 2 years) |
| Urban Grid Constraints Depot Charging | -1.6% | Global metros | Medium term (2-4 years) |
| Second-Life Pack Value Uncertainty | -1.1% | Developed markets | Long term (≥ 4 years) |
| Source: Mordor Intelligence | |||
Upstream Critical-Mineral Supply Volatility
In 2025, lithium carbonate prices experienced significant fluctuations, with cobalt and nickel showing similar volatility, influenced by geopolitical tensions. Such spikes complicate fixed-price procurement contracts that public agencies favor. In response, manufacturers are pivoting toward cobalt-free LFP and LMFP chemistries, yet manganese and phosphate logistics still face capacity constraints. Spot-market instability raises working-capital needs for cell makers, occasionally delaying bus deliveries. Long-term mining expansions in Argentina and Australia may ease shortages in the coming years, but near-term hedging costs persist.
High-Voltage (Above 800 V) Safety Certification Bottlenecks
ECE R100 in the EU and Federal Motor Vehicle Safety Standards in the United States require rigorous electromagnetic compatibility and arc-fault testing above 800 V. Yet, only a handful of laboratories can certify such systems [1]“ECE R100 High-Voltage Compliance Guide,” SAE International, sae.org. Queue times stretch several months, extending product launches and inflating engineering budgets. Divergent national interpretations further compel repeat testing, thereby elevating barriers to new entrants. Established suppliers leverage prior certifications to shorten lead times and preserve market advantage. Harmonized global test protocols would unlock faster technology diffusion, but negotiations remain protracted.
*Our forecasts treat driver/restraint impacts as directional, not additive. The impact forecasts reflect baseline growth, mix effects, and variable interactions.
Segment Analysis
By Type: Articulated Buses Lead Growth Despite Standard Dominance
Standard (12 m) vehicles captured 48.25% of the electric bus battery pack market share in 2025, as they suit diverse route densities and benefit from mature supply chains. However, articulated (18 m) formats post a 13.64% CAGR through 2031, driven by Bus Rapid Transit corridors seeking higher passenger throughput at lower per-seat cost [2]“BRT Systems Expand Articulated Bus Demand,” Transport & Environment, transportenvironment.org. The electric bus battery pack market for articulated units is forecast to expand significantly by 2031 as cities allocate climate funding toward capacity upgrades.
Demand for larger platforms is driving average pack capacity beyond 200 kWh, prompting manufacturers to integrate liquid cooling and robust battery management to mitigate thermal hotspots. Accessibility regulations favor articulated designs that offer dual doorways and spacious, low-floor areas. As urban planners prioritize curbspace, long vehicles reduce fleet counts, lowering labor and maintenance overhead. Consequently, battery suppliers focusing on modular, higher-voltage solutions stand to capture incremental value in this sub-segment.


By Propulsion Type: BEV Dominance Accelerates Market Consolidation
Battery electric vehicles (BEVs) controlled 89.33% of total shipments in 2025, essentially absorbing former plug-in hybrid niches. The electric bus battery pack market tied to BEVs is set to grow significantly by 2031, with a 12.58% CAGR.
PHEVs linger where mountainous routes or limited grid access complicate full electrification, yet battery density and charging build-outs are eroding these barriers rapidly. The simplicity of all-electric drivetrains cuts parts inventory and technician retraining costs, which resonates with resource-constrained agencies. As regulatory language tightens around zero-tailpipe-emissions requirements, PHEV eligibility for subsidies declines, further squeezing market share. Consequently, cell makers increasingly tailor chemistries and form factors exclusively for BEV duty cycles, reinforcing their dominance.
By Battery Chemistry: LMFP Emergence Challenges LFP Leadership
LFP retained a 57.02% share in 2025, given its cost leadership and thermal stability, yet LMFP’s 13.97% CAGR positions it as the fastest-rising alternative. The electric bus battery pack market size attributable to LMFP could exceed further by 2031 if current trajectories persist.
LMFP’s manganese doping increases energy density while retaining cobalt-free status, making it suitable for articulated buses that need range without flammable solvents. Cold-weather resilience furthers penetration in Northern Europe and Canada. Meanwhile, NMC and NCA chemistries retreat to niche high-power applications amid volatility in metal prices. Suppliers investing in dual-chemistry production lines hedge demand shifts and ensure stable utilization rates.
By Capacity: High-Capacity Packs Drive Range Extension Strategies
Packs above 150 kWh captured a 33.46% share in 2025, aligning with the operator's desire for a 250-300 km range between charges. The 100-150 kWh bracket grows fastest, with a 15.68% CAGR, as improved energy density lets standard buses meet daily schedules with smaller, lighter packs, trimming tire wear and housing costs.
Route-optimized procurement now sees agencies mix pack sizes within fleets, matching capacity to duty cycles to avoid excess-weight penalties. Megawatt chargers enable rapid top-ups, allowing some operators to downsize packs without risking service reliability. Consequently, pricing curves flatten as manufacturing volumes converge around two dominant capacity tiers rather than the former bespoke landscape.
By Battery Form: Cylindrical Cells Gain Ground on Prismatic Dominance
Prismatic formats owned a 64.22% share in 2025, owing to superior volumetric efficiency in rectangular under-floor enclosures. Yet cylindrical designs, buoyed by automotive 4680 investments, clock a 14.57% CAGR through 2031.
Standardized cell geometry lowers tooling costs and simplifies global sourcing, while individual cell isolation enhances thermal runaway containment. Bus OEMs adopting skateboard chassis can now embed cylindrical packs within frame rails without sacrificing aisle height. Conversely, pouch cells remain a niche for low-vibration shuttle services but face durability skepticism in heavy-duty cycles.
By Voltage Class: 800 V+ Systems Drive Performance Innovation
The 600-800 V tier held 49.17% share in 2025, yet 800 V+ climbs at 13.04% CAGR as agencies pursue sub-20-minute charge windows. The electric bus battery pack market size for very-high-voltage systems is forecast to grow significantly by 2031.
Higher voltage shrinks conductor gauge and inverter mass, marginally boosting passenger capacity. Still, it demands reinforced insulation and retraining for maintenance crews. Suppliers offering turnkey safety certification services gain bidding leverage, particularly in North America, where federal grants stipulate adherence to evolving UL standards.
By Module Architecture: Cell-to-Pack Technology Reshapes Integration
Cell-to-Pack (CTP) solutions accounted for a 40.26% share in 2025 with an 12.03% CAGR outlook. Eliminating intermediate modules lifts energy density and reduces part count, cutting assembly labor.
However, replacing defective cells is complex, prompting OEMs to extend pack warranties while refining diagnostic algorithms. Fleets with rigorous preventive maintenance protocols, therefore, favor CTP, whereas agencies prioritizing field-level reparability may still opt for Cell-to-Module (CTM) strategies.
By Component: Cathode Innovation Drives Performance Differentiation
Cathodes accounted for 36.14% of the total pack value in 2025, mirroring their influence on cost and range. Anodes rise fastest, with a 14.06% CAGR, as silicon-blend formulations enable higher charge rates.
Separator advances, such as ceramic-coated films, improve thermal shut-off performance, a critical safety factor for densely packed urban depots. Electrolyte suppliers develop fire-resistant phosphate blends compatible with both LFP and LMFP chemistries, ensuring cross-platform scalability. Collectively, material breakthroughs are steering the electric bus battery pack market toward greater durability and fewer warranty claims.
Geography Analysis
Asia-Pacific preserved 63.22% of global volume in 2025 due to China’s scale economics, India’s FAME II incentives, and South Korea’s advanced cell manufacturing[3]“Electric Bus Production Statistics 2024,” China Association of Automobile Manufacturers, caam.org.cn. Regional governments bundle bus orders with local-content rules, channeling demand to domestic factories and shortening lead times. Integrated supply chains spanning lithium processing in Sichuan to pack assembly in Guangdong compress unit costs, granting regional suppliers a decisive pricing edge. Furthermore, large-city pilot programs in Indonesia and Thailand showcase fast-charge depots co-located with metro hubs, encouraging replication across Southeast Asia.
South America logs the fastest 15.12% CAGR through 2031 as Brazil, Colombia, and Chile earmark climate-finance funds for clean transit. BYD and Yutong establish knock-down kit plants to bypass import tariffs, while local lithium reserves in Argentina attract cathode refiners. Multilateral banks underwrite charging infrastructure, mitigating sovereign risk, and unlocking low-interest equipment loans. As pack costs slide, even mid-sized cities like Medellín initiate full fleet conversions, signaling a second adoption wave beyond capital metros.
Europe and North America exhibit mature adoption curves yet sustain steady replenishment demand as first-generation buses approach mid-life battery swaps. The EU Green Deal funnels cohesion funds into depot upgrades, and the United States federal grants subsidize bus prices for low-income jurisdictions. These regions prioritize advanced features such as vehicle-to-grid capability and collision-safe pack enclosures, raising average selling prices. Nevertheless, domestic content stipulations encourage joint ventures to localize pack manufacturing, reshaping supply footprints.

Competitive Landscape
The top suppliers—BYD, CATL, LG Energy Solution, Samsung SDI, and CALB—command a notable share of worldwide shipments, yielding a moderately concentrated structure. Chinese champions leverage vertical integration from cell chemistry to recycling, underpinning cost leadership and rapid iteration cycles. Korean and Japanese incumbents compete on high-energy chemistries and global OEM relationships, often pairing packs with proprietary battery management software.
Strategic themes center on geography diversification, with Asian players building plants in Hungary, Brazil, and the United States to dodge tariffs and comply with subsidy requirements. Chemistry hedging is another priority as suppliers add LMFP lines alongside legacy LFP or NMC capacity to balance material risk. Meanwhile, fast-growth specialists such as Microvast emphasize modular designs that can be swapped in under 10 minutes, catering to depots lacking megawatt chargers. Recycling and second-life services emerge as critical differentiators, with closed-loop offerings influencing tender evaluations during life-cycle cost scoring.
Investment in solid-state R&D is accelerating, as evidenced by CATL’s pilot line announcements and LG Energy Solution’s joint research with university consortia. Early access agreements give leading bus OEMs options on next-generation chemistry without committing procurement budgets upfront. As technology pathways diversify, competitive advantage increasingly hinges on ecosystem depth—cell chemistry, power electronics, software analytics, and circularity—rather than any single component attribute.
Electric Bus Battery Pack Industry Leaders
Contemporary Amperex Technology Co., Limited (CATL)
BYD Company Ltd.
LG Energy Solution, Ltd.
Samsung SDI Co., Ltd.
CALB Group Co., Ltd.
- *Disclaimer: Major Players sorted in no particular order

Recent Industry Developments
- December 2025: NFI Group Inc., a leader in propulsion-agnostic bus and coach mobility solutions, signed a master settlement agreement with XALT Energy, LLC, addressing costs tied to the recall of Generation 3 batteries and future expenses for buses using XALT batteries. NFI will also collaborate with a U.S. battery supplier to develop a new electric bus battery launching in 2027, strengthening its electric bus backlog.
- December 2025: Solaris launched a service called "Zero-emission vehicle retrofit", focused on replacing key components, especially batteries, in older electric buses. The goal was to extend their operational life and avert premature decommissioning.
- December 2025: Daimler Buses introduced remanufacturing services for electric bus batteries and confirmed a 2026 launch of an upgraded replacement pack that extends range.
- April 2025: MAN Truck & Bus began series production of battery packs in Nuremberg and pledged an additional EUR 150 million (~USD 175 million) investment to expand capacity.


Global Electric Bus Battery Pack Market Report Scope
The scope includes segmentation by type (mini/microbus (below 8 m), midi (8-10.5 m), standard (12 m), and articulated 18m), propulsion type (battery electric vehicle and plug-in hybrid electric vehicle), battery chemistry (LFP, LMFP, NMC, NCA, LTO, and others), capacity (below 15 kWh, 15-40 kWh, 40-60 kWh, 60-80 kWh, 80-100 kWh, 100-150 kWh, and above 150 kWh), battery form (cylindrical, pouch, and prismatic), voltage class (below 400 V, 400-600 V, 600-800 V, and above 800 V), module architecture (cell-to-module, cell-to-pack, and module-to-pack), and component (anode, cathode, electrolyte, and separator). The analysis also covers regional-level segmentation, including North America, South America, Europe, Asia-Pacific, the Middle East, and Africa. Market size and growth forecasts are presented by value (USD) and volume (units).
| Mini / Microbus (Below 8 m) |
| Midi (8-10.5 m) |
| Standard (12 m) |
| Articulated (18 m) |
| Battery Electric Vehicle (BEV) |
| Plug-in Hybrid Electric Vehicle (PHEV) |
| LFP |
| LMFP |
| NMC (111/523/622/712/811) |
| NCA |
| LTO |
| Others |
| Below 15 kWh |
| 15-40 kWh |
| 40-60 kWh |
| 60-80 kWh |
| 80-100 kWh |
| 100-150 kWh |
| Above 150 kWh |
| Cylindrical |
| Pouch |
| Prismatic |
| Below 400 V (48-350 V) |
| 400-600 V |
| 600-800 V |
| Above 800 V |
| Cell-to-Module (CTM) |
| Cell-to-Pack (CTP) |
| Module-to-Pack (MTP) |
| Anode |
| Cathode |
| Electrolyte |
| Separator |
| North America | United States |
| Canada | |
| Rest of North America | |
| South America | Brazil |
| Colombia | |
| Chile | |
| Argentina | |
| Rest of South America | |
| Europe | Germany |
| France | |
| United Kingdom | |
| Poland | |
| Italy | |
| Sweden | |
| Hungary | |
| Spain | |
| Netherlands | |
| Russia | |
| Rest of Europe | |
| Asia-Pacific | China |
| India | |
| Japan | |
| South Korea | |
| Thailand | |
| Indonesia | |
| Vietnam | |
| Australia | |
| Rest of Asia-Pacific | |
| Middle East and Africa | United Arab Emirates |
| Saudi Arabia | |
| Turkey | |
| South Africa | |
| Egypt | |
| Rest of the Middle East and Africa |
| By Type | Mini / Microbus (Below 8 m) | |
| Midi (8-10.5 m) | ||
| Standard (12 m) | ||
| Articulated (18 m) | ||
| By Propulsion Type | Battery Electric Vehicle (BEV) | |
| Plug-in Hybrid Electric Vehicle (PHEV) | ||
| By Battery Chemistry | LFP | |
| LMFP | ||
| NMC (111/523/622/712/811) | ||
| NCA | ||
| LTO | ||
| Others | ||
| By Capacity | Below 15 kWh | |
| 15-40 kWh | ||
| 40-60 kWh | ||
| 60-80 kWh | ||
| 80-100 kWh | ||
| 100-150 kWh | ||
| Above 150 kWh | ||
| By Battery Form | Cylindrical | |
| Pouch | ||
| Prismatic | ||
| By Voltage Class | Below 400 V (48-350 V) | |
| 400-600 V | ||
| 600-800 V | ||
| Above 800 V | ||
| By Module Architecture | Cell-to-Module (CTM) | |
| Cell-to-Pack (CTP) | ||
| Module-to-Pack (MTP) | ||
| By Component | Anode | |
| Cathode | ||
| Electrolyte | ||
| Separator | ||
| By Geography | North America | United States |
| Canada | ||
| Rest of North America | ||
| South America | Brazil | |
| Colombia | ||
| Chile | ||
| Argentina | ||
| Rest of South America | ||
| Europe | Germany | |
| France | ||
| United Kingdom | ||
| Poland | ||
| Italy | ||
| Sweden | ||
| Hungary | ||
| Spain | ||
| Netherlands | ||
| Russia | ||
| Rest of Europe | ||
| Asia-Pacific | China | |
| India | ||
| Japan | ||
| South Korea | ||
| Thailand | ||
| Indonesia | ||
| Vietnam | ||
| Australia | ||
| Rest of Asia-Pacific | ||
| Middle East and Africa | United Arab Emirates | |
| Saudi Arabia | ||
| Turkey | ||
| South Africa | ||
| Egypt | ||
| Rest of the Middle East and Africa | ||


Market Definition
- Battery Chemistry - Various types of battery chemistry considred under this segment include LFP, NCA, NCM, NMC, Others.
- Battery Form - The types of battery forms offered under this segment include Cylindrical, Pouch and Prismatic.
- Body Type - Body types considered under this segment include is variety of buses.
- Capacity - Various types of battery capacities inldude under theis segment are 15 kWH to 40 kWH, 40 kWh to 80 kWh, Above 80 kWh and Less than 15 kWh.
- Component - Various components covered under this segment include anode, cathode, electrolyte, separator.
- Material Type - Various material covered under this segment include cobalt, lithium, manganese, natural graphite, nickel, other material.
- Method - The types of method covered under this segment include laser and wire.
- Propulsion Type - Propulsion types considered under this segment include BEV (Battery electric vehicles), PHEV (plug-in hybrid electric vehicle).
- ToC Type - ToC 3
- Vehicle Type - Vehicle type considered under this segment include commercial vehicles with various EV powertrains.
| Keyword | Definition |
|---|---|
| Electric vehicle (EV) | A vehicle which uses one or more electric motors for propulsion. Includes cars, buses, and trucks. This term includes all-electric vehicles or battery electric vehicles and plug-in hybrid electric vehicles. |
| PEV | A plug-in electric vehicle is an electric vehicle that can be externally charged and generally includes all electric vehicles as well as plug-electric vehicles as well as plug-in hybrids. |
| Battery-as-a-Service | A business model in which the battery of an EV can be rented from a service provider or swapped with another battery when it runs out of charge |
| Battery Cell | The basic unit of an electric vehicle's battery pack, typically a lithium-ion cell, that stores electrical energy. |
| Module | A subsection of an EV battery pack, consisting of several cells grouped together, often used to facilitate manufacturing and maintenance. |
| Battery Management System (BMS) | An electronic system that manages a rechargeable battery by protecting the battery from operating outside its safe operating area, monitoring its state, calculating secondary data, reporting data, controlling its environment, and balancing it. |
| Energy Density | A measure of how much energy a battery cell can store in a given volume, usually expressed in watt-hours per liter (Wh/L). |
| Power Density | The rate at which energy can be delivered by the battery, often measured in watts per kilogram (W/kg). |
| Cycle Life | The number of complete charge-discharge cycles a battery can perform before its capacity falls under a specified percentage of its original capacity. |
| State of Charge (SOC) | A measurement, expressed as a percentage, that represents the current level of charge in a battery compared to its capacity. |
| State of Health (SOH) | An indicator of the overall condition of a battery, reflecting its current performance compared to when it was new. |
| Thermal Management System | A system designed to maintain optimal operating temperatures for an EV's battery pack, often using cooling or heating methods. |
| Fast Charging | A method of charging an EV battery at a much faster rate than standard charging, typically requiring specialized charging equipment. |
| Regenerative Braking | A system in electric and hybrid vehicles that recovers energy normally lost during braking and stores it in the battery. |


Research Methodology
Mordor Intelligence follows a four-step methodology in all its reports.
- Step-1: Identify Key Variables: To build a robust forecasting methodology, the variables and factors identified in Step-1 are tested against available historical market numbers. Through an iterative process, the variables required for market forecast are set and the model is built based on these variables.
- Step-2: Build a Market Model: Market-size estimations for the historical and forecast years have been provided in revenue and volume terms. Market revenue is calculated by multiplying the volume demand with volume-weighted average battery pack price (per kWh). Battery pack price estimation and forecast takes into account various factors affecting ASP, such as inflation rates, market demand shifts, production costs, technological developments, and consumer preferences, providing estimations for both historical data and future trends.
- Step-3: Validate and Finalize: In this important step, all market numbers, variables, and analyst calls are validated through an extensive network of primary research experts from the market studied. The respondents are selected across levels and functions to generate a holistic picture of the market studied.
- Step-4: Research Outputs: Syndicated Reports, Custom Consulting Assignments, Databases & Subscription Platforms


