
Market Overview
| Study Period | 2020 - 2031 |
|---|---|
| Forecast Data Period | 2026 - 2031 |
| Base Year Market Size (2025) | USD 324.28 Million |
| Market Size (2026) | USD 335.66 Million |
| Market Size (2031) | USD 398.92 Million |
| Growth Rate (2026 - 2031) | 3.51 % |
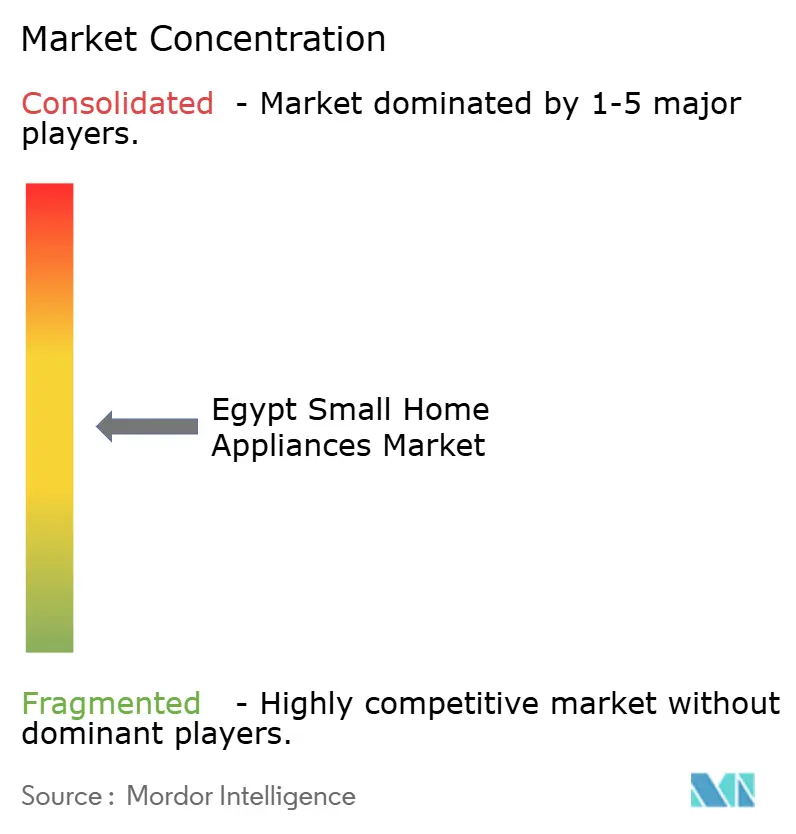
| Market Concentration | Medium |
Major Players *Disclaimer: Major Players sorted in no particular order Image © Mordor Intelligence. Reuse requires attribution under CC BY 4.0. | |
Egypt Small Home Appliances Market Analysis by Mordor Intelligence
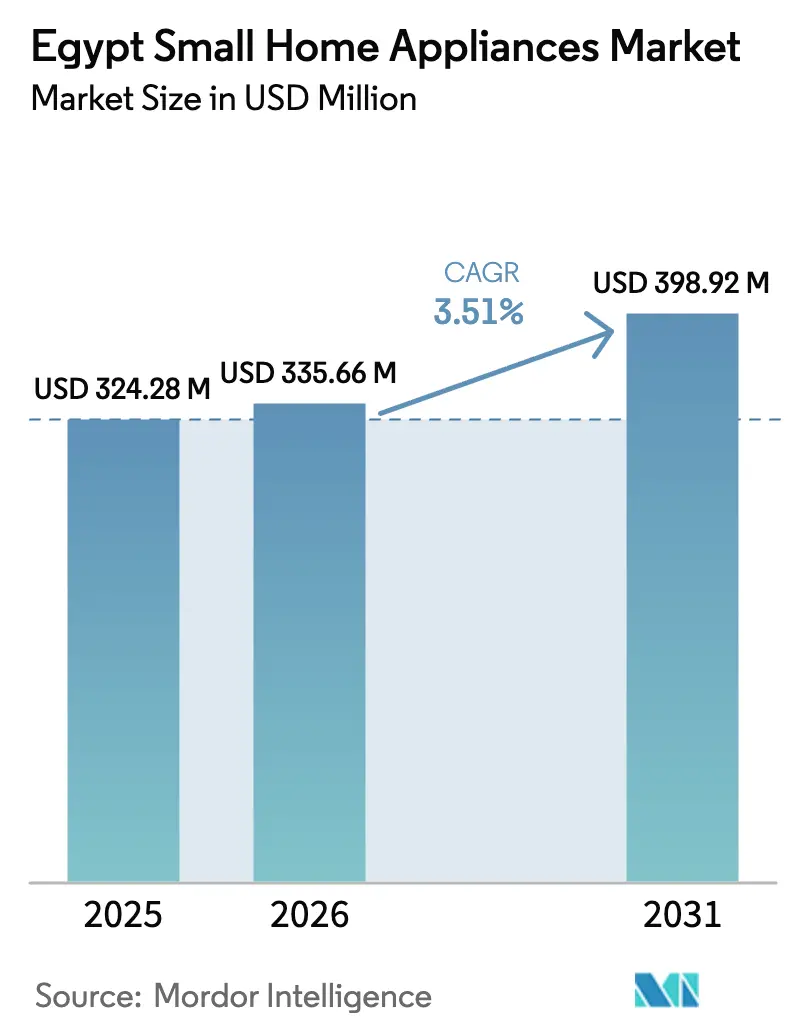
The Egypt small home appliances market size is expected to increase from USD 324.28 million in 2025 to USD 335.66 million in 2026 and reach USD 398.92 million by 2031, growing at a CAGR of 3.51% over 2026-2031. Policy support for localization, rising adoption of energy-efficient models, and the export orientation of new capacity expansions are shaping the competitive balance and long-term growth profile. The government is using golden licenses, tax holidays, and lower machinery import duties to anchor multinational production in Egypt, while also nudging manufacturers toward higher local-content thresholds. These incentives align to lower the national import bill and build a regional export base in Africa and the Middle East. Manufacturers are also incorporating inverter motors and higher-efficiency components to comply with labelling rules and to meet consumers’ need to manage electricity costs. Currency swings and elevated input costs remain headwinds, yet they reinforce the export case for locally made products and encourage more suppliers to qualify Egyptian component makers for regional value chains.
Key Report Takeaways
- By product type, juicers and blenders held 17.12% of the Egypt small home appliances market share in 2025, and air fryers are forecast to expand at a 4.12% CAGR through 2031.
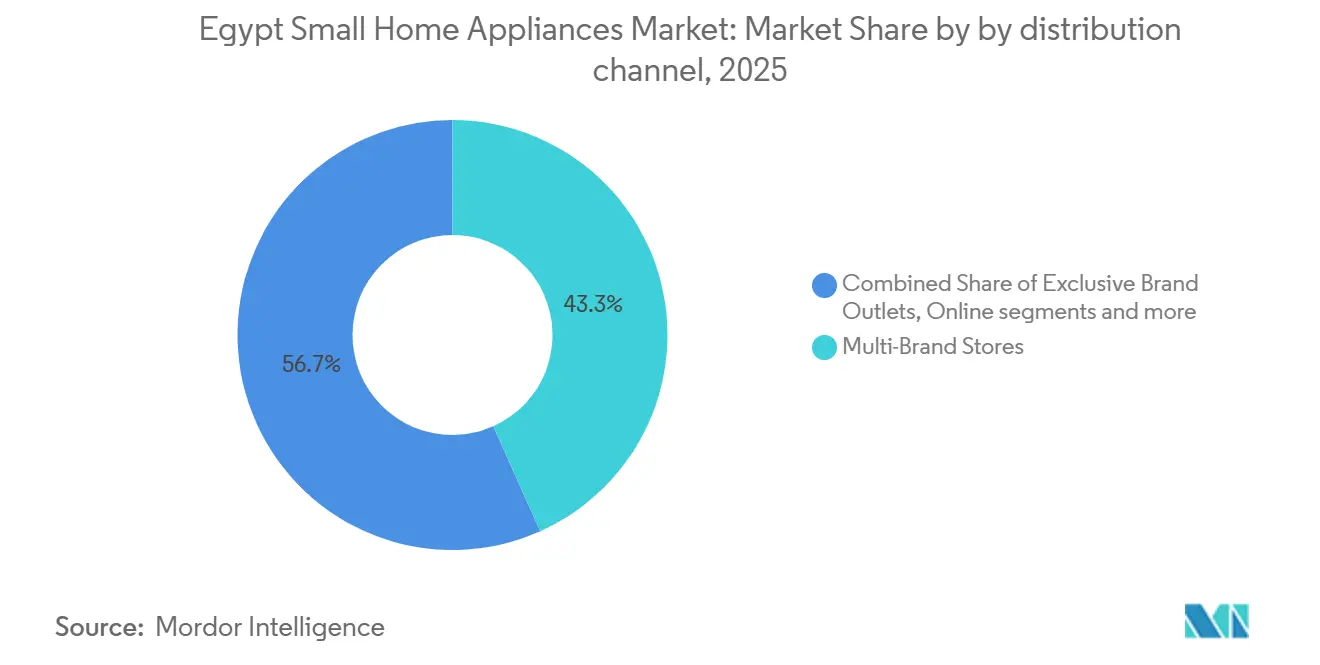
- By distribution channel, multi-brand stores accounted for 43.31% of the Egypt small home appliances market share in 2025, while online channels are projected to grow at a 4.83% CAGR during 2026–2031.
- By geography, Greater Cairo captured 39.13% of the Egypt small home appliances market share in 2025, and Alexandria and the Coastal Region are the fastest-growing areas at a 4.38% CAGR over 2026–2031.
Note: Market size and forecast figures in this report are generated using Mordor Intelligence’s proprietary estimation framework, updated with the latest available data and insights as of January 2026.
Market Trends and Insights
Drivers Impact Analysis of Egypt Small Home Appliances Market*
| Driver | (~) % Impact on CAGR Forecast | Geographic Relevance | Impact Timeline |
|---|---|---|---|
| Rising disposable income & urban migration | +0.9% | National, concentrated in Greater Cairo, New Administrative Capital, and New Alamein. | Medium term (2-4 years) |
| E-commerce proliferation and last-mile logistics maturity | +0.7% | National, strongest in Greater Cairo, Alexandria, and Delta cities, with fulfillment hubs | Short term (≤ 2 years) |
| Demand for energy-efficient devices amid rising power tariffs | +0.6% | National, early gains in new-city developments, including New Cairo and Sheikh Zayed | Medium term (2-4 years) |
| Government incentives for local assembly and component sourcing | +0.8% | National industrial zones, including 10th of Ramadan, 6th of October, Badr City, and Borg El Arab | Long term (≥ 4 years) |
| Buy-Now-Pay-Later and micro-credit penetration | +0.5% | National, the highest uptake in urban middle-income segments | Short term (≤ 2 years) |
| Expansion of rental housing and smaller household sizes are driving compact appliance demand | +0.6% | Urban centers nationwide, especially Greater Cairo, Alexandria, Giza, and emerging mixed-use developments | Medium term (2–4 years) |
| Source: Mordor Intelligence | |||
Rising Disposable Income & Urban Migration
Egypt is experiencing sustained urbanization, with around 43% of the population living in urban areas and the share continuing to rise as internal migration channels households toward cities such as Greater Cairo and Alexandria, where income opportunities are stronger[1]. Urban migration is increasingly concentrated in planned new cities, including the New Administrative Capital, New Cairo, and New Alamein, which are designed around reliable power supply, fibre connectivity, and modern residential infrastructure. These developments favour compact apartment layouts and standardized kitchen fit-outs, accelerating demand for space-saving, efficient small home appliances. Developers and homebuilders in these zones act as early catalysts for appliance adoption, particularly for energy-efficient and premium models suited to smaller footprints. In parallel, concentrated urban housing pipelines strengthen after-sales networks for installation, maintenance, and spare parts, improving product lifetime value and supporting faster replacement cycles and higher-spec appliance uptake across core metropolitan and satellite urban markets.
E-commerce Proliferation and Last-Mile Logistics Maturity
Egypt’s e‑commerce market reached approximately EGP 60 billion (USD 1.18 billion), with 21,800 businesses operating online, representing roughly 14.9% of total national revenue[2]. Online channels increasingly offer integrated payment solutions, installment options, and next-day or same-day delivery in major cities, expanding access to a broader SKU range, including mid-tier and premium small appliances, for time-constrained households. Fintech partnerships have reduced checkout friction, with licensed consumer-finance providers reporting strong adoption and higher transaction volumes for electronics and household devices in 2024. Consumer finance platforms and retail apps allow buyers to spread payments over 6 to 24 months, encouraging upgrades to higher-quality models. Omnichannel retailers leverage store networks as micro-fulfillment hubs, enabling click-and-collect services and faster returns, improving overall customer satisfaction, while ongoing logistics and payment innovations continue to drive growth in Egypt’s small home appliances market.
Demand for Energy-Efficient Devices Amid Rising Power Tariffs
Energy-efficiency standards and labelling requirements are now mandatory for many household categories, signalling a clear policy path toward lower device-level electricity consumption. Manufacturers respond by adding inverter motors, brushless DC components, and redesigned control software to improve kilowatt-hour usage profiles and qualify for higher efficiency classes. The labelling regime gives retailers and buyers a transparent yardstick for comparing performance, which supports premium pricing for compliant models and improves sell-through of newer SKUs. Independent test bodies accredited in Egypt report increased certification requests for higher-efficiency classes, reflecting both compliance and consumer demand. Programs linked to green financing have supported factory retrofits that cut energy use in production, and those investments also translate into product-level efficiency upgrades that meet regulatory targets.
Government Incentives for Local Assembly and Component Sourcing
Golden licenses, multi-year corporate tax exemptions, and reduced customs duties on production machinery lower initial costs and shorten time-to-market for both multinational and local players. The incentive framework includes geographic tiers that award higher deductions in designated zones, which encourages dispersion of factories into industrial cities outside central Cairo. Tariff policy distinguishes between CKD kits, subassemblies, and finished goods, which rewards projects that increase local content through supplier qualification programs. Administrative streamlining and unified approval tracks have improved visibility for investors on plant commissioning timelines. These measures collectively reinforce a structural localization shift that sustains component sourcing in Egypt and supports the export positioning of the Egypt small home appliances market.
Restraints Impact Analysis of Egypt Small Home Appliances Market*
| Restraint | (~) % Impact on CAGR Forecast | Geographic Relevance | Impact Timeline |
|---|---|---|---|
| High inflation and Egyptian pound depreciation | -1.2% | National, acute pressure on lower-income households nationwide | Short term (≤ 2 years) |
| Import-linked supply-chain volatility | -0.5% | National, significant for manufacturers reliant on imported components | Medium term (2-4 years) |
| Rising electricity prices are reducing discretionary appliance purchases | -0.6% | National, with a stronger impact in urban and peri-urban residential areas | Medium term (2–4 years) |
| Limited consumer access to after-sales service and spare parts outside major cities | -0.4% | Secondary cities and rural governorates, including Upper Egypt and frontier regions | Medium term (2–4 years) |
| Source: Mordor Intelligence | |||
High Inflation and Egyptian Pound Depreciation
Macroeconomic pressures reduce discretionary budgets for non-essential devices, increasing price sensitivity and extending replacement cycles in the mass market. Inflation in household furnishings and equipment remained elevated in late 2025, which pushed retailers to recalibrate pricing and promotions to sustain footfall. Volatility in exchange rates and commodity prices raises input costs for copper, sheet metal, and electronics, and not all manufacturers can hedge or absorb those hikes. Brands with global procurement networks have more levers to manage input volatility, while local producers lean on tactical discounts when demand softens. The resulting bifurcation favors premium energy-efficient SKUs for affluent buyers and slows mid-range adoption among price-sensitive segments.
Import-Linked Supply-Chain Volatility
A sizable share of key inputs still comes from overseas suppliers, which exposes local factories to freight rerouting, port congestion, and longer lead times during regional disruptions. Shipping adjustments in 2024 and 2025 lengthened delivery times from Asian hubs to Egyptian ports, raising landed costs and forcing higher safety stock levels of critical components. Certification and testing queues increased at labs, adding clearance days that tie up working capital and delay market entry for updated models. Manufacturers have responded by establishing dual sourcing for non-critical inputs and by validating Egyptian vendors for packaging, harnesses, and simple assemblies. These mitigations reduce exposure but still carry higher carrying costs, compressing operating margins in the Egyptian small home appliances market during volatile periods.
*Our forecasts treat driver/restraint impacts as directional, not additive. The impact forecasts reflect baseline growth, mix effects, and variable interactions.
Egypt Small Home Appliances Market Segment Analysis
By Product Type:
Category Leadership Masks Divergent Growth TrajectoriesJuicers and blenders accounted for 17.12% of 2025 revenues, reflecting broad use across income tiers and a clear path to upgrades to higher-wattage or multi-attachment models in the Egyptian small home appliances market. Air fryers are the fastest-growing category, with a 4.12% CAGR through 2031, supported by healthy cooking preferences, rapid adoption of air-fryer technology, and frequent retail promotions on 3.5-to-12-liter units. Retailers list entry- and mid-range models across multiple brands, and the mix spans preset menus, digital controls, and larger baskets suited to family-size preparation. Coffee makers, kettles, and food processors remain day-to-day utility items for core kitchens, supported by price bands that enable step-ups within the same brand. Vacuum cleaners are split into barrel and upright models for traditional needs, and cordless stick or robotic units that meet apartment storage and convenience requirements.
The range of price points and the accessories ecosystem drive configuration choices as buyers weigh counter space, functionality, and durability in the Egyptian small home appliances industry. Category leaders expand attachment bundles for processors and blenders, while budget brands focus on simple, repairable designs to maintain affordability. Retailers also leverage bundles that pair a blender with a processor or pair kettles with toasters, creating value packs that lift sell-through when promotions run. Merchant assortment strategies reflect seasonal peaks in fans and heaters, and longer-cycle purchases in kitchen prep categories, while managing inventory by region and season. Category fragmentation presents room for brand differentiation, and robust after-sales support encourages repeat purchases and upgrades over time.


By Distribution Channel:
Online Gains Belie Brick-and-Mortar’s Enduring GripMulti-brand stores accounted for 43.31% of the market in 2025 by offering hands-on product trials and immediate fulfillment, which remain attractive to appliance buyers who value touch and feel in the Egyptian small home appliances market. Retailers deploy experiential zones for key categories and offer store-based finance options, extended warranties, and product demos that move shoppers through the funnel. Exclusive brand outlets reinforce engagement by showcasing new lines and by cross-selling complementary SKUs and service plans at the point of sale. Online channels are projected to grow at a 4.83% CAGR through 2031, driven by integrated payments, last-mile delivery in major cities, and deeper SKU visibility across price bands. Consumer-finance partners and retail apps are lifting conversion and basket sizes online, and omnichannel operations link stores and digital platforms for flexible fulfillment.
Outside Greater Cairo and Alexandria, delivery surcharges and multi-day windows temper online adoption, preserving the role of independent bazaars and regional chains in the Egyptian small home appliances market. Retailers use store networks to reach areas where cash is preferred, and they maintain relationships with local installers and servicers to keep after-sales costs predictable. Enterprise buyers in hospitality and healthcare channels procure small appliances in bulk and sign service agreements that smooth revenue, particularly for coffee machines, kettles, and vacuums. Across channels, retailer and brand data sharing is improving assortment decisions and price positioning by region and store format. Tighter controls on quality and certifications also benefit organized retail, deepening trust and reducing returns in categories where brand authenticity matters.
Geography Analysis
Greater Cairo captured 39.13% of 2025 revenues due to its scale, density of retail locations, and concentration of appliance manufacturing footprints, which together create an integrated production and sales hub for the Egyptian small home appliances market. New-city housing around the capital is driving demand for compact, energy-efficient appliances, including built-in and slimline options that suit smaller kitchen footprints. Factory commissioning and supplier qualification are often staged in industrial cities near Cairo, enabling faster time-to-market and stronger after-sales coverage. Export-focused capacity additions by multinationals operating in Egypt also coordinate with capital-region logistics and distribution nodes. Capital-area buyers adopt premium devices at higher rates, which supports the introduction of new features and connected functions ahead of the national average.
Alexandria and the Coastal Region are the fastest-growing areas, with a 4.38% CAGR through 2031, driven by port proximity, trade flows, and seasonal tourism that creates bulk demand for hospitality devices. Export activity and inbound components flow through coastal gateways, lowering transport costs for factories and distributors serving nearby markets. Seasonal outfitting of coastal residences and resorts drives sales of kettles, coffee makers, and vacuums during specific months, requiring dynamic inventory management. Coastal demand for premium energy-rated products trails the capital region, but product availability and retail footprint expansion are narrowing the gap. New investments across coastal industrial zones support additional assembly and component sourcing, serving both domestic and export channels.
The Nile Delta and the remaining governorates contribute steady demand through a mix of organized retail, independent outlets, and online platforms with longer delivery windows. Product selection aligns with income bands and with electrification and broadband availability, which influences the adoption of connected SKUs. Retailers position installer networks and service centres to build trust in areas where the used market and informal channels remain active. Seasonal sales patterns for climate-related products guide stock positioning and promotional calendars across the Delta and Upper Egypt. As logistics mature and regulated finance becomes more accessible, regional buyers gain entry to more brands and to installment plans that reduce upfront costs for mid-tier models.
Regulatory Landscape
Egypt's regulatory framework for small home appliances centers on safety and energy performance in EOS standards and labeling requirements. The EOS Energy Efficiency and Water Saving Unit issues energy labels for electrical appliances under energy labeling rules established by Ministerial Decree No. 171/2011, while import controls support market access.
Product safety is governed by Ministerial Decree No. 246/2025 enforces ES 1781:2025, aligned with IEC 60335-1:2020; Imported small appliances must comply with GOEIC's Verification of Conformity (VoC) program, including documentation and pre-shipment checks. In July 2026, TÜV Rheinland highlighted EOS updates including ES 1781:2025, with enforcement requirements commencing in August 2026, adding urgency to certificate management and lab readiness for importers and brands updating SKUs.
Value Chain Analysis
The value chain spans local manufacturing and assembly alongside imported components and finished goods, with localization to manage currency risk and qualify products for regional export channels. Upstream inputs include metals, plastics, packaging, electronics, and motors/compressors, with local producers increasing the share of domestically sourced parts where feasible. Integrated local platforms such as WAMCO (Hervy/Vidal/Bee Home) and TREDCO (PASSAP) illustrate the role of vertically integrated lines, with TREDCO reporting over 90% local component usage.
Midstream, capacity and capability upgrades shape competitive cost and lead times, highlighted by BSH's June 2025 commissioning of its first African production facility in 10th of Ramadan City with 350,000 units of annual capacity in cooking appliances. Compliance, testing, and certification sit as critical enablers between manufacturing and go-to-market due to EOS/GOEIC requirements, influencing time-to-launch for new models and revisions. Downstream, distribution remains anchored in multi-brand stores and organized retail, while e-commerce and fintech-linked installments broaden reach in major cities; after-sales service networks and spare-parts availability remain a constraint outside large urban centers, pushing brands to build partner service coverage and local spares stocking. Export orientation is increasingly embedded in the chain, and a February 2026 decree from the Ministry of Industry requiring verified carbon-emissions reports for exporters of energy-intensive products adds a new reporting layer for export-facing manufacturers.
Competitive Landscape
The competitive field is structured into three tiers: local-scale brands, multinational platforms, and specialist brands targeting niche categories in the Egyptian small home appliances market. Local champions leverage vertically integrated supply chains and contracted component output to supply multiple brands while also advancing their own product portfolios. Multinational manufacturers are accelerating a pivot to local assembly and content, working with Egyptian partners to qualify parts and to meet export content rules for regional trade agreements. Specialists tune portfolios for coffee preparation, kitchen prep, and compact cooking, often pairing innovation cycles with retail partnerships that widen physical and digital reach.
Multinational capacity additions provide a steady stream of export-ready volume and support domestic SKU breadth across price tiers. Multinational capacity additions provide a steady stream of export-ready volume and support domestic SKU breadth across price tiers. BSH opened its first African production site in 2025 with a 350,000-unit annual capacity focused on cooking appliances, and half of the output is designated for export to the Middle East, Africa, and beyond[3]. Beko began implementing an industrial park and export hub in Egypt, including ovens and refrigerators with meaningful export allocations, supported by third-party brand production. Electrolux confirmed its commitment to expanding operations in Egypt in 2025, positioning it for export growth and incremental market-share gains. These moves raise the export profile of Egypt-based plants and empower firms to adapt product portfolios to regional preferences while preserving duty advantages tied to local content.
Brand differentiation in premium and specialist niches is visible in coffee systems, kitchen processors, and connected housekeeping devices. Panasonic partnered with a smart-home distributor in late 2025 to bring IoT-enabled devices to Egypt, signaling demand for connected ecosystems that combine appliances with home-automation platforms[4]. Coffee device makers and kitchen system brands continue to update their portfolios, with accessory ecosystems and feature bundles driving step-ups from entry models. Samsung and other multinationals maintain capacity in adjacent categories and can move into select small-appliance lines as local partnerships and demand signals strengthen. These strategic moves broaden the feature set available to consumers and push category leaders to maintain a cadence of hardware and software upgrades.
Egypt Small Home Appliances Industry Leaders
-
Fresh Electric
-
Unionaire
-
LG Electronics
-
Samsung Electronics
-
Midea Group
- *Disclaimer: Major Players sorted in no particular order
Egypt Small Home Appliances Market Companies Covered in this Report
- Fresh Electric
- Unionaire
- LG Electronics
- Samsung Electronics
- Midea Group
- Bosch (BSH Home Appliances)
- Beko (Arçelik)
- Philips Domestic Appliances
- Black+Decker (Stanley Black & Decker)
- Panasonic Corporation
- Braun (De'Longhi Group)
- Electrolux AB
- Kenwood (De'Longhi Group)
- Tefal (Groupe SEB)
- Sharp Corporation
- Haier Smart Home
- Candy Hoover Group
- Ariston (Ariston Thermo)
- Hommer
- Geepas
Market Opportunities and Future Outlook
Localization-led manufacturing expansion creates whitespace for suppliers of higher-efficiency components and subassemblies that help brands meet labeling and safety compliance while improving cost resilience. Recent capacity and investment signals include BSH's June 2025 facility in 10th of Ramadan City (350,000 units annual capacity in cooking appliances, with export allocation) and Unionaire's December 2024 announcement of an EGP 6 billion investment in a new 100,000 sqm factory positioned as a manufacturing and export hub with operations scheduled for 2026. In parallel, the Ministry of Industry's February 2026 inspection of Fresh Home Appliances specialized facilities in 10th of Ramadan City (including a heater and thermostat facility with 4 million units annual capacity and a compressor factory producing 2.5 million units annually) underscores the scaling of locally made critical components that can shorten lead times and support broader product portfolios.
Product-led opportunities center on energy-efficient and increasingly connected features that translate into tangible consumer value amid electricity cost sensitivity, and on mid-income accessibility enabled by retail finance and omnichannel fulfillment. Named programs and company roadmaps reinforce this direction: Panasonic partnered with NexGen in late 2025 to expand IoT-enabled devices and associated service coverage, while LG's 2026 lineup announcements in Egypt point to continued feature upgrades in categories adjacent to small appliances that can pull through cross-category bundles and brand ecosystems. Export-driven investments also broaden the addressable opportunity for Egypt-based producers and their supplier bases, evidenced by Haier Egypt's plan to complete phase two of its 10th of Ramadan industrial complex by Q3 2026 and ELARABY's March 2026 five-year expansion plan in New Quesna Industrial City that targets higher local content ratios; together, these initiatives increase demand for locally qualified parts, accredited testing, and scalable after-sales support beyond Greater Cairo.
Recent Industry Developments in Egypt Small Home Appliances Market
- June 2026: ELARABY Group and Samsung Electronics advanced operations at their Kom Abu Radi production complexes in Beni Suef, with ongoing expansion to scale output for the Egyptian market and export channels. The government tour underscored policy support for localization and export-oriented manufacturing.
- June 2025: BSH commenced operations at its first African production facility in 10th of Ramadan City, with 350,000 units per year capacity for cooking appliances, signaling a tangible shift toward regionalized manufacturing and shorter supply chains.
- December 2024: Unionaire announced an EGP 6 billion investment in a new 100,000 square meter home appliances factory positioned as a manufacturing and export hub, with operations scheduled for 2026. The scale of the project strengthened the localization narrative and heightened the importance of domestically qualified component suppliers and service ecosystems.
Egypt Small Home Appliances Market Report Scope and Research Methodology
Market Definition and Coverage
For this report, the Egypt small home appliances market covers revenue from semi-portable or portable electric appliances mainly used on a countertop or tabletop to complete day-to-day household tasks, and it includes products used for cooking, food preparation, personal care, and floor care.
Scope exclusions: This sizing does not include large home appliances or built-in white goods, and it also excludes non-electric manual tools.
Segments Covered in This Report
- By Product Type
- Coffee Makers
- Food Processors
- Grills & Toasters
- Electric Kettles
- Juicers & Blenders
- Air Fryers
- Vacuum Cleaners
- Electric Rice Cookers
- Other Small Home Appliances
- By Distribution Channel
- Multi-Brand Stores
- Exclusive Brand Outlets
- Online
- Other Distribution Channels
- By Geography
- Greater Cairo
- Alexandria & Coastal Region
- Nile Delta
- Rest of Egypt
Data Sources, Market Sizing, and Validation
Desk Research
Desk work starts with mapping what gets sold in Egypt and how products flow from import to retail, so the scope stays consistent with what households actually buy. We used public and official sources such as Egypt CAPMAS for population and household indicators, the Central Bank of Egypt for inflation and exchange-rate context, and Egypt Customs and UN Comtrade for directionally checking appliance trade movements.
To turn these signals into usable sizing inputs, we also reviewed sources such as Egyptian Organization for Standardization and Quality and energy efficiency labeling related guidance, alongside company filings, distributor announcements, and retailer price listings to understand typical pricing ladders and assortment shifts. A paid subscription database for company financials and news was used selectively to validate major business moves and local revenue exposure for relevant participants. These desk sources are illustrative, and many other public materials were also used to collect data points, validate assumptions, and clarify gaps during the research.
Primary Interviews and Surveys
Primary work was used to check what households are buying now, which categories are growing faster, and how price increases are being passed through at retail. We spoke with a mix of manufacturers, importers, distributors, modern trade and traditional retail sellers, and service partners across key demand centers in Egypt so the model reflects real purchasing patterns and not only published statistics.
Distribution of primary research fieldwork respondents
| Company type | Respondent position |
|---|---|
| Top tier: 36% | CXOs: 13% |
| Mid tier: 45% | Functional/Unit leaders: 37% |
| Smaller Players: 19% | Managers: 50% |
Market-Sizing & Forecasting
Sizing was built using a top-down and bottom-up blend, where the top-down view starts from the addressable household demand pool in Egypt and then allocates spend into small appliance use cases that are commonly bought for countertop and portable use. To keep the totals realistic, selective bottom-up checks were added using category level pricing and volume logic (sampled average selling price by product type multiplied by estimated units sold through key channels), and then the model was adjusted when the two views did not line up.
A few practical inputs were treated as the main drivers, which is where desk findings and interviews came together. These include household formation and urban concentration (which influences ownership rates), appliance replacement cycles, price bands and promotion intensity across retail formats, the split between conventional and smart models, and import dependence for certain categories that makes pricing sensitive to currency moves. Forecasts were built using scenario analysis, where inflation, exchange rate pressure, and category mix shifts were varied around a base case, and then the final path was sanity checked with what interviewees expect for demand recovery and retail expansion. When category level data was incomplete, we filled gaps using proxy indicators like shelf-space presence and channel mix, followed by a conservative adjustment so a single missing variable could not overstate the total.
Data Validation & Update Cycle
Validation is done in layers so one data point does not drive the outcome. We compare modeled results against independent signals, such as trade direction, visible retail pricing movement, and the implied per-household spend, and then outliers are reviewed to see whether they came from a one-off event or a real shift.
Before sign-off, the model assumptions and calculations go through multi-step analyst reviews, and follow-up calls are triggered when an interview insight conflicts with desk indicators or when a large variance appears at a category level. Reports are refreshed annually, and interim updates are made when material events occur, such as major currency moves, policy changes affecting imports, or notable pricing shocks. Right before delivery, an analyst performs a final update pass so clients receive the latest view available.
Mordor Intelligence's Egypt Small Home Appliances Market Size Compared Against Other Published Estimates
Published market sizes for Egypt small home appliances can look far apart because the word "small" gets interpreted differently, and because some studies mix consumer appliances with adjacent electrical goods. Differences also come from how pricing is treated during inflationary periods and whether figures are reported at retail value versus ex-factory or import value.
The table shows a noticeable spread around the 2025 value, and in Mordor Intelligence's model the number is limited to semi-portable, countertop or tabletop electric appliances used for household tasks, rather than folding in major appliances or broader consumer electronics that can inflate totals. Another common gap driver is the handling of exchange rates and price progression, where some sources convert using a single annual rate or assume aggressive premiumization, while our assumptions were repeatedly checked with retailer price ladders and distributor feedback before they were applied in the forecast.
Benchmark comparison
| Source | Market Size | Gaps in Research Methodology |
|---|---|---|
| Mordor Intelligence | USD 0.32 B (2025) | |
| Industry Portal A | USD 1.83 B (2025) | Uses a much wider basket that likely blends small appliances with broader home appliances or other electrical categories, and it is less clear whether values are retail spend or a different pricing layer. |
| Market Bulletin B | USD 0.55 B (2025) | Appears closer to a small kitchen appliances view, which can exclude personal care and floor care items, and it may rely on a narrower channel set that misses informal retail and cross-region variations inside Egypt. |
Taken together, the comparison points back to scope boundaries, pricing layers, and currency timing as the main reasons totals do not match across publications. By keeping the scope tied to portable household task appliances and by pressure-testing the key inputs with channel checks, we end up with an estimate that is easier to replicate and track year to year.
Key Questions Answered in the Report
What is the current size and expected growth of the Egypt small home appliances market?
The market stands at USD 335.66 million in 2026 and is set to reach USD 398.92 million by 2031 at a 3.51% CAGR.
Which product categories lead and which are growing fastest in Egypt?
Juicers and blenders lead with 17.12% share in 2025, while air fryers are the fastest growing with a 4.12% CAGR through 2031.
How are distribution channels evolving for small appliances in Egypt?
Multi-brand stores remain dominant with a 43.31% share in 2025, and online channels are expanding at a 4.83% CAGR as payments and last-mile delivery improve.
What is the technology mix for small appliances in Egypt?
Conventional products represent 81.31% of 2025 volume, and smart or connected devices are set to grow at a 4.47% CAGR through 2031.
Which regions account for the greatest and fastest-growing demand?
Greater Cairo holds 39.13% of 2025 revenues, and Alexandria and the Coastal Region are the fastest-growing at a 4.38% CAGR.