
Edible Cutlery Market Size and Share
Market Overview
| Study Period | 2020 - 2031 |
|---|---|
| Market Size (2026) | USD 44.32 Million |
| Market Size (2031) | USD 67.53 Million |
| Growth Rate (2026 - 2031) | 8.79% CAGR |
| Fastest Growing Market | Asia-Pacific |
| Largest Market | North America |
| Market Concentration | Low |
Major Players *Disclaimer: Major Players sorted in no particular order Image © Mordor Intelligence. Reuse requires attribution under CC BY 4.0. | |
Edible Cutlery Market Analysis by Mordor Intelligence
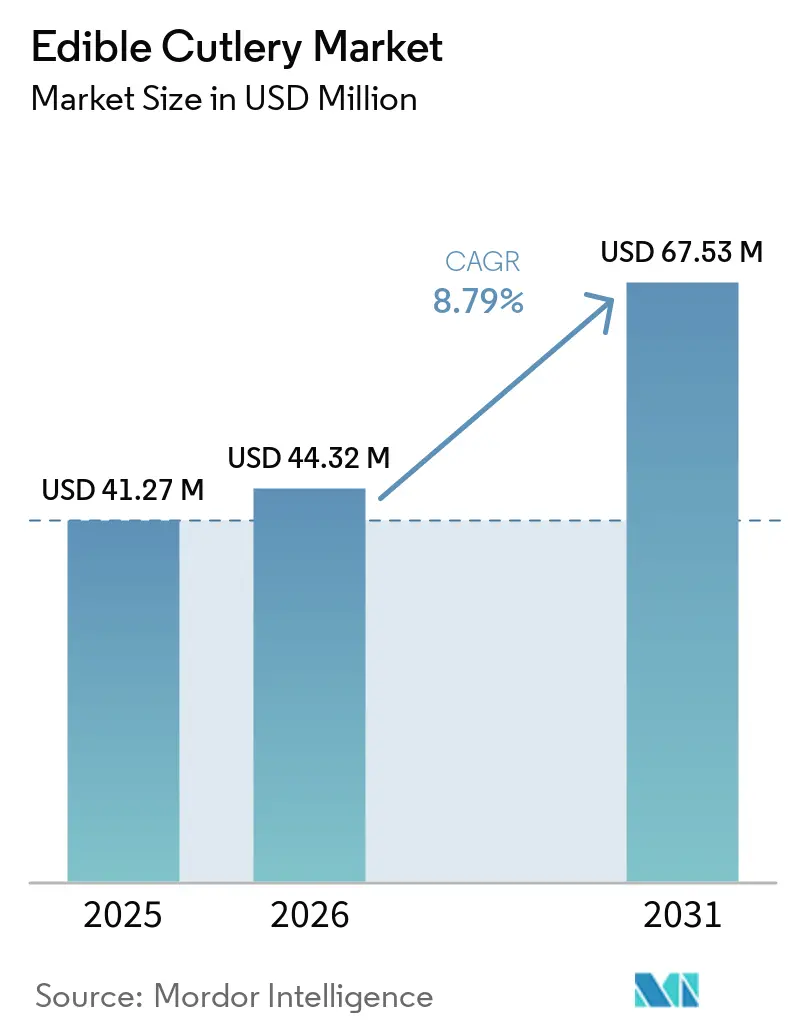
The edible cutlery market size is projected to be USD 41.27 million in 2025, USD 44.32 million in 2026, and reach USD 67.53 million by 2031, growing at a CAGR of 8.79% from 2026 to 2031. The edible cutlery market is still small within sustainable foodservice supplies, but demand is moving beyond novelty because it addresses both utensil use and post-use disposal in a single product format. The edible cutlery market is also gaining support from foodservice operators seeking to reduce plastic exposure, simplify waste handling, and offer a visible sustainability choice to consumers. The edible cutlery market benefits from tightening rules on single-use plastics, while product performance is improving through enhanced heat resistance, improved shelf-life management, and food-safety certifications [1]European Commission, “Single-Use Plastics Directive, Your Europe,” European Commission, europa.eu. The edible cutlery market remains fragmented, so competition depends less on scale today and more on formulation quality, certifications, and access to institutional buyers. The edible cutlery market also faces clear constraints from cost premiums and allergen management in grain-based formats, pushing suppliers to differentiate by material choice and compliance readiness[2]Johanna Mossburger and Katharina Anne Scherf, “Gluten Migration from Biodegradable Food Contact Materials Poses a Risk to Celiac Disease Patients,” European Food Research and Technology, springer.com.
Key Report Takeaways
- By product type, spoons led with 41.37% revenue share of the edible cutlery market in 2025, while sporks are projected to expand at a 9.21% CAGR through 2031.
- By material type, corn accounted for 44.69% share of the edible cutlery market size in 2025, while wheat is forecast to grow at a 9.62% CAGR through 2031.
- By end user, commercial accounted for 78.54% share of the edible cutlery market size in 2025, while residential is projected to advance at a 10.13% CAGR through 2031.
- By distribution channel, B2B accounted for 66.12% of the edible cutlery market share in 2025, while B2C channels recorded the highest projected CAGR of 9.77% through 2031.
- By geography, North America held 36.72% of the edible cutlery market share in 2025, while Asia-Pacific is forecast to grow at a 10.54% CAGR through 2031.
Note: Market size and forecast figures in this report are generated using Mordor Intelligence’s proprietary estimation framework, updated with the latest available data and insights as of January 2026.
Global Edible Cutlery Market Trends and Insights
Drivers Impact Analysis*
| Driver | (~) % Impact on CAGR Forecast | Geographic Relevance | Impact Timeline |
|---|---|---|---|
| Rising Environmental Consciousness and Plastic Avoidance in Foodservice | +2.1% | Global | Medium term (2–4 years) |
| Regulatory Bans and Procurement Rules on Single-Use Plastics | +2.5% | EU, India, North America | Short term (≤ 2 years) |
| Innovation in Heat-Resistant, Taste-Neutral Formulations | +1.4% | Global, led by EU & North America | Medium term (2–4 years) |
| Experiential Dining and Brand Differentiation in Quick Service and Premium Foodservice | +0.8% | North America, Europe | Long term (≥ 4 years) |
| Waste-Haul Cost Savings for High-Volume Foodservice Operators | +0.6% | North America, Australia | Medium term (2–4 years) |
| Corporate ESG and Scope 3 Packaging Substitution Programs | +0.9% | Global (MNE-heavy markets) | Medium term (2–4 years) |
| Source: Mordor Intelligence | |||
Rising Environmental Consciousness and Plastic Avoidance in Foodservice
The edible cutlery market is benefiting from a clear shift in foodservice purchasing, where operators now face greater pressure to reduce disposable plastic use in customer-facing formats. This shift matters because edible utensils remove waste at the point of use rather than sending it into a separate composting or collection stream. The edible cutlery market is therefore becoming relevant in dessert, snack, and catering formats where short contact time and consumer interaction support easier adoption. Operators also see value in solutions that make sustainability visible without adding sorting steps for staff or customers. This makes the edible cutlery market more attractive in chains and venues that want a clear plastic-reduction message built into the serving experience.
Regulatory Bans and Procurement Rules on Single-Use Plastics
The edible cutlery market continues to gain structural support from regulations that restrict or ban single-use plastic cutlery in major economies. EU rules have banned single-use plastic forks, knives, spoons, and chopsticks where sustainable alternatives are available, and the European Commission reported in April 2026 that several member states had already exceeded key collection targets under the broader directive framework. The edible cutlery market also benefits when public procurement and foodservice compliance policies favor lower-waste serving formats over conventional plastics. In the United States, food-contact substances still need to meet FDA safety expectations, which raises the bar for edible formats and favors suppliers with stronger documentation and testing[3]U.S. Food and Drug Administration, “Understanding How the FDA Regulates Substances That Come into Contact with Food,” U.S. Food and Drug Administration, fda.gov. This combination of restriction and qualification is helping the edible cutlery market move from an experimental category into a more formal procurement decision.
Innovation in Heat-Resistant, Taste-Neutral Formulations
The edible cutlery market is improving as suppliers work on formulations that remain stable in both hot and cold foods without affecting taste. FRENVI states that its EATlery products maintain shape for 40 to 50 minutes in hot dishes and 50 to 60 minutes in cold dishes, thereby expanding the practical use range for commercial service. The edible cutlery market is also benefiting from production technologies that improve consistency and throughput, including FRENVI’s CTC3DF process and Biotrem’s work on water-resistant bran-based products under the EU-backed Branbox project. A 2025 journal study on sorghum and flower-powder edible cutlery found acceptable structural integrity for 60 minutes with cold or dry food and 45 minutes with hot food or beverages, which supports the case for broader grain-based innovation. Better heat performance, cleaner flavor profiles, and more scalable processing are making the edible cutlery market more usable in everyday foodservice settings, rather than limited to narrow novelty formats.
Corporate ESG and Scope 3 Packaging Substitution Programs
The edible cutlery market is also supported by broader corporate packaging goals that aim to reduce plastic use and expand the use of recyclable, reusable, or compostable formats. PepsiCo’s packaging strategy continues to focus on reducing virgin plastic, increasing recycled content, and testing alternative delivery formats and materials, which reflects the broader shift in procurement expectations across food and beverage value chains[4]PepsiCo, “Packaging, ESG Topics,” PepsiCo, pepsico.com. That shift matters for the edible cutlery market because large operators increasingly ask suppliers to demonstrate how a product reduces waste and aligns with documented sustainability targets. The edible cutlery market has an advantage in situations where composting infrastructure is limited, and contamination concerns make other alternatives harder to manage. As a result, packaging and procurement programs that began with plastic reduction are expanding commercial opportunities for edible utensils in selected foodservice channels.
Restraints Impact Analysis*
| Restraint | (~) % Impact on CAGR Forecast | Geographic Relevance | Impact Timeline |
|---|---|---|---|
| Short Shelf Life and Moisture Sensitivity in Humid Climates | -0.8% | South/Southeast Asia, MEA | Short term (≤ 2 years) |
| Higher Unit Cost Versus Bamboo, Paper, and Compostable Alternatives | -1.1% | Global (price-sensitive markets) | Medium term (2–4 years) |
| Consumer Acceptance Limits from Taste, Texture, and Allergen Concerns | -0.6% | EU (celiac-aware markets), North America | Long term (≥ 4 years) |
| Cold-Chain-Style Storage and Packaging Requirements for Distributors | -0.5% | MEA, South America | Medium term (2–4 years) |
| Source: Mordor Intelligence | |||
Short Shelf Life and Moisture Sensitivity in Humid Climates
The edible cutlery market still faces a basic storage challenge because grain-based utensils can soften when exposed to high ambient moisture. FRENVI lists a minimum shelf life of 18 months for EATlery spoons under suitable storage conditions, indicating that performance depends heavily on proper dry handling and packaging discipline. This matters most in tropical and humid markets, where distributors and retailers may not consistently maintain the conditions needed for stable shelf life. The edible cutlery market, therefore, carries a packaging and logistics burden that does not affect conventional plastic cutlery in the same way. Until moisture protection becomes cheaper and more standardized, this issue will continue to limit penetration in some high-growth regions.
Higher Unit Cost Versus Bamboo, Paper, and Compostable Alternatives
The edible cutlery market remains under pressure from higher unit costs than bamboo, paper, and many compostable alternatives. Food-grade ingredients, baking intensity, tighter quality control, and protective packaging all raise the delivered cost of edible formats. The edible cutlery market is therefore easier to justify in premium, branded, or regulated use cases than in price-sensitive mass foodservice accounts. This cost gap is narrowing as automation improves, but buyers still compare edible utensils against cheaper substitutes that are already familiar and widely available. That keeps adoption strongest where brand value, waste reduction, or regulatory compliance can offset the premium.
*Our forecasts treat driver/restraint impacts as directional, not additive. The impact forecasts reflect baseline growth, mix effects, and variable interactions.
Segment Analysis
By Product Type: Spoons Anchor Volume, Sporks Signal Category Evolution
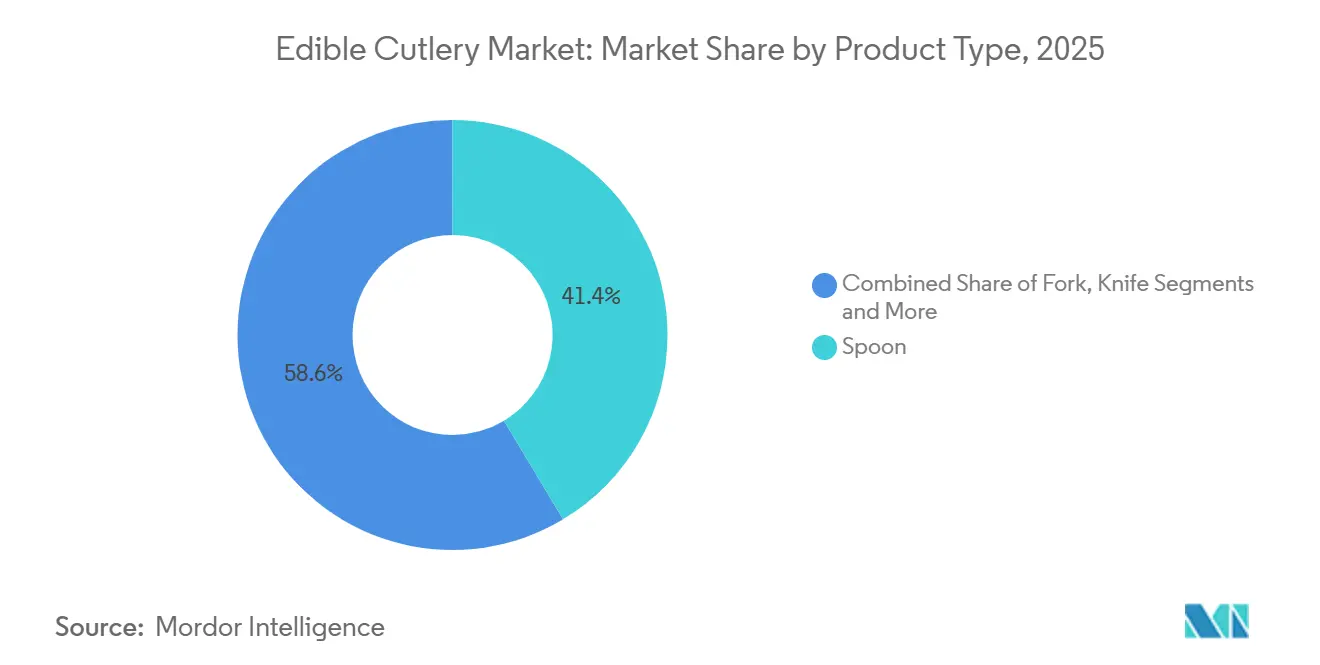
Spoons captured 41.37% of the edible cutlery market in 2025, which made them the largest product type in the category. Their lead reflects broad use across desserts, soft foods, beverage stirring, and catering formats where contact time is short, and product failure risk is lower. The edible cutlery market still depends heavily on these repeat-use occasions because they align well with the current performance limits of grain-based formulations. Forks and knives also participate in the category, but their adoption is more selective because food contact and load demands are higher in many meal settings.
Sporks are projected to grow at a 9.21% CAGR through 2031, making them the fastest-growing product type in the edible cutlery market. Their appeal lies in combining two functions into a single item, helping quick-service and fast-casual operators simplify inventory and service flow. The edible cutlery industry also has a localized opportunity in chopsticks, especially in East Asian foodservice formats where usage habits already support utensil specialization. Other product types, such as edible picks, stirrers, and small serving spoons, remain on a narrower scale but support experimentation in beverage, event, and premium hospitality formats.



By Material Type: Corn Leads, Wheat Bran Changes Material Positioning
Corn-based products accounted for 44.69% of the edible cutlery market in 2025, maintaining corn as the leading material base. Corn’s position reflects the wide availability of raw materials, a relatively neutral flavor profile, and a good fit with automated production methods for high-volume spoon output. The edible cutlery market also favors corn in many commercial contracts because the input system is easier to standardize at scale. This gives suppliers a practical route to consistency when buyers want stable taste, color, and structural performance.
Wheat is forecast to expand at a 9.62% CAGR through 2031, making it the fastest-growing material segment in the edible cutlery market. Bran-based formats can offer a denser structure and stronger liquid resistance, improving utility in foodservice use cases that require longer holding times. A 2024 study reported negligible gluten migration from a specific wheat-bran and PLA cutlery sample under short contact conditions. Still, it also highlighted weak allergen labeling on packaging, while a 2025 study showed that some wheat-based biodegradable tableware exceeded gluten-free thresholds and could swell when heated in contact with liquid. Rice, sorghum, and millet remain important to the edible cutlery industry because they broaden the material base and help suppliers address texture, nutrition, and allergen-related positioning.
By End User: Commercial Foodservice Holds Scale, Residential Builds a New Demand Layer
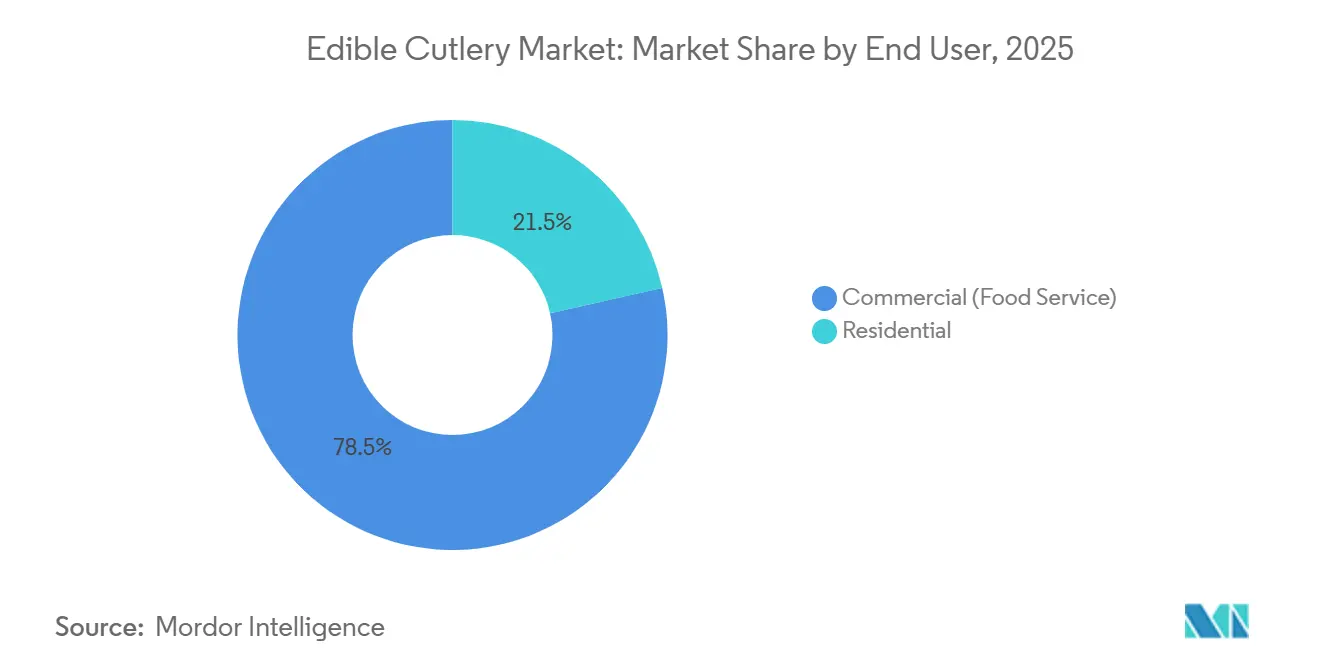
Commercial end users accounted for 78.54% of the edible cutlery market in 2025, making foodservice the core demand base. Hotels, restaurants, cafes, institutional canteens, transport catering, and event operators all contribute to this concentration because they buy in volume and can integrate new formats across many service occasions. The edible cutlery market is particularly suited to commercial settings where operators want a visible alternative to plastic and can manage storage, menu fit, and procurement terms in a structured way. These channels also help suppliers run larger orders, which supports production planning and certification investment.
Residential demand is forecast to rise at a 10.13% CAGR through 2031, making it the fastest-growing end-user segment in the edible cutlery market. Home use is expanding as online channels and sustainability-oriented retail packs make edible utensils easier to access outside institutional contracts. The edible cutlery market benefits from household demand for party packs, dessert occasions, and products that combine convenience with reduced waste and greater visibility. This segment remains smaller than commercial foodservice, but it offers a margin-supportive growth path as consumer familiarity improves.
By Distribution Channel: B2B Dominates Current Volumes, B2C Expands Reach
B2B channels accounted for 66.12% of the edible cutlery market in 2025, reflecting the category’s current dependence on institutional foodservice supply. Direct sales to operators and distributors remain central because they provide volume stability and allow suppliers to tailor specifications to moisture protection, pack size, and service conditions. The edible cutlery market still relies on these relationships to secure repeat orders from commercial buyers that need predictable product handling and food safety assurance. This channel also helps producers enter multiple sites or chains through fewer procurement decisions.
B2C channels are projected to grow at a 9.77% CAGR through 2031, making them the faster-growing route in the edible cutlery market. Online retail is the main driver because it enables direct-to-consumer brand building without relying on immediate shelf wins over cheaper alternatives. The edible cutlery industry is also being pushed to improve retail-ready packaging as more products move into consumer channels where durability, labeling, and presentation matter more. Over time, this shift should widen category awareness and give suppliers a broader demand base beyond foodservice contracts.
Geography Analysis
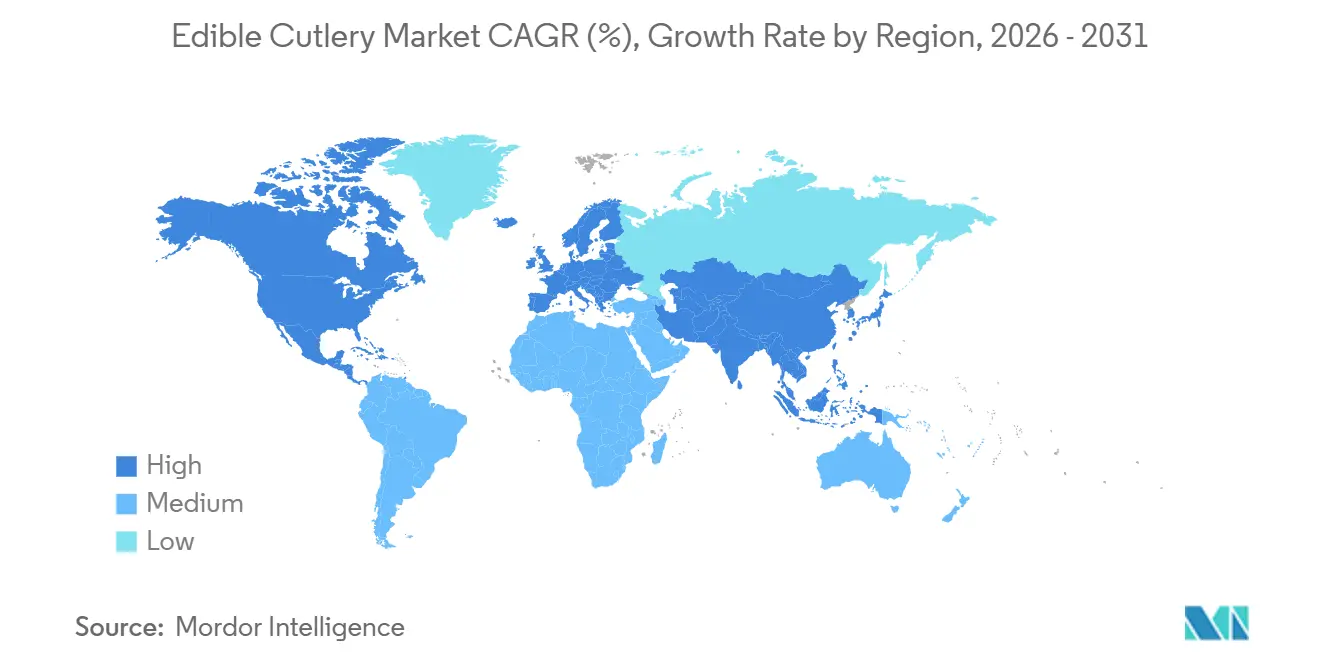
North America accounted for 36.72% of the edible cutlery market in 2025, making it the largest regional contributor. The region benefits from stronger procurement discipline in foodservice, visible pressure to reduce disposables, and municipal and institutional support for lower-waste serving systems. Denver’s zero-waste support program for foodservice providers reported that 27 participating businesses in 2024 prevented nearly 957,000 disposable items from being discarded each year, which shows how waste reduction is becoming tied to operating decisions at the local level. The United States remains the core demand center in the region, while Canada continues to expand the compliance backdrop for plastic substitution. South America remains smaller, but urban hospitality and delivery-linked foodservice formats are creating selective openings for premium sustainable utensils.
Europe remains one of the most policy-driven regions of the edible cutlery market because it faces the most regulatory pressure against single-use plastic cutlery. EU rules already ban single-use plastic cutlery where alternatives exist, and public awareness and procurement alignment around lower-waste service models further support the edible cutlery market in Europe. FRENVI’s Mannheim production plans and automated capacity buildout demonstrate that the region is adding local manufacturing capacity rather than relying solely on imports. Germany, France, and nearby wholesale-led markets are especially important because they combine sustainability-led demand with better distribution reach for certified products.
Asia-Pacific is projected to grow at a 10.54% CAGR through 2031, which makes it the fastest-growing geography in the edible cutlery market. The region’s growth is supported by rising pressure on plastic use, expansion in organized foodservice, and a strong manufacturing base for grain-based alternatives. The edible cutlery market in Asia-Pacific is also shaped by material availability, potential for lower-cost production, and growing interest in products that align with local grain inputs and changing consumer preferences. The Middle East and Africa remain smaller in size, but premium hospitality, aviation-linked catering, and urban sustainability programs create focused commercial opportunities where storage and logistics conditions can be managed.

Competitive Landscape
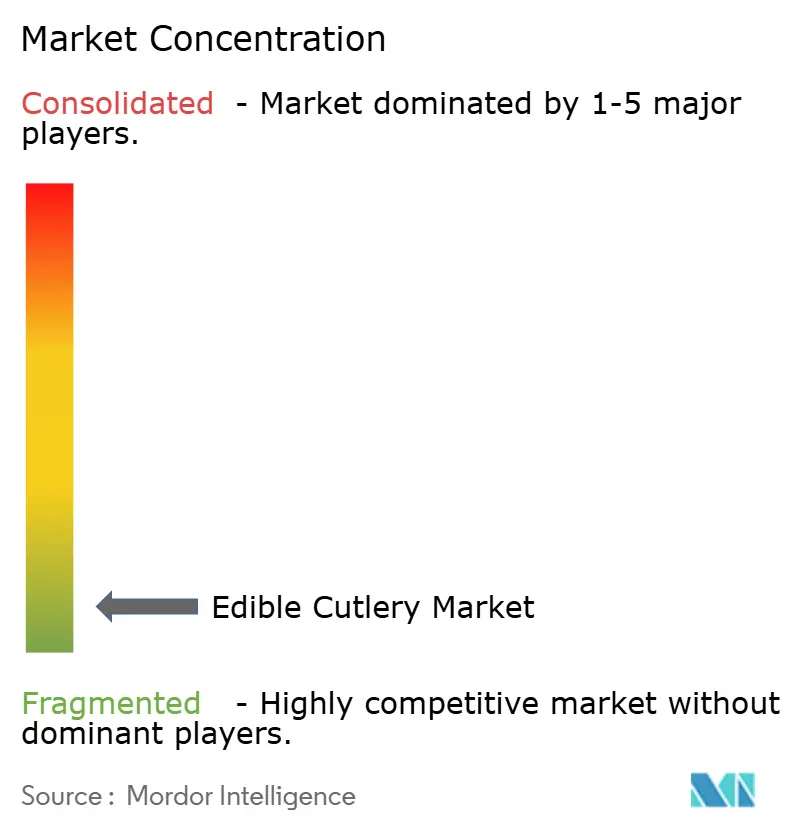
The edible cutlery market remains highly fragmented, and no single producer holds a dominant share. Competition centers on formulation quality, food safety certifications, packaging performance, and access to institutional buyers, rather than on market control by a few large firms. The edible cutlery market, therefore, rewards suppliers that can demonstrate stable product behavior, reliable shelf life, and compliance-readiness for commercial use. This structure keeps pricing pressure high at the lower end while allowing some premium positioning where operators value performance and sustainability signaling. It also means regional players can remain relevant if they align with local demand conditions and procurement needs.
FRENVI has taken one of the clearest strategic positions in the edible cutlery market through automation and certification-led scaling. The company states that it produces more than 1 million environmentally friendly products daily, operates from Bangalore, and opened a fully automated production facility in Mannheim in spring 2025, with further automated European capacity planned by early 2026. That move matters because it improves local supply to Europe and supports commercial accounts that require food safety documentation and dependable output. Suppliers that can pair throughput with certifications are likely to gain an advantage as buyers move from trial orders to routine procurement.
Biotrem represents another important model in the edible cutlery market because its bran-based technical approach focuses on water resistance and the use of agricultural by-products. The EU-backed Branbox project demonstrated the commercial relevance of water-resistant, edible, or biodegradable bran-based food-contact products, supporting a differentiated technology position for suppliers that use bran inputs. At the same time, allergen management is becoming a sharper competitive issue because published research has shown that gluten transfer and material swelling can create compliance concerns in some wheat-based biodegradable tableware applications. The edible cutlery market is therefore moving toward a more disciplined competitive phase where material choice, labeling quality, and use-case fit matter as much as sustainability messaging.
Edible Cutlery Industry Leaders
EdiblePRO
Spoontainable
Stroodles
Bakeys Foods Private Limited
Biotrem Sp. z o.o.
- *Disclaimer: Major Players sorted in no particular order

Recent Industry Developments
- April 2026: The European Commission published its first compliance report under the Single-Use Plastics Directive, confirming 10 EU member states have already met or exceeded the 2025 bottle-collection targets, reinforcing enforcement momentum for broader plastic substitution, including cutlery.
- March 2026: The Edible Cutlery brand (Western Australia) eliminated over 700,000 single-use disposable dessert spoons in two months across Yo-Chi's 50-store dessert chain network, one of the highest-density commercial deployments of edible cutlery reported in the Asia-Pacific foodservice sector and a proof-of-concept for high-frequency QSR-adjacent use cases.
- January 2026: FRENVI commissioned its second fully automated production facility in Mannheim, Germany, using a CTC3DF production line, marking the first purpose-built, automated edible cutlery factory in Central Europe and enabling direct-supply logistics for EU institutional clients.


Global Edible Cutlery Market Report Scope
| Spoon |
| Fork |
| Knife |
| Spork |
| Chopstick |
| Other Product Types |
| Corn |
| Wheat |
| Rice |
| Sorghum |
| Millet |
| Other Material Types |
| Residential | |
| Commercial | Hotels, Restaurants, and Cafes |
| Institutional Food Service | |
| Cinema, Airline, and Railway Catering | |
| Schools and Offices | |
| Hospitals | |
| Other Commercial End Users |
| B2C Channels | Hypermarkets and Supermarkets |
| Specialty Stores | |
| Home Centers | |
| Online | |
| Other Distribution Channels | |
| B2B Channels |
| North America | Canada |
| United States | |
| Mexico | |
| South America | Brazil |
| Peru | |
| Chile | |
| Argentina | |
| Rest of South America | |
| Europe | United Kingdom |
| Germany | |
| France | |
| Spain | |
| Italy | |
| BENELUX (Belgium, Netherlands, Luxembourg) | |
| NORDICS (Denmark, Finland, Iceland, Norway, Sweden) | |
| Rest of Europe | |
| Asia-Pacific | India |
| China | |
| Japan | |
| Australia | |
| South Korea | |
| South-East Asia | |
| Rest of Asia-Pacific | |
| Middle East & Africa | United Arab Emirates |
| Saudi Arabia | |
| South Africa | |
| Nigeria | |
| Rest of Middle East & Africa |
| By Product Type | Spoon | |
| Fork | ||
| Knife | ||
| Spork | ||
| Chopstick | ||
| Other Product Types | ||
| By Material Type | Corn | |
| Wheat | ||
| Rice | ||
| Sorghum | ||
| Millet | ||
| Other Material Types | ||
| By End User | Residential | |
| Commercial | Hotels, Restaurants, and Cafes | |
| Institutional Food Service | ||
| Cinema, Airline, and Railway Catering | ||
| Schools and Offices | ||
| Hospitals | ||
| Other Commercial End Users | ||
| By Distribution Channel | B2C Channels | Hypermarkets and Supermarkets |
| Specialty Stores | ||
| Home Centers | ||
| Online | ||
| Other Distribution Channels | ||
| B2B Channels | ||
| By Geography | North America | Canada |
| United States | ||
| Mexico | ||
| South America | Brazil | |
| Peru | ||
| Chile | ||
| Argentina | ||
| Rest of South America | ||
| Europe | United Kingdom | |
| Germany | ||
| France | ||
| Spain | ||
| Italy | ||
| BENELUX (Belgium, Netherlands, Luxembourg) | ||
| NORDICS (Denmark, Finland, Iceland, Norway, Sweden) | ||
| Rest of Europe | ||
| Asia-Pacific | India | |
| China | ||
| Japan | ||
| Australia | ||
| South Korea | ||
| South-East Asia | ||
| Rest of Asia-Pacific | ||
| Middle East & Africa | United Arab Emirates | |
| Saudi Arabia | ||
| South Africa | ||
| Nigeria | ||
| Rest of Middle East & Africa | ||


Key Questions Answered in the Report
What is the projected value of the edible cutlery market by 2031?
The edible cutlery market is projected to reach USD 67.53 million by 2031, rising from USD 44.32 million in 2026 at an 8.79% CAGR.
Which region currently leads edible cutlery demand?
North America led with 36.72% share in 2025, supported by stronger foodservice procurement systems and visible pressure to reduce disposable waste.
Which region is expected to grow the fastest through 2031?
Asia-Pacific is forecast to expand at a 10.54% CAGR through 2031, ahead of all other regions in the report.
Which product category leads current sales?
Spoons were the leading product type in 2025 with 41.37% share because they fit dessert, beverage, and short-contact foodservice use cases well.
Why are commercial buyers still the main demand base?
Commercial end users accounted for 78.54% in 2025 because restaurants, cafes, institutions, and transport catering buy in bulk and can integrate edible utensils into procurement systems.
Page last updated on:






