
Market Overview
| Study Period | 2021 - 2031 |
|---|---|
| Forecast Data Period | 2026 - 2031 |
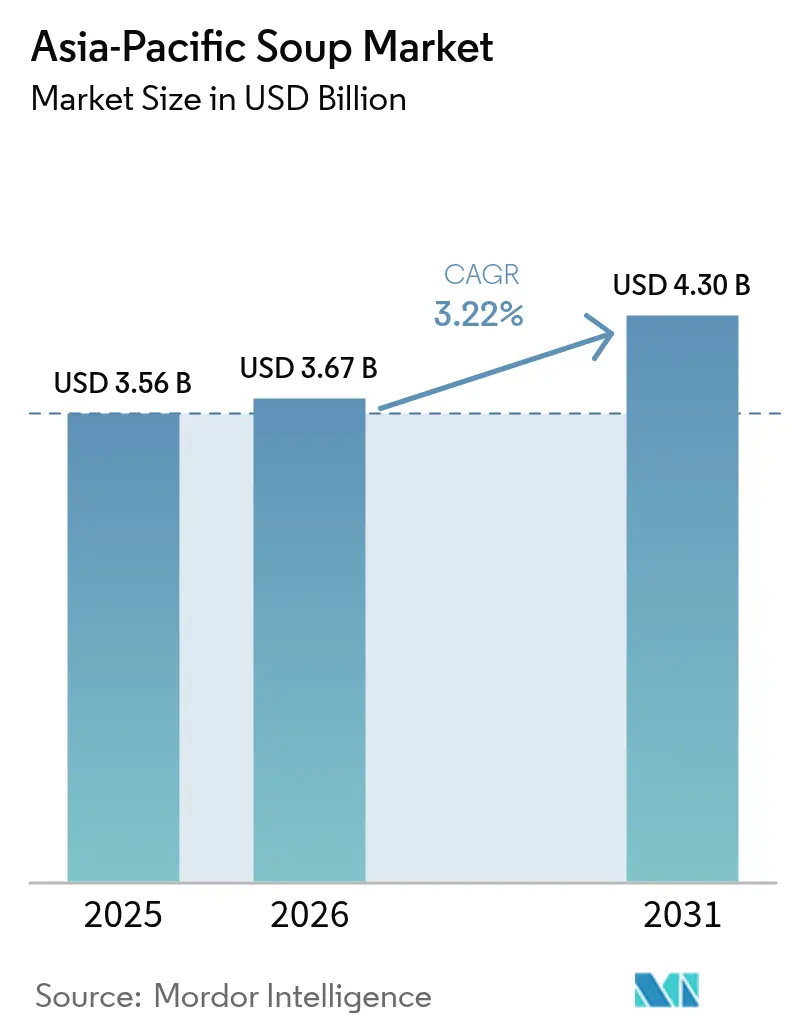
| Base Year Market Size (2025) | USD 3.56 Billion |
| Market Size (2026) | USD 3.67 Billion |
| Market Size (2031) | USD 4.3 Billion |
| Growth Rate (2026 - 2031) | 3.22 % |
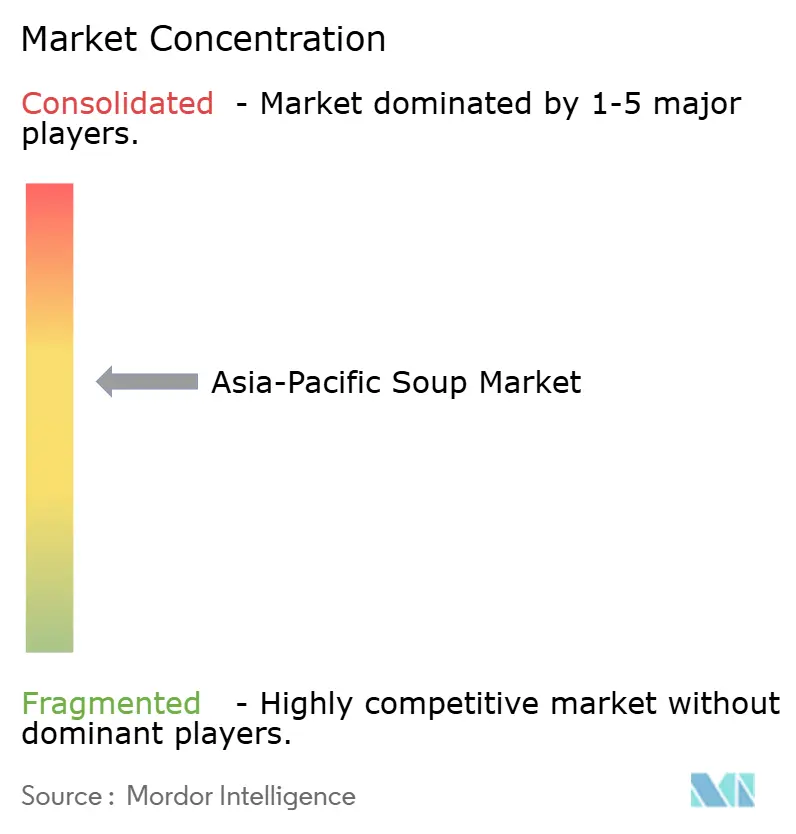
| Market Concentration | Medium |
Major Players
*Disclaimer: Major Players sorted in no particular order Image © Mordor Intelligence. Reuse requires attribution under CC BY 4.0. |
|
Asia-Pacific Soup Market Analysis by Mordor Intelligence
The Asia-Pacific soup market size in 2026 is estimated at USD 3.67 billion, growing from 2025 value of USD 3.56 billion with 2031 projections showing USD 4.3 billion, growing at 3.22% CAGR over 2026-2031. This measured pace masks a structural shift as urbanization, aging demographics, and cold-chain modernization converge to reshape consumption patterns across the region. Shelf-stable soup commands 44.72% of 2024, yet chilled soup is projected to grow at 4.21% annually through 2030, reflecting rising consumer willingness to pay premiums for fresh-ingredient formats when infrastructure permits. China holds 38.04% of regional demand in 2024, but India's 4.29% CAGR signals a pivot toward markets where nuclear families and dual-income households are normalizing ready-to-eat meals. Shelf-stable formats dominate today, yet chilled lines are advancing as retailers widen refrigerated shelf space, while vegetarian variants outpace meat-based recipes on the back of plant-forward lifestyles. Packaging upgrades, from recyclable retort pouches to lightweight spouted packs, are closing the performance gap between ambient and fresh products, opening headroom for premium price points. Competitive intensity is rising as multinational incumbents localize flavors and regional specialists lean on viral trends, prompting broader adoption of sustainable materials and extended-shelf-life technologies.
Key Report Takeaways
- By product type, shelf-stable soup held 44.32% of the soup market share in 2025.
- Chilled soup is forecast to grow at a 4.03% CAGR through 2031, the fastest among product types.
- By category, vegetarian soup accounted for 52.80% of the soup market size in 2025 and is set to expand at a 3.65% CAGR to 2031.
- By packaging, pouches led with 48.05% revenue share in 2025, while canned formats recorded the highest projected CAGR at 4.91% through 2031.
- By distribution, supermarkets and hypermarkets contributed 52.00% of the 2025 value; online retail is projected to grow at 4.56% annually to 2031.
- By geography, China contributed 37.60% of the 2025 value; online India is projected to grow at 4.12% annually to 2031.
Note: Market size and forecast figures in this report are generated using Mordor Intelligence’s proprietary estimation framework, updated with the latest available data and insights as of 2026.
Market Trends and Insights
Drivers Impact Analysis of Asia-Pacific Soup Market*
| Driver | (~) % Impact on CAGR Forecast | Geographic Relevance | Impact Timeline |
|---|---|---|---|
| Rising urbanization and busy lifestyles drive demand for ready-to-eat soups | +0.8% | China, India, Indonesia, Vietnam, Philippines | Medium term (2-4 years) |
| Growing health consciousness boosts nutritious soup consumption | +0.6% | Global, with early gains in Japan, South Korea, Singapore | Short term (≤ 2 years) |
| Innovation in packaging and formats increases market appeal | +0.4% | Global, led by Japan, South Korea, Australia | Medium term (2-4 years) |
| Flavor localization attracts regional taste preferences | +0.3% | China, India, Thailand, Indonesia, Malaysia | Short term (≤ 2 years) |
| Rising interest in plant-based and vegetarian soups | +0.5% | India, Indonesia, Thailand, and urban China | Medium term (2-4 years) |
| The expansion of modern retail and supermarkets increases availability | +0.7% | Vietnam, India, Indonesia, China, tier 3-4 cities | Short term (≤ 2 years) |
| Source: Mordor Intelligence | |||
Rising Urbanization and Busy Lifestyles Drive Demand for Ready-to-Eat Soups
Asia-Pacific's urban population reached 2.5 billion in 2023 and is projected to climb to 3.4 billion by 2050, compressing meal-preparation windows for dual-income households and spurring adoption of convenience formats [1]Source: United Nations, "Population Division", un.org. In China, packaged-food volume grew in 2024 even as average selling prices declined 3.6%, signaling that consumers are trading up in unit count rather than premium tiers when time constraints bind. India's quick-commerce grocery segment grew in 2024, with ready-to-eat meals comprising a disproportionate share of basket value because 10-minute delivery windows favor shelf-stable or ambient products. Japan's labor shortages are accelerating food-service automation, exemplified by Connected Robotics' Delibot ramen vending machine, which indirectly legitimizes at-home instant formats by normalizing robotic meal assembly. Vietnam's modern-retail footprint expanded to 3,700 WinCommerce stores by end-2024, targeting 4,000 by the year-end 2025, while Thailand's Tops chain aims for 1,000 outlets by 2027, both anchoring ready-to-eat aisles as traffic drivers.
Growing Health Consciousness Boosts Nutritious Soup Consumption
As per studies, Asia-Pacific consumers found maximum priority for health and well-being in purchase decisions, with functional foods projected to grow annually through 2030. Japan's instant-soup market is projected to grow, driven by aging consumers seeking high-protein, low-sodium options that align with government dietary guidelines. Nissin expanded its KANZEN MEAL cup-type soup series in 2024, fortifying formulations with collagen and vitamins to target the over-65 demographic, which will comprise 30% of Japan's population by 2030. Acecook Vietnam launched DALAGO vegetable-fortified noodles in August 2025, embedding carrot, spinach, and pumpkin powders to address micronutrient deficiencies in rural provinces. South Korea's Nongshim introduced a reduced-sodium Shin Ramyun variant in 2024, cutting salt content by 20% while maintaining umami depth through fermented soybean extracts, a reformulation that mirrors broader industry efforts to preempt regulatory sodium caps.
Innovation in Packaging and Formats Increases Market Appeal
Retort-pouch technology is enabling ambient distribution of premium broths and chilled-style soups without cold-chain dependency. Tetra Pak's Tetra Recart carton, which withstands 121°C sterilization, is gaining traction among Southeast Asian co-packers seeking to differentiate shelf-stable offerings with a fresh-like appearance. SIG introduced spouted pouches with in-line sterilization in 2024, reducing packaging weight by 30% versus cans while maintaining 18-month shelf life, a format that lowers freight costs for exporters targeting Australia and New Zealand. Amcor's recyclable retort pouch, commercialized in 2024, uses mono-material polyethylene that can be processed in existing film-recycling streams, addressing regulatory pressure in Japan and South Korea, where extended producer responsibility mandates take effect in 2026. Pakka's compostable flexible packaging, certified to EN 13432, is being piloted by Indian ready-meal brands seeking to align with the Ministry of Environment's single-use plastic phase-out, which bans polystyrene foam cups and non-compostable multilayer films from January 2026. These advances are compressing the performance gap between chilled and shelf-stable formats, allowing manufacturers to premiumize ambient SKUs and capture margin that historically accrued only to refrigerated lines.
Rising Interest in Plant-Based and Vegetarian Soups
India's vegetarian-soup segment is expanding at 3.78% CAGR through 2030, propelled by a confluence of religious dietary norms, rising disposable incomes, and Ayurvedic wellness trends that position lentil and vegetable broths as functional foods [2]Source: OECD-FAO, "OECD-FAO Agricultural Outlook 2024-2033", oecd.org. Agricultural Outlook. Nestlé Malaysia launched HARVEST GOURMET plant-based puff pastries in April 2024, featuring three Asian-inspired fillings, rendang, curry, and tom yam, that signal the company's intent to extend meat-analog platforms into adjacent snacking and meal categories. Ajinomoto Philippines introduced frozen gyoza, karaage, and instant-soup options under its ready-to-eat portfolio in March 2025, with vegetarian variants accounting for 40% of the initial SKU assortment to capture flexitarian households. Acecook Vietnam's DALAGO line, launching in August 2025, embeds vegetable powders directly into noodle dough, a manufacturing pivot that differentiates the product from competitors who rely on separate seasoning sachets and appeals to parents seeking nutrient-dense convenience meals for children. Indonesia's halal-certification requirements are inadvertently accelerating plant-based innovation, as manufacturers reformulate broths to eliminate animal-derived enzymes and gelatin, creating formulations that satisfy both religious and vegan consumers without SKU proliferation.
Restraints Impact Analysis of Asia-Pacific Soup Market*
| Restraint | (~) % Impact on CAGR Forecast | Geographic Relevance | Impact Timeline |
|---|---|---|---|
| Preference for traditional home-cooked meals limits packaged soup demand | -0.5% | India, China, Indonesia, Philippines, Vietnam | Long term (≥ 4 years) |
| Perceived processed-food stigma deters health-conscious buyers | -0.3% | China, Japan, Singapore, and urban India | Short term (≤ 2 years) |
| Raw-material price volatility squeezes manufacturer profit margins | -0.4% | Global, acute in palm-oil dependent markets | Short term (≤ 2 years) |
| Shelf-life and preservation challenges for fresh-ingredient soups | -0.2% | Southeast Asia, tropical regions with a limited cold chain | Medium term (2-4 years) |
| Source: Mordor Intelligence | |||
Preference for Traditional Home-Cooked Meals Limits Packaged Soup Demand
Multi-generational households remain prevalent across India, Indonesia, and the Philippines, where cultural norms assign meal preparation to elder family members and packaged formats carry connotations of neglect or lower social status. A 2024 study of eating patterns in Singapore, Indonesia, and Malaysia found that while purchased-food penetration approaches 50% in Singapore, it remains below 30% in Jakarta and Kuala Lumpur, with soups and stews the least likely category to be outsourced because broth-making is viewed as a culinary skill marker. China's 2024 shopper report noted that offline grocery channels grew while e-commerce declined, the first contraction on record, suggesting that consumers are reverting to wet markets and fresh-ingredient purchases as pandemic-era delivery habits fade. India's quick-commerce platforms are responding by offering recipe kits with pre-portioned fresh vegetables and spice blends, effectively competing with packaged soups by reducing prep time without sacrificing the perception of home cooking. Vietnam's Acecook is countering this restraint by positioning instant noodles as a base ingredient rather than a complete meal, publishing recipes that incorporate fresh herbs, proteins, and vegetables, thereby blurring the boundary between convenience and scratch cooking.
Raw-Material Price Volatility Squeezes Manufacturer Profit Margins
Palm-oil prices rose 6% year-on-year in 2024, driven by Indonesian export restrictions and El Niño-induced yield declines, while rice prices fell 28.5% due to record Indian harvests, creating margin pressure for manufacturers who cannot pass through cost increases uniformly across SKUs [3]Source: FAO Food Outlook, "FAO REGIONAL WORKSHOP ON PESTICIDE RESIDUE RISK ASSESSMENT AND THE ELABORATION OF CODEX MAXIMUM RESIDUE LIMITS", openknowledge.fao.org. Fertilizer costs remain elevated relative to pre-2022 levels, compressing returns for vertically integrated producers like Indofood, which sources wheat and palm oil from captive plantations. Nongshim's September 2024 announcement of a USD 143 million export-dedicated factory in Busan, with 500 million pack annual capacity, reflects a strategic bet that scale economies can offset input volatility, yet the 2026 completion timeline exposes the company to 18 months of spot-market risk. Smaller regional players lacking hedging infrastructure are responding by reformulating products to use locally abundant starches, tapioca in Thailand, sago in Indonesia, rather than imported wheat, a shift that alters texture profiles and requires consumer re-education but insulates margins from global commodity swings.
*Our forecasts treat driver/restraint impacts as directional, not additive. The impact forecasts reflect baseline growth, mix effects, and variable interactions.
Asia-Pacific Soup Market Segment Analysis
By Product Type:
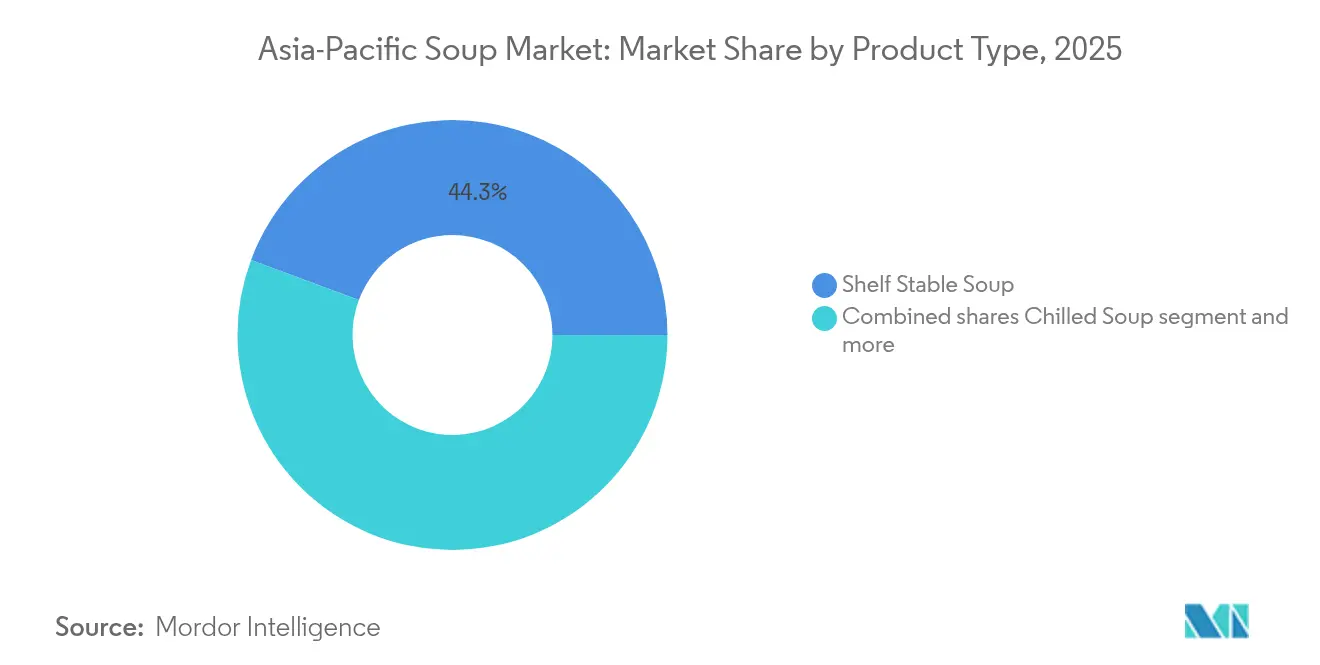
Chilled Formats Gain Despite Infrastructure GapsShelf-stable soup held 44.32% of 2025, benefiting from ambient distribution that bypasses cold-chain constraints, yet chilled soup is forecast to expand at a 4.03% CAGR through 2031 as urban China and Japan invest in last-mile refrigeration. China's State Council mandated 150 advanced logistics hubs and 30 national cold-chain bases by 2025, a policy that is reducing spoilage rates and enabling premium fresh-soup SKUs in tier-1 and tier-2 cities, according to the China State Council. Nissin expanded chilled and frozen capacity in Japan during 2024, targeting the over-65 demographic with high-protein bento-style soups that require refrigeration but deliver restaurant-quality taste. Dry soup, encompassing instant noodle cups and powder sachets, remains a staple in rural and lower-income segments where electricity access is intermittent, and shelf life trumps sensory attributes. Frozen soup occupies a niche position, primarily distributed through modern retail in South Korea and Singapore, where freezer penetration exceeds 80% of households and consumers perceive frozen formats as fresher than shelf-stable alternatives.
Retort technology is blurring category boundaries, allowing shelf-stable products to mimic chilled textures through high-temperature short-time processing that preserves vegetable crunch and broth clarity. Tetra Recart cartons, which withstand 121°C sterilization, are being adopted by Japanese co-packers seeking to export premium miso and ramen broths to Australia without cold-chain dependency. SIG's spouted pouches, commercialized in 2024, reduce packaging weight by 30% versus cans while maintaining an 18-month shelf life, a format that appeals to e-commerce sellers who pay freight by volumetric weight. Amcor's recyclable retort pouch, using mono-material polyethylene, addresses extended producer responsibility mandates in Japan and South Korea, where non-recyclable multilayer films will incur disposal fees starting in 2026.



By Category:
Vegetarian Variants Outpace Meat-Based FormulationsVegetarian soup captured 52.80% of 2025 sales and is projected to grow at a 3.65% CAGR through 2031, outpacing non-vegetarian options as plant-based diets gain traction in India, Indonesia, and urban China. India's Ayurvedic wellness movement positions lentil and vegetable broths as functional foods that balance doshas, creating a premiumization opportunity for brands that source organic pulses and label formulations with Sanskrit ingredient names. Indonesia's halal-certification requirements are inadvertently accelerating vegetarian innovation, as manufacturers reformulate broths to eliminate animal-derived enzymes and gelatin, creating formulations that satisfy both religious and vegan consumers without SKU proliferation.
Non-vegetarian soup, encompassing chicken, pork, and seafood broths, remains dominant in Japan, South Korea, and Vietnam, where collagen-rich bone broths are perceived as beauty and joint-health supplements. Ajinomoto Philippines launched frozen gyoza and instant-soup options in March 2025, with vegetarian variants accounting for 40% of the initial SKU assortment to capture flexitarian households that alternate between meat and plant proteins. Acecook Vietnam's DALAGO line, launching August 2025, embeds vegetable powders directly into noodle dough, a manufacturing pivot that differentiates the product from competitors who rely on separate seasoning sachets and appeals to parents seeking nutrient-dense convenience meals. Nestlé Malaysia's HARVEST GOURMET plant-based puff pastries, introduced in April 2024 with rendang, curry, and tom yam fillings, signal the company's intent to extend meat-analog platforms into adjacent meal categories.
By Packaging Format:
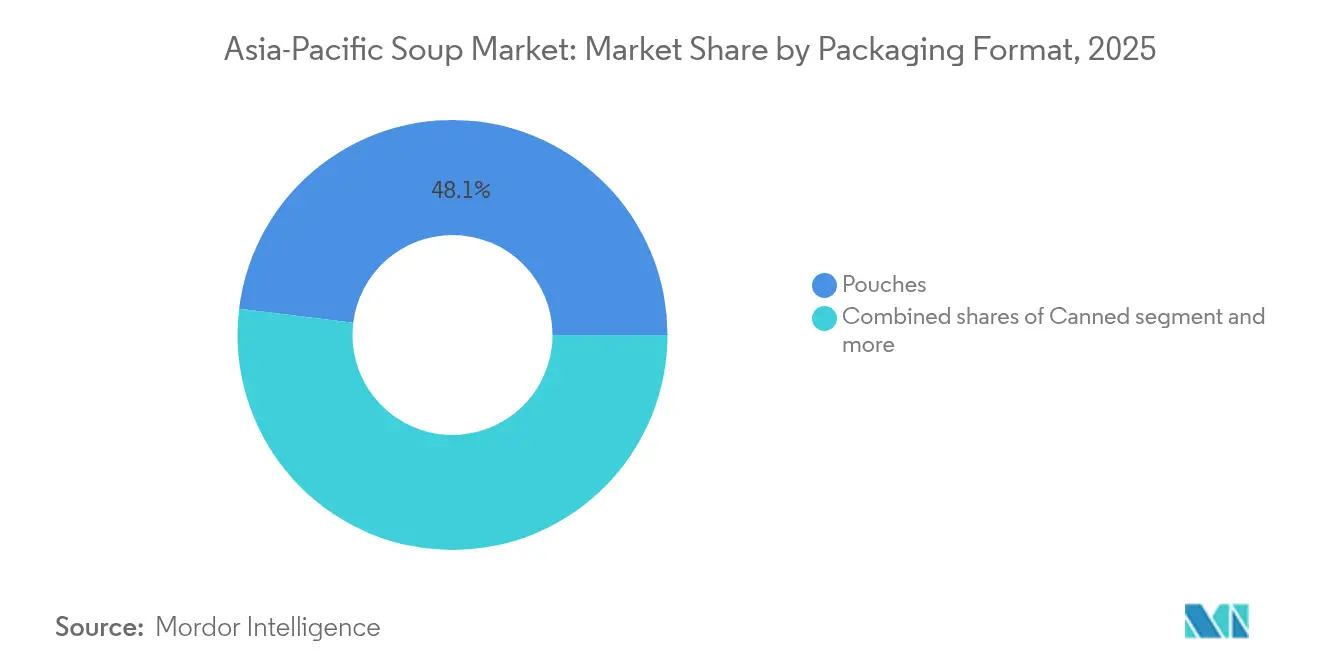
Canned Soup Accelerates on Retort AdvancesPouches commanded 48.05% of 2025 packaging share, favored for their light weight, resealability, and compatibility with microwave heating, yet canned formats are growing at a 4.91% CAGR through 2031, the fastest rate among all packaging types. This acceleration reflects retort-technology improvements that extend shelf life to 24 months without refrigeration while preserving vegetable texture and broth clarity, attributes that justify premium pricing in markets where consumers equate metal packaging with quality. Cartons and tetra-packs, holding a mid-tier position, appeal to environmentally conscious urban buyers in Japan and South Korea, where extended producer responsibility mandates will impose disposal fees on non-recyclable multilayer films starting in 2026. Cups, bowls, and powder sachets occupy the value segment, distributed through convenience stores and kiosks in rural Indonesia, the Philippines, and Vietnam, where single-serve formats align with daily-wage income patterns and limited home storage.
Amcor's recyclable retort pouch, commercialized in 2024, uses mono-material polyethylene that can be processed in existing film-recycling streams, reducing end-of-life costs for retailers subject to take-back obligations. Pakka's compostable flexible packaging, certified to EN 13432, is being piloted by Indian ready-meal brands seeking to align with the Ministry of Environment's single-use plastic phase-out, which bans polystyrene foam cups from January 2026. SIG's spouted pouches, introduced in 2024, reduce packaging weight by 30% versus cans while maintaining an 18-month shelf life, a format that lowers freight costs for exporters targeting Australia and New Zealand.
By Distribution Channel:
Online Retail Gains as Quick Commerce ExpandsSupermarkets and hypermarkets accounted for 52.00% of 2025 distribution, anchored by their ability to offer full SKU assortments, in-store promotions, and private-label alternatives that capture price-sensitive shoppers. Online retail is expanding at a 4.56% CAGR through 2031, driven by India's quick-commerce platforms, Blinkit, Zepto, and Swiggy Instamart, which reached USD 5 billion in 2024 and are forecast to hit USD 60 billion by 2030, with ready-to-eat meals comprising a disproportionate share of basket value because 10-minute delivery windows favor shelf-stable products. China's club warehouses grew 17% in 2024, concentrated in tier-3 and tier-4 cities where bulk purchasing aligns with multi-generational household structures, and soup multipacks serve as traffic drivers for these formats. Convenience and grocery stores, holding a stable mid-tier position, remain critical in Japan and South Korea, where 24-hour operations and proximity to transit hubs make them the default channel for single-serve instant soups consumed as breakfast or late-night snacks.
Vietnam's WinCommerce expanded to 3,700 stores by end-2024, targeting 4,000 by year-end 2025, anchoring ready-to-eat aisles as traffic drivers and negotiating exclusive SKUs with local manufacturers to differentiate from rival chains. Thailand's Tops chain aims for 1,000 outlets by 2027, investing in cold-chain infrastructure to support chilled-soup assortments that command 30% higher margins than ambient lines. Other distribution channels, encompassing food-service distributors, vending machines, and direct-to-consumer subscriptions, are gaining traction in Japan, where labor shortages are accelerating food-service automation and legitimizing at-home instant formats.
Geography Analysis
China Soup Market
China held 37.60% of regional demand in 2025, yet its packaged-food market is undergoing a structural shift as offline channels outperformed e-commerce for the first time on record, signaling that consumers are reverting to wet markets and fresh-ingredient purchases as pandemic-era delivery habits fade. Club warehouses surged in tier-3 and tier-4 cities, where bulk purchasing aligns with multi-generational households, and soup multipacks serve as traffic drivers for these formats. The State Council's mandate for 150 advanced logistics hubs and 30 national cold-chain bases by 2025 is reducing spoilage rates and enabling premium chilled-soup SKUs in tier-1 and tier-2 cities, yet cold-storage capacity remains fragmented, with top players holding less than 15% market share.
India Soup Market
India is forecast to expand at a 4.12% CAGR through 2031, the fastest rate among major geographies, propelled by nuclear-family formation, rising female workforce participation, and quick-commerce platforms that compress delivery windows to 10 minutes. The government's Pradhan Mantri Kisan Sampada Yojana allocated USD 585 million from 2021 to 2026 to build integrated cold-chain infrastructure, a policy that will disproportionately benefit ready-to-eat categories as spoilage declines. Vegetarian soup is projected to grow at a 3.65% CAGR, outpacing non-vegetarian variants, as Ayurvedic wellness trends position lentil and vegetable broths as functional foods that balance doshas.
Japan Soup Market
Japan's instant-soup market stood at approximately JPY 103 billion in 2024 and is forecast to reach JPY 132 billion by 2033, driven by an aging population that will comprise 30% of residents by 2030 and prioritizes high-protein, low-sodium options aligned with government dietary guidelines. ITOCHU acquired Campbell's soup import and marketing rights in September 2025, signaling confidence in premiumization opportunities as consumers trade up from domestic instant brands to Western-style broths. Nissin expanded its KANZEN MEAL cup-type soup series in 2024, fortifying formulations with collagen and vitamins, and increased chilled and frozen capacity to serve the over-65 demographic. Labor shortages are accelerating food-service automation, exemplified by Connected Robotics' Delibot ramen vending machine, which indirectly legitimizes at-home instant formats by normalizing robotic meal assembly.
Regulatory Landscape
Food-soup manufacturers selling across Asia-Pacific face tighter food-safety, product-compliance, and packaging requirements that increasingly operate as non-tariff market-access gates, alongside labeling standards and import controls. Singapore rolled out the Food Safety and Security Act 2025, passed in February 2025, with the first tranche in force from November 28, 2025, strengthening expectations around imported-food controls and compliance documentation for packaged categories.
In Vietnam, Decree No. 46/2026/ND-CP (issued January 26, 2026) sets out implementation measures for the Law on Food Safety, including conformity-declaration processes via the National Public Service Portal, which reinforces digital submission workflows for packaged products. For Australia and New Zealand, Food Standards Australia New Zealand (FSANZ) continued updating the Food Standards Code in 2026 (including Amendments No. 247 on January 20, 2026, No. 249 on April 30, 2026, and No. 250 on June 9, 2026), sustaining a dynamic standards environment for soup formulations, claims, and ingredient compliance. Regionally, AFRAS 2026 in Seoul (May 11-12, 2026) highlighted digital transformation and electronic sanitary certificates, and also drew attention to recycled-plastic management, which intersects with the sector shift toward retort pouches, cartons, and other packaging formats.
Competitive Landscape
The Asia-Pacific soup market registers moderate fragmentation, as multinational incumbents, Nestlé, Unilever, Campbell, compete alongside regional specialists such as Nissin, Ajinomoto, Nongshim, and Indofood, each pursuing distinct strategies to defend share against nimble entrants. Korean exporters are leveraging viral flavor trends, exemplified by Samyang's Habanero Buldak Ramen targeting Latin and Hispanic US consumers, to penetrate Western and Southeast Asian shelves, while Vietnamese manufacturers are investing over USD 200 million in new capacity to serve both domestic and export channels.
Vertical integration remains a competitive wedge for players like Indofood, which sources wheat and palm oil from captive plantations, insulating margins from spot-market volatility that squeezed rivals in 2024 when palm-oil prices rose 6% year-on-year. Opportunities are emerging in chilled and frozen formats, where cold-chain modernization in China and India is enabling premium fresh-soup SKUs that command 30% higher margins than ambient lines, yet require last-mile refrigeration that only tier-1 and tier-2 cities can support at scale.
Technology adoption is differentiating leaders from laggards, with Nissin's expansion of cup-type soups in its KANZEN MEAL series incorporating high-protein formulations and collagen fortification to target Japan's over-65 demographic, while Acecook Vietnam's DALAGO line embeds vegetable powders directly into noodle dough, a manufacturing pivot that eliminates separate seasoning sachets and appeals to parents seeking nutrient-dense convenience meals. Packaging innovation is compressing the performance gap between chilled and shelf-stable formats, with Tetra Recart cartons and SIG spouted pouches enabling ambient distribution of premium broths that mimic fresh textures, allowing manufacturers to premiumize ambient SKUs and capture margin that historically accrued only to refrigerated lines.
Asia-Pacific Soup Industry Leaders
-
Campbell Soup Company
-
Nestlé S.A.
-
Unilever PLC
-
Ajinomoto Co., Inc.
-
Nissin Foods Holdings Co., Ltd.
- *Disclaimer: Major Players sorted in no particular order
Asia-Pacific Soup Market Companies Covered in this Report
- Campbell Soup Company
- Nestlé S.A.
- Unilever PLC
- Ajinomoto Co., Inc.
- Nissin Foods Holdings Co., Ltd.
- Toyo Suisan Kaisha, Ltd.
- General Mills, Inc.
- Kraft Heinz Company
- Conagra Brands, Inc.
- Ottogi Co., Ltd.
- Acecook Vietnam Joint Stock Company
- Tat Hui Foods Pte. Ltd.
- Nongshim Co., Ltd.
- Samyang Foods Inc.
- Indofood CBP Sukses Makmur Tbk
- Baxters Food Group Ltd.
- House Foods Group Inc.
- Premier Foods plc
- Hain Celestial Group, Inc.
- Vedan International (Holdings) Ltd.

Market Opportunities and Future Outlook
Cold-chain and modern-retail buildouts are expanding the addressable space for premium chilled and fresh-positioned soups in specific urban corridors. At the same time, digital compliance and SPS-driven market access raise the bar for exporters serving multiple Asia-Pacific destinations. The China State Council mandate for 150 advanced logistics hubs and 30 national cold-chain bases by 2025, along with Indias Pradhan Mantri Kisan Sampada Yojana funding for cold-chain infrastructure (2021-2026), creates practical whitespace for brands to scale refrigerated, higher-value soups in tiered city clusters where last-mile refrigeration is improving.
Convenience-led demand is also being shaped by online and quick-commerce baskets, which leaves room in portfolios for single-serve shelf-stable soup formats that travel well, plus better-for-you positioning, including reduced sodium and fortified recipes, that aligns with aging demographics in Japan and broader health-led reformulation trends. Southeast Asia continues to offer manufacturing-export platform opportunities, with Acecook Vietnams completion of a new USD 200 million factory in Hoa Phu Industrial Park, Vinh Long (81,000 tons annual capacity with multiple initial lines), showing capacity being built in-region to serve both domestic and export channels. Packaging and sustainability compliance is increasingly functioning as a commercial lever, with 2026-linked extended producer responsibility and recycled-plastic management discussions (including AFRAS 2026 focus areas) supporting demand for recyclable retort structures, lighter packs, and formats that fit e-commerce shipping economics.
Recent Industry Developments in Asia-Pacific Soup Market
- July 2026: Unilever expanded its Namdong noodle range with a creamy cheese flavor extension. The update strengthens its instant and convenient meal portfolio in Asia, where cross-over demand between noodles and soup-style products supports line extensions and promotional bundles.
- May 2026: Unilever Thailand repositioned its operations as a global manufacturing and export hub, with a stated aim to double exports of products made in Thailand to more than 60 countries, including Australia, China, Japan, and South Korea. This export-platform emphasis raises competitive pressure for regional manufacturers and supports broader distribution of shelf-stable, mass-market meal solutions across Asia-Pacific.
- December 2024: Unilever announced a binding offer from Zwanenberg Food Group to acquire its Unox and Zwan brands. The portfolio move indicated continued reshaping of category exposure around scalable, core foods lines, influencing investment focus and brand priorities within soup and adjacent meal segments.


Asia-Pacific Soup Market Report Scope and Research Methodology
Market Definition and Coverage
For this study, the market covers packaged soup products sold for home consumption across Asia Pacific, measured as manufacturer level revenue in USD across online and offline retail channels.
Scope exclusions: Restaurant soups and freshly prepared soups sold in foodservice outlets are excluded from this market sizing.
Segments Covered in This Report
-
Product Type
- Dry Soup
- Shelf Stable Soup
- Chilled Soup
- Frozen Soup
-
Category
- Vegetarian Soup
- Non‑Vegetarian Soup
-
Packaging Format
- Canned
- Pouches
- Cartons / Tetra‑packs
- Others
-
Distribution Channel
- Hypermarkets/Supermarkets
- Convenience/Grocery Stores
- Online Retail Stores
- Other Distribution Channels
-
Geography
- China
- Japan
- India
- Australia
- Indonesia
- Malaysia
- Singapore
- Rest of Asia-Pacific
Data Sources, Market Sizing, and Validation
Desk Research
Desk research was used to set the foundation for country coverage and demand context, before assumptions were taken into the sizing model. We leaned on public sources such as UN Comtrade trade statistics, national statistical offices in key Asia Pacific countries, food safety and labeling regulators, and consumer price index releases to track category inflation and pack size shifts.
On top of this, we reviewed company annual reports, investor presentations, and retailer announcements to capture portfolio changes and distribution expansion. A paid subscription for company financials and news was also used to standardize revenue references and document corporate actions, and a patent database was checked to spot format and packaging activity that signals innovation cycles. The sources listed here are illustrative only, and we also reviewed other public datasets and documents for data collection, validation, and clarification.
Primary Interviews and Surveys
Primary work was used to close gaps that desk sources cannot answer cleanly, especially around pricing ladders, channel mix, and the split across dry, chilled, and frozen formats. Interviews and short surveys were run with manufacturers, distributors, retailers, and category specialists across major Asia Pacific markets. These inputs were then used to confirm penetration, trade ups, and demand seasonality (for example, winter months and monsoon periods that can affect soup consumption).
Distribution of primary research fieldwork respondents
| Company type | Respondent position |
|---|---|
| Top tier: 35% | CXOs: 14% |
| Mid tier: 46% | Functional/Unit leaders: 32% |
| Smaller Players: 19% | Managers: 54% |
Market-Sizing & Forecasting
The sizing starts with a top-down build that reconstructs country level soup demand using retail food spend signals, shelf stable convenience food share, and category penetration patterns. We then translate demand into value using observed price bands.
To keep the totals realistic, we ran selective bottom-up checks using sampled brand and pack price points, channel checks across supermarkets versus convenience and online, and supplier roll ups in countries where financial disclosures are clearer. Key inputs that materially shape the model include the split between vegetarian and non-vegetarian soups, the mix across dry, chilled, and frozen products, packaging shifts like cans versus pouches, and the pace of online retail adoption.
Where a data series was missing for a smaller market, we used proxy indicators from similar consumption markets and then adjusted the result after expert feedback. For the forecast, scenario analysis was applied around inflation, household income momentum, and distribution expansion, and the year-by-year path was cross-checked with what industry participants expect on pricing and volume growth.
Data Validation & Update Cycle
Outputs are validated through multiple checks so that one unusual assumption does not distort the final number. We compare the model result with independent signals such as packaged food growth rates, trade movements for relevant product groups, and changes in retail shelf space and promotion intensity, then investigate any variances that look out of line.
Before sign-off, a second analyst reviews the calculation chain. Follow-up calls are triggered when a key input changes meaningfully, such as sudden price spikes or a channel disruption. Reports are refreshed annually, with interim updates when material events occur in the region. Right before delivery, a fresh review pass is done so the client receives the latest view based on the most recent available information.
Mordor Intelligence's Asia Pacific Soup Market Size Versus Other Published Estimates
Published market sizes for Asia Pacific soup often do not match each other, even when the topic name looks the same. Most gaps come from differences in what is counted as soup, the year used as the current reference, and how pricing is carried forward when inflation is high.
Ramen style noodle soups are often included in broader convenience meal definitions, but this item sits outside Mordor Intelligence's scope. That is why some external totals look higher even before forecasting assumptions are applied. Differences also show up when one estimate uses retail sales value including channel margins, while another uses manufacturer revenue, and when currency conversion timing is not aligned to the same year average.
Benchmark comparison
| Source | Market Size | Gaps in Research Methodology |
|---|---|---|
| Mordor Intelligence | USD 3.67 B (2026) | |
| Regional Consultancy A | USD 3.97 B (2024) | Uses an earlier reference year and a wider product framing that can fold in adjacent instant meal formats, and it may reflect retail value rather than manufacturer revenue, which lifts the total. |
| Industry Publisher B | USD 2.59 B (2025) | Leans more heavily on a narrower packaged definition and different channel assumptions, and the lower base can also come from conservative price progression and limited validation for smaller Asia Pacific countries. |
Seen together, the spread is mostly explained by definition choices, value chain level (retail versus manufacturer), and the base year used for currency and pricing. By keeping the scope tied to packaged soup formats and then checking pricing and channel splits with primary inputs, the estimate stays traceable to clear drivers that can be repeated and updated each year.


Key Questions Answered in the Report
What is the current value of the Asia-Pacific soup market?
The soup market size is USD 3.67 billion in 2026.
How fast is the region’s soup sector expanding?
The market is projected to grow at a 3.22% CAGR through 2031.
Which product type is expected to grow the quickest?
Chilled soup leads with a forecast 4.03% CAGR as cold-chain capacity improves.
Page last updated on:





