
District Cooling Market Size and Share
Market Overview
| Study Period | 2022 - 2032 |
|---|---|
| Market Size (2027) | USD 29.31 Billion |
| Market Size (2032) | USD 41.56 Billion |
| Growth Rate (2027 - 2032) | 7.23 % |
| Fastest Growing Market | Asia-Pacific |
| Largest Market | Middle East and Africa |
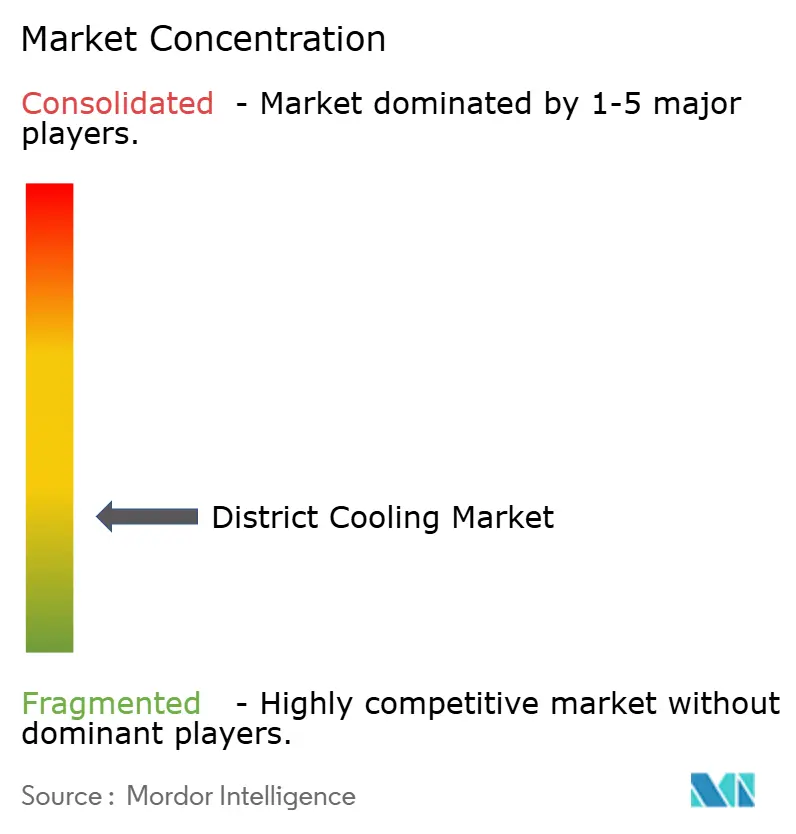
| Market Concentration | Low |
Major Players *Disclaimer: Major Players sorted in no particular order Image © Mordor Intelligence. Reuse requires attribution under CC BY 4.0. | |
District Cooling Market Analysis by Mordor Intelligence
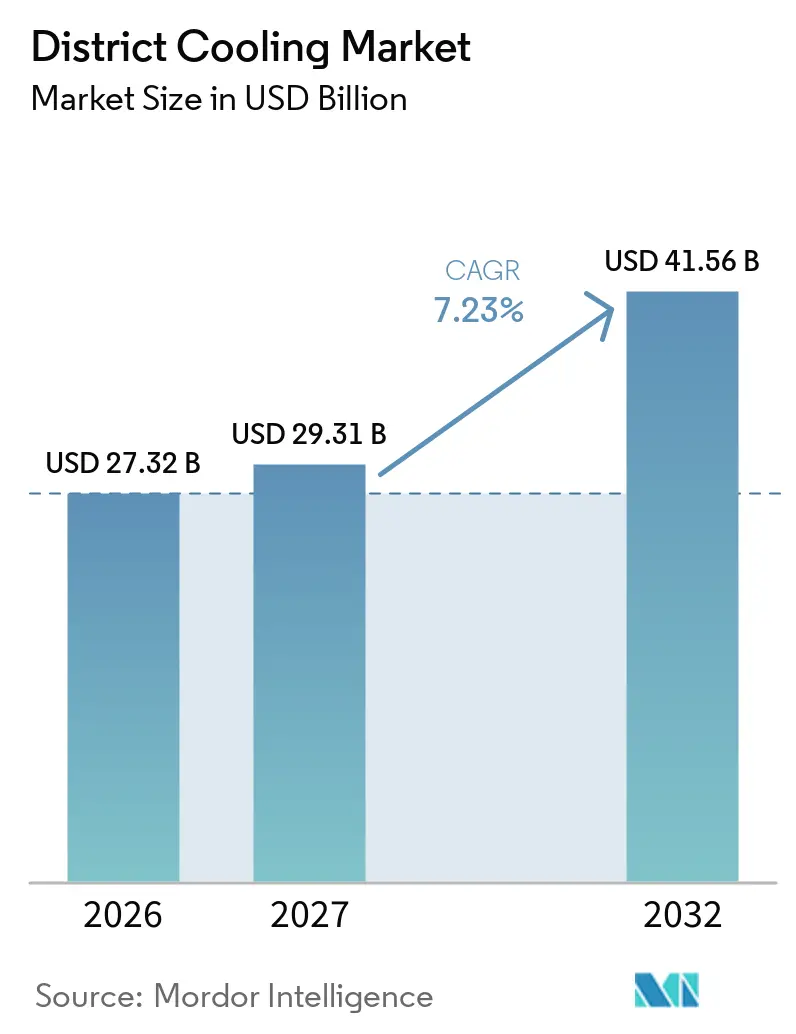
The District Cooling Market size is expected to grow from USD 27.32 billion in 2026 to USD 29.31 billion in 2027 and is forecast to reach USD 41.56 billion by 2032 at 7.23% CAGR over 2027-2032. Rising cooling demand in dense urban areas is improving the case for shared cooling plants and distribution networks. Building efficiency rules are also making centralized systems more relevant for large new developments. Data centers are creating steadier cooling loads that can support long-term project contracts. The global district cooling market is therefore moving beyond its established Gulf and Singapore base into selected Asian and Southern European cities. High construction costs, water constraints, and the need for committed customers will continue to decide which proposed projects move forward.
Key Report Takeaways
- By production technique, electric chillers held 47.6% of the global district cooling market share in 2026, while free cooling is forecast to expand at a 7.8% CAGR through 2032.
- By cooling capacity, above-100 MW plants accounted for 38.3% of the global district cooling market size in 2026, while the 51-100 MW band is projected to grow at a 7.9% CAGR through 2032.
- By application, commercial buildings held 51.5% of the global district cooling market share in 2026, while residential buildings are expected to advance at a 7.7% CAGR through 2032.
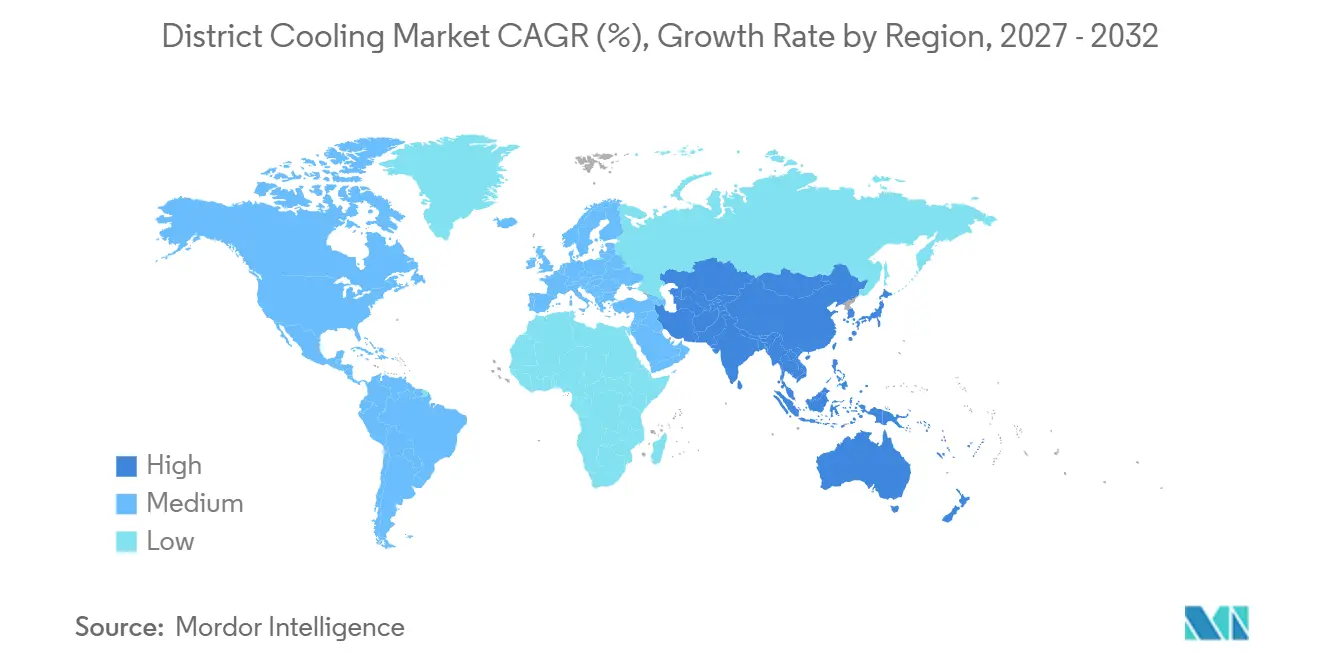
- By geography, the Middle East and Africa held 36.2% of the global district cooling market in 2026, while Asia-Pacific is forecast to grow at an 8.1% CAGR through 2032.
Note: Market numbers in this report are based on Mordor Intelligence's proprietary estimation framework, which combines nine months of actuals with Q4 projections for base year 2026.
Market Trends and Insights
Drivers Impact Analysis of District Cooling Market*
| Driver | (~) % Impact on CAGR Forecast | Geographic Relevance | Impact Timeline |
|---|---|---|---|
| Dense Urban Cooling Load Aggregation | +1.8% | Global, concentrated in GCC, India, and Southeast Asian megacities | Short term (≤ 2 years) |
| Escalating Heatwave Exposure and Cooling Demand | +1.4% | Global, highest incremental demand in South Asia, MENA, and Southern Europe | Short term (≤ 2 years) |
| Building Decarbonization and Energy Efficiency Targets | +1.3% | Europe, GCC, Singapore, and India | Medium term (2-4 years) |
| AI Data Center and Mission-Critical Cooling Expansion | +1.5% | Global, concentrated in China, Southeast Asia, North America, and UAE | Medium term (2-4 years) |
| Thermal Storage and Demand-Response Monetization | +0.7% | Europe, North America, Singapore, and GCC | Long term (≥ 4 years) |
| Brownfield Distributed District Cooling Retrofits | +0.6% | Singapore, Europe, and India's metro cores | Long term (≥ 4 years) |
| Source: Mordor Intelligence | |||
Dense Urban Cooling Loads Support Network Economics
The global district cooling market benefits when offices, hotels, stores, and homes are concentrated within the same development. Different operating hours across these buildings allow a central plant to maintain a higher load factor. This can reduce the capital cost assigned to each refrigeration tone supplied. India's Ozone Cell found efficiency advantages for district cooling in urban clusters with sufficient load density across 13 cities in its September 2025 feasibility study.[1] Larger mixed-use networks can use their plants more consistently than smaller systems with fewer building types. This makes master-planned urban districts more suitable for concession projects and can reduce reliance on a single subsidized anchor customer.
Heat Exposure and Decarbonization Rules Expand Demand
The global district cooling market is responding to more frequent heat events across South Asia, the Middle East and North Africa, and Southern Europe. New building rules are making efficient cooling options more important in large developments. The European Union's revised Energy Efficiency Directive requires cities with more than 45,000 residents to prepare local heating and cooling plans.[2] Saudi Arabia updated its National District Cooling Standard in April 2025, and Qatar issued executive rules for licensed district cooling operations in March 2025. California's 2025 building standards, effective for permit applications from January 2026, strengthen electrification requirements for commercial and multifamily construction.[3] These measures can improve confidence that enough connected demand will be available for new networks.
AI Data Centers Create Stable Cooling Demand
The global district cooling market is gaining a new class of customers in AI-focused data centers. These facilities run continuously and produce dense thermal loads, which can improve plant use compared with conventional commercial buildings. A 2025 study reported that AI-focused data centers linked with district energy systems can improve renewable-energy buffering by up to 28%.[4] Research published in 2025 also modeled that flexible computing loads paired with district cooling networks could serve up to 40% of district heat demand in collocated settings. Hohhot's computing cluster in Inner Mongolia reached 91,000 PFLOPS of capacity by June 2025, with 86% green electricity penetration. Operators are responding through equipment and analytics partnerships that target reliable, long-duration data-center contracts.
Thermal Storage and Brownfield Retrofits Add New Revenue Options
The global district cooling market can use thermal storage to shift cooling loads and participate in demand-response programs. A 2025 Energy study found that a dual short-term storage configuration integrated with data centers increased the load-shifting ratio by 2.1% and reduced operating cost by 3.2%. An IEEE paper published in 2025 identified load curtailment, real-time pricing response, and automated demand management as feasible functions for district cooling systems in India. Tabreed installed 4,000 solar panels that supply 2.4 MW to 2 Abu Dhabi plants and prevent more than 2,600 tonnes of CO₂ each year. Brownfield networks in Singapore, Europe, and Indian metro cores can extend centralized cooling to existing buildings rather than only new districts. These approaches widen the global district cooling market, although the commercial model is still developing outside the Nordic region, Singapore, and the GCC.
Restraints Impact Analysis of District Cooling Market*
| Restraint | (~) % Impact on CAGR Forecast | Geographic Relevance | Impact Timeline |
|---|---|---|---|
| High Upfront Network and Plant Capital Intensity | -1.2% | Global, most acute in South Asia and South America | Short term (≤ 2 years) |
| Low Load Density and Anchor-Customer Dependence | -0.8% | Emerging markets and suburban corridors in North America and Europe | Medium term (2-4 years) |
| Water Availability and Cooling-Tower Consumptive Use | -0.7% | GCC, MENA, and arid regions of India and Australia | Medium term (2-4 years) |
| Permitting, Road-Corridor and Utility-Interface Complexity | -0.5% | Global, most severe in brownfield urban environments | Long term (≥ 4 years) |
| Source: Mordor Intelligence | |||
High Upfront Investment and Customer Commitment Limit Entry
The global district cooling market requires large early commitments for central plants and underground distribution lines. Tabreed's Palm Jebel Ali concession requires AED 1.5 billion investment for 250,000 refrigeration tons (RT) across several phases. Development can take 5-8 years from feasibility work to the first cooling supply. This is longer than many real estate development cycles. Projects usually need long-term concessions, committed anchor customers, or public financial support to manage this difference. The International District Energy Association identified financing as the main obstacle between the potential of data-center-linked district energy and the pace of actual project development.
Water Use and Approval Processes Add Cost and Complexity
The global district cooling market faces water-use pressure where water-cooled chiller plants depend on cooling towers. Abu Dhabi's Department of Energy reported district cooling makeup-water use of 150,000 cubic meters per day, equal to 5% of the emirate's daily desalinated water demand. Qatar reported that 41 plants used recycled water in 2024, representing 82% of the makeup water used by the sector. SP Group's system at STMicroelectronics in Singapore repurposes more than 500,000 cubic meters of reverse-osmosis reject water each year. Seawater cooling, recycled water, dry cooling, and closed-loop designs can reduce freshwater needs, but often add capital and operating costs. In brownfield districts, road access, permits, and utility connections can further delay installation.
*Our forecasts treat driver/restraint impacts as directional, not additive. The impact forecasts reflect baseline growth, mix effects, and variable interactions.
District Cooling Market Segment Analysis
By Production Technique:
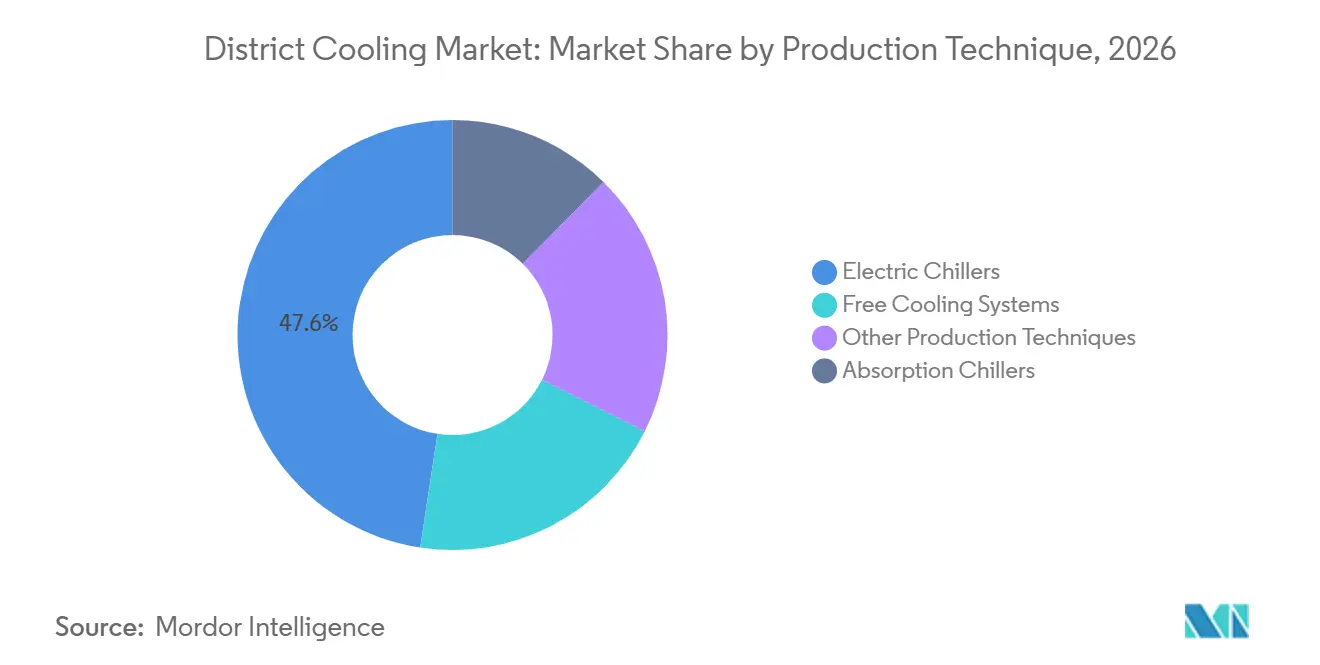
Electric Chillers Lead While Free Cooling ExpandsWithin the global district cooling market, electric chillers held 47.6% of production-technique demand in 2026. Their position reflects modular design, dependable base-load operation, and compatibility with electricity supply from the grid. Empower added 33,500 Refrigeration Tons (RT) in the first quarter of 2026, taking connected capacity to 1.69 million RT. The company reported a 6.6% compound annual growth rate in connected capacity since 2017. Absorption chillers serve more specialized settings where waste heat or cogeneration supports steam-driven cooling. These systems are more applicable to industrial complexes than stand-alone urban networks.
Free cooling is projected to grow at a 7.8% CAGR through 2032. It uses seawater, lake water, or low ambient air temperatures to reduce mechanical refrigeration during suitable conditions. This can lower electricity use in temperate and coastal locations. Euroheat & Power identified growing use of deep-lake and seawater cooling in European cities in 2025. The revised Energy Efficiency Directive supports policy interest in these applications. As a result, the global district cooling market has a clearer route into places where climate conditions can make free cooling practical for a large part of the year.

By Cooling Capacity:
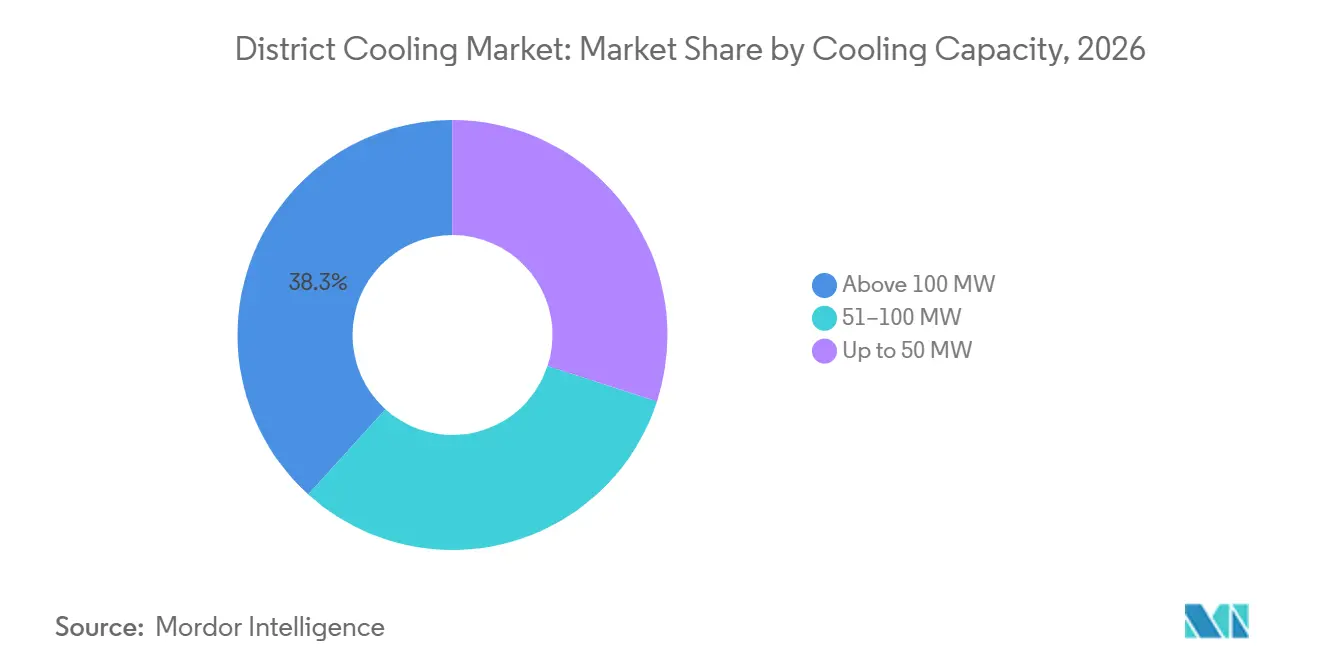
Large Plants Remain Important While Mid-Scale Systems GrowWithin the global district cooling market, above-100 MW plants accounted for 38.3% of capacity-based demand in 2026. These plants are common in the GCC and Singapore, where dense development, high cooling needs, and public financing have supported large concessions. Empower’s Business Bay plant has 276,545 refrigeration tons (RT) of connected capacity and holds records for plant capacity and the number of buildings served. Large networks can spread fixed operating and capital costs across a wider customer base. This remains difficult for operators that lack access to large anchor districts. The scale advantage helps explain why mature concession markets continue to attract consolidation.
The 51-100 MW range is expected to record the highest growth at a 7.9% CAGR through 2032. Data-center parks, hospitals, smart industrial areas, and mixed-use campuses have predictable demand that can support these systems. They do not always need long pipe networks or sovereign support on the same scale as very large plants. Keppel received an April 2026 contract to operate centralized cooling for 9 Tengah Build-To-Order (BTO) projects in Singapore, covering 10,000 households for 20 years. The global district cooling market can use this mid-scale model to enter secondary cities and specialized campuses. It also provides operators with a path to build demand before expanding a network further.
By Application:
Commercial Buildings Lead While Residential Demand RisesWithin the global district cooling market, commercial buildings accounted for 51.5% of application demand in 2026. Office buildings, malls, and hotels have high cooling needs, long operating hours, and tenants that can support long-term service contracts. Their concentration in urban districts provides the load density needed for large central plants. Dubai and Abu Dhabi show how commercial districts and district cooling concessions have developed together. Healthcare facilities, schools, airports, and public buildings provide an additional continuous-use customer base. Keppel signed a June 2025 memorandum with Ng Teng Fong General Hospital and Jurong Community Hospital to explore district cooling integration.
Residential buildings are forecast to grow at a 7.7% CAGR through 2032. Developers in India, the UAE, and Singapore are considering district cooling early in the design of large communities. This can avoid costly changes after residents move in. ENGIE and Sunway Property expanded their Malaysian system in November 2025 to serve 8 Sunway Education buildings with up to 3,000 RT (refrigeration tons). The project targets a 29% carbon-emissions reduction over 24 years. Residential and education-linked systems can diversify demand away from traditional office and retail districts. This broadens the customer base for the global district cooling market while retaining the benefit of planned development.
Geography Analysis
MEA District Cooling Market
The Middle East and Africa held 36.2% of the global district cooling market size in 2026. The region built this position through state-backed concessions and large urban projects. Dubai Electricity and Water Authority (DEWA) purchased Dubai Holding’s 24% stake in Empower in February 2026 for AED 5.2 billion, or USD 1.4 billion, increasing its ownership to 80%. Tabreed completed the acquisition of PAL Cooling for AED 3.9 billion and began the Palm Jebel Ali joint venture, which has AED 1.5 billion of planned investment and 250,000 RT of capacity. These transactions show the high level of control held by major operators in the UAE.
APAC District Cooling Market
Within the global district cooling market, Asia-Pacific is forecast to grow at an 8.1% CAGR through 2032. SP Group was appointed in January 2026 to build a distributed system across 5 HarbourFront buildings in Singapore with 17,150 RT of installed capacity. The project is expected to reduce emissions by 13,700 tonnes over 20 years. Adani Energy Solutions disclosed construction of a 45,000 TR district cooling facility at Mundra, Gujarat, during July 2025. Institutional investment is also increasing, with Lestari Cooling Energy securing up to MYR 190 million in March 2026 for Malaysian project deployment.
Europe and South America District Cooling Market
Europe expanded district cooling infrastructure by more than 3% in 2023, according to the 2025 District Heating and Cooling Market Outlook. France, Spain, and Poland are expected to add capacity as local heating and cooling planning rules move into national policy. Southern Europe has limited district cooling coverage despite rising heat exposure. Spain and Italy therefore remain prospective locations for first network investments. South America is the smallest regional market, with Brazil and Chile providing the main activity centers. The region will need credible anchor customers and long-term financing before it can capture a larger share of the global district cooling market.
Competitive Landscape
The global district cooling market is fragmented. It has a strong structure in the GCC and more open competition in Asia-Pacific and Europe. Empower and Tabreed hold strong positions in Gulf concession markets. DEWA's increase in Empower ownership to 80% gives Dubai's public utility greater control over the emirate's largest district cooling operator. Tabreed's purchase of PAL Cooling added 600,000 refrigeration tons (RT) across 8 Abu Dhabi concessions. This consolidation places more importance on service quality, energy performance, and expansion into nearby markets.
Keppel reported an Infrastructure Division contract backlog of more than SGD 7.1 billion at the end of December 2025. Its integrated chilled-water thermal grid at Fusionopolis, Biopolis, and Mediapolis has a combined design capacity of more than 70,000 RT and serves more than 25 developments. ENGIE was appointed by Singapore Pools in June 2026 for a brownfield district cooling project in Singapore. It is also expanding its Sunway Square work in Malaysia. These examples show how companies are pursuing distributed systems, technology integration, and long-term operating contracts rather than only large new plants.
Data-center-linked concessions and 51-100 MW systems in secondary Asian cities remain less controlled by established operators. This leaves room for infrastructure-fund-backed independent providers. ISO 50001 energy management certification is becoming more relevant in institutional and public procurement. Operators that document energy performance can compete on factors beyond tariff levels.
District Cooling Industry Leaders
-
Emirates Central Cooling Systems Corporation PJSC (Empower)
-
National Central Cooling Company PJSC (Tabreed)
-
ENGIE SA
-
Veolia Environnement SA
-
Fortum Oyj
- *Disclaimer: Major Players sorted in no particular order
District Cooling Market Companies Covered in this Report
- ADC Energy Systems LLC
- Alfa Laval AB
- AtkinsRéalis
- Daikin Industries, Ltd.
- Danfoss A/S
- Emirates Central Cooling Systems Corporation PJSC
- Emirates District Cooling LLC
- ENGIE SA
- Fortum Oyj
- Johnson Controls International plc
- Keppel Corporation Limited
- LOGSTOR Denmark Holding ApS
- Marafeq Qatar
- Mitsubishi Heavy Industries, Ltd.
- National Central Cooling Company PJSC
- Qatar District Cooling Company Private J.S.C
- Ramboll Group A/S
- SHINRYO CORPORATION
- SP Group
- Stellar Energy International
- SUEZ
- Thermax Limited
- Trane Technologies plc
- Veolia Environnement SA
Recent Industry Developments in District Cooling Market
- February 2026: Empower awarded the design contract for its fifth Business Bay district cooling plant, approximately 44,000 RT, extending the project's ultimate capacity to 451,540 RT across approximately 325 buildings and reinforcing its dominance over Dubai's commercial cooling pipeline.
- April 2026: Keppel received a Housing & Development Board (HDB) contract to operate centralized cooling for 9 Tengah Build-to-Order (BTO) projects, approximately 10,000 households, 20-year term, bringing total Tengah coverage to approximately 14,000 households across 12 projects.
- March 2026: Lestari Cooling Energy, KJTS Group and Stonepeak joint venture, added Malaysian pension fund Kumpulan Wang Persaraan Diperbadankan (KWAP) as an investor, committing up to MYR 190 million, approximately USD 47 million. The platform targets over MYR 2 billion in annual project deployment, capitalizing on Malaysia's data-center and industrial cooling demand growth.
- February 2026: Dubai Electricity and Water Authority (DEWA) acquired Dubai Holding’s 24% Empower stake for AED 5.2 billion, approximately USD 1.4 billion, raising its ownership to 80% in the most significant utility-sector consolidation in district cooling history.
Global District Cooling Market Report Scope
District cooling is a centralized system that produces chilled water at a central plant and distributes it through a network of insulated underground pipes to multiple buildings for air conditioning and space cooling.
The global district cooling market is segmented by production technique, cooling capacity, application, and geography. By production technique, the market is segmented into electric chillers, absorption chillers, free cooling systems, and other production techniques. By cooling capacity, the market is segmented into systems with a capacity of up to 50 MW, 51–100 MW, and above 100 MW. By application, the market is segmented into residential buildings, commercial buildings, industrial facilities, healthcare facilities, educational institutions, airports, hospitality and public infrastructure, and other applications. The report also covers the market size and forecasts for the global district cooling market across 26 countries in key regions. For each segment, the market sizing and forecasts have been provided on the basis of value (USD).
Segmentation Overview
| Electric Chillers |
| Absorption Chillers |
| Free Cooling Systems |
| Other Production Techniques |
| Up to 50 MW |
| 51–100 MW |
| Above 100 MW |
| Residential Buildings |
| Commercial Buildings |
| Industrial Facilities |
| Healthcare Facilities |
| Educational Institutions |
| Airports, Hospitality, and Public Infrastructure |
| Other Applications |
| North America | United States |
| Canada | |
| Mexico | |
| Europe | Germany |
| France | |
| Italy | |
| Spain | |
| United Kingdom | |
| Poland | |
| Russia | |
| Rest of Europe | |
| Asia-Pacific | China |
| India | |
| Japan | |
| South Korea | |
| Australia | |
| Indonesia | |
| Vietnam | |
| Thailand | |
| Rest of Asia-Pacific | |
| South America | Brazil |
| Argentina | |
| Chile | |
| Rest of South America | |
| Middle East and Africa | Saudi Arabia |
| United Arab Emirates | |
| Egypt | |
| South Africa | |
| Morocco | |
| Rest of Middle East and Africa |
| By Production Technique | Electric Chillers | |
| Absorption Chillers | ||
| Free Cooling Systems | ||
| Other Production Techniques | ||
| By Cooling Capacity | Up to 50 MW | |
| 51–100 MW | ||
| Above 100 MW | ||
| By Application | Residential Buildings | |
| Commercial Buildings | ||
| Industrial Facilities | ||
| Healthcare Facilities | ||
| Educational Institutions | ||
| Airports, Hospitality, and Public Infrastructure | ||
| Other Applications | ||
| By Geography | North America | United States |
| Canada | ||
| Mexico | ||
| Europe | Germany | |
| France | ||
| Italy | ||
| Spain | ||
| United Kingdom | ||
| Poland | ||
| Russia | ||
| Rest of Europe | ||
| Asia-Pacific | China | |
| India | ||
| Japan | ||
| South Korea | ||
| Australia | ||
| Indonesia | ||
| Vietnam | ||
| Thailand | ||
| Rest of Asia-Pacific | ||
| South America | Brazil | |
| Argentina | ||
| Chile | ||
| Rest of South America | ||
| Middle East and Africa | Saudi Arabia | |
| United Arab Emirates | ||
| Egypt | ||
| South Africa | ||
| Morocco | ||
| Rest of Middle East and Africa | ||
Key Questions Answered in the Report
What is the projected value of the global district cooling sector by 2032?
It is projected to reach USD 41.56 billion by 2032, rising from USD 29.31 billion in 2027 at a 7.23% CAGR.
Which production technique leads district cooling deployments?
Electric chillers lead with 47.6% share in 2026, while free cooling has the fastest projected growth at a 7.8% CAGR.
Why are data centers relevant to centralized cooling projects?
Their continuous, high-density thermal loads can improve plant use and help support long-term service contracts.
Which region has the largest share of district cooling activity?
The Middle East and Africa leads with 36.2% share in 2026, supported by major UAE concession operators.
Which region is projected to grow the fastest through 2032?
Asia-Pacific is expected to record an 8.1% CAGR, supported by projects in Singapore, India, China, and Malaysia.
What limits new district cooling projects?
High early investment, committed-customer requirements, water constraints, permits, and utility connections can delay projects.