Disclosure Management (DM) Market Size and Share
Market Overview
| Study Period | 2020 - 2031 |
|---|---|
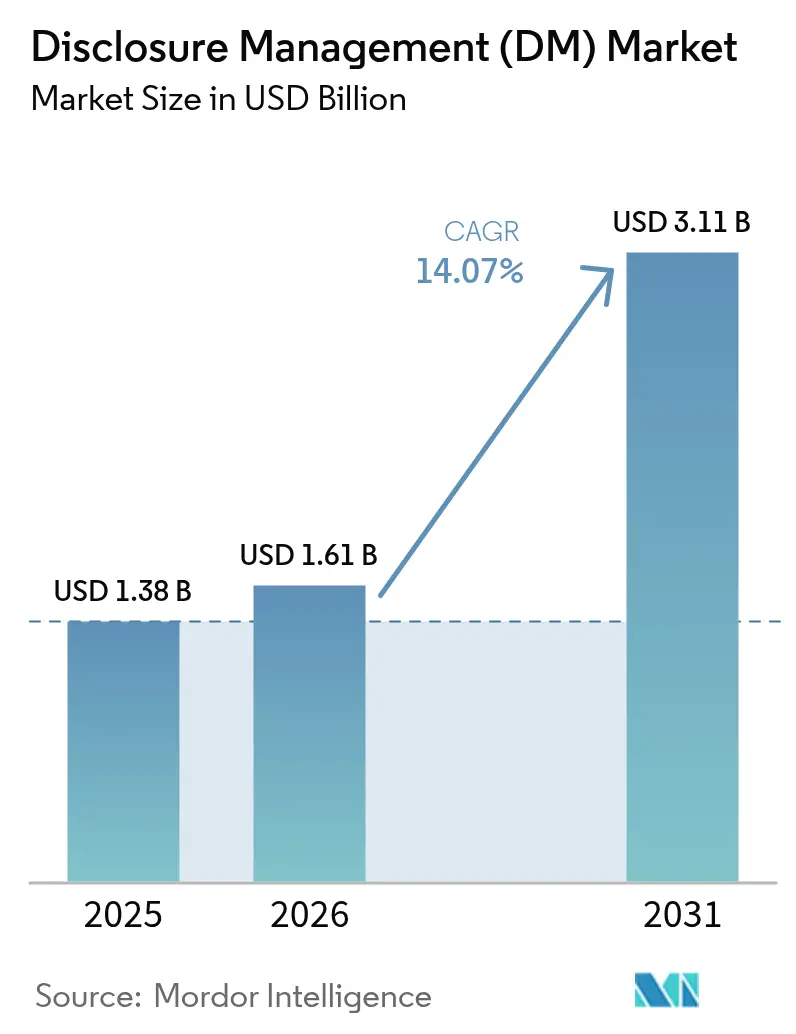
| Market Size (2026) | USD 1.61 Billion |
| Market Size (2031) | USD 3.11 Billion |
| Growth Rate (2026 - 2031) | 14.07% CAGR |
| Fastest Growing Market | Asia Pacific |
| Largest Market | North America |
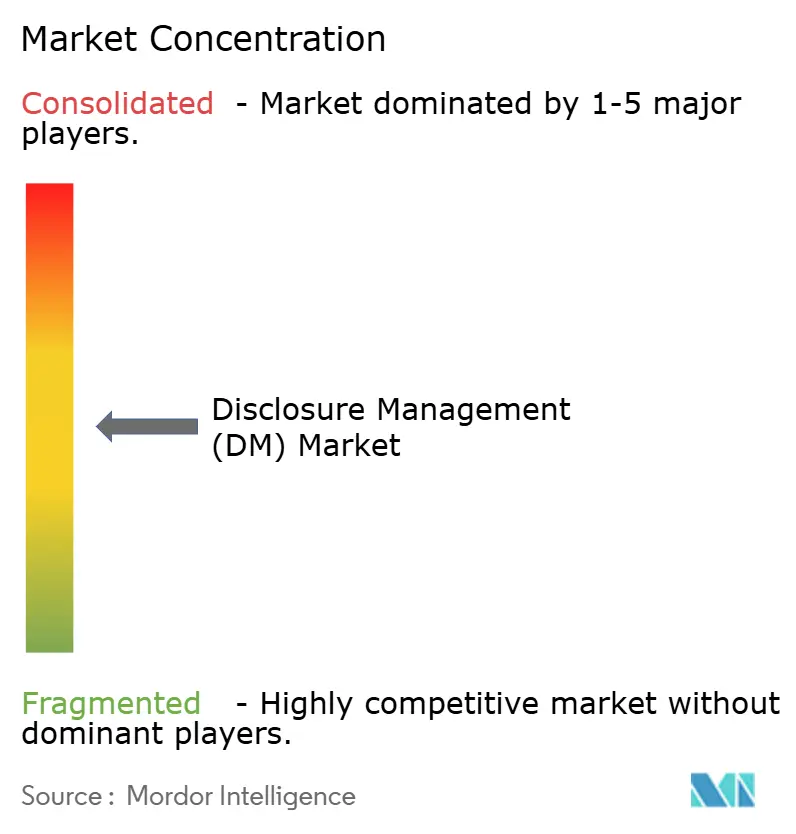
| Market Concentration | Medium |
Major Players*Disclaimer: Major Players sorted in no particular order Image © Mordor Intelligence. Reuse requires attribution under CC BY 4.0. | |
Disclosure Management (DM) Market Analysis by Mordor Intelligence
The Disclosure management market size is projected to be USD 1.38 billion in 2025, USD 1.61 billion in 2026, and reach USD 3.11 billion by 2031, growing at a CAGR of 14.07% from 2026 to 2031. Rapid migration from manual spreadsheets to cloud-native disclosure suites is compressing reporting cycles, while integrated artificial-intelligence modules cut tagging and narrative-drafting effort. Inline XBRL mandates across the United States, Europe, and Asia-Pacific have moved structured data from an optional feature to a filing prerequisite, steering budget away from legacy Excel add-ins toward purpose-built platforms. Investor appetite for standardized ESG metrics is turning sustainability reporting into the fastest-growing application segment. Competitive intensity is moderate because no single vendor controls more than one-quarter of revenue, yet scale advantages in security certification and taxonomy maintenance favor the five largest providers. Ongoing convergence of financial and non-financial frameworks positions end-to-end platforms to capture incremental expansion spending.
Key Report Takeaways
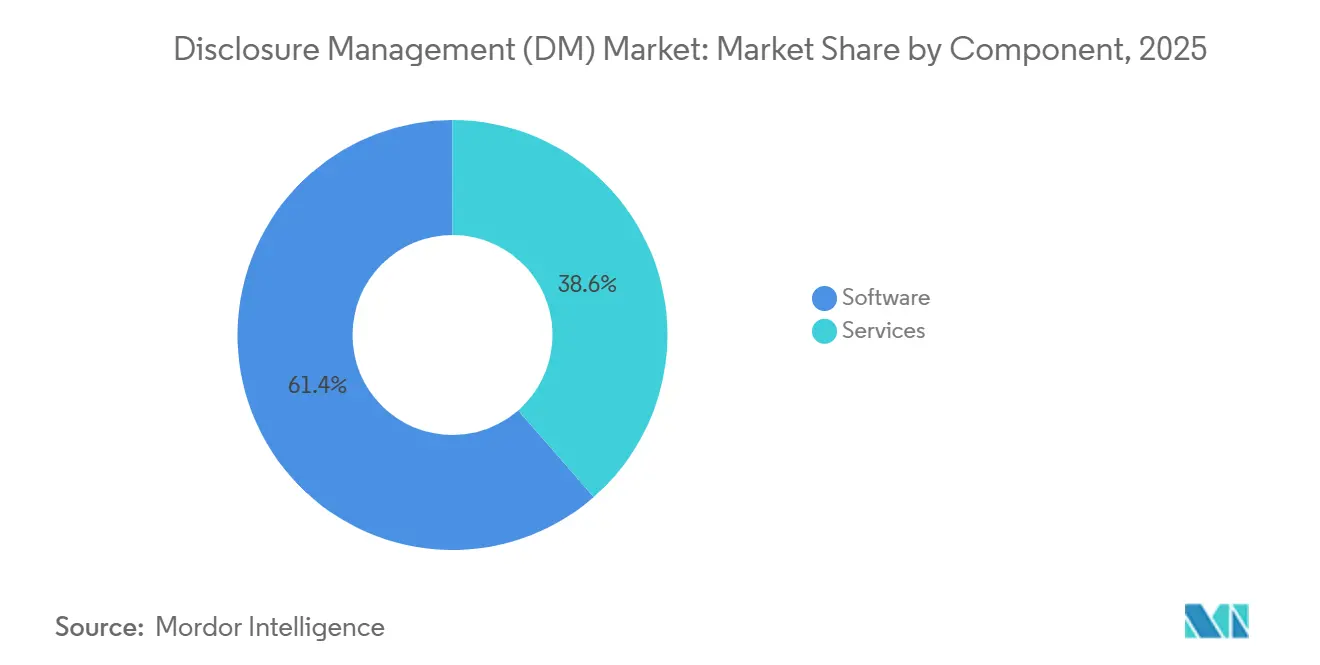
- Software led with 61.41% of the Disclosure management market share in 2025, while services are advancing at a 14.55% CAGR through 2031.
- Cloud deployment captured 68.94% of 2025 revenue and is expanding at a 14.91% CAGR to 2031.
- Large enterprises commanded 55.29% of 2025 sales, whereas small and medium enterprises are pacing the field at a 14.98% CAGR.
- Regulatory and tax filing represented 34.62% of demand in 2025, but ESG reporting is projected to climb at a 15.01% CAGR.
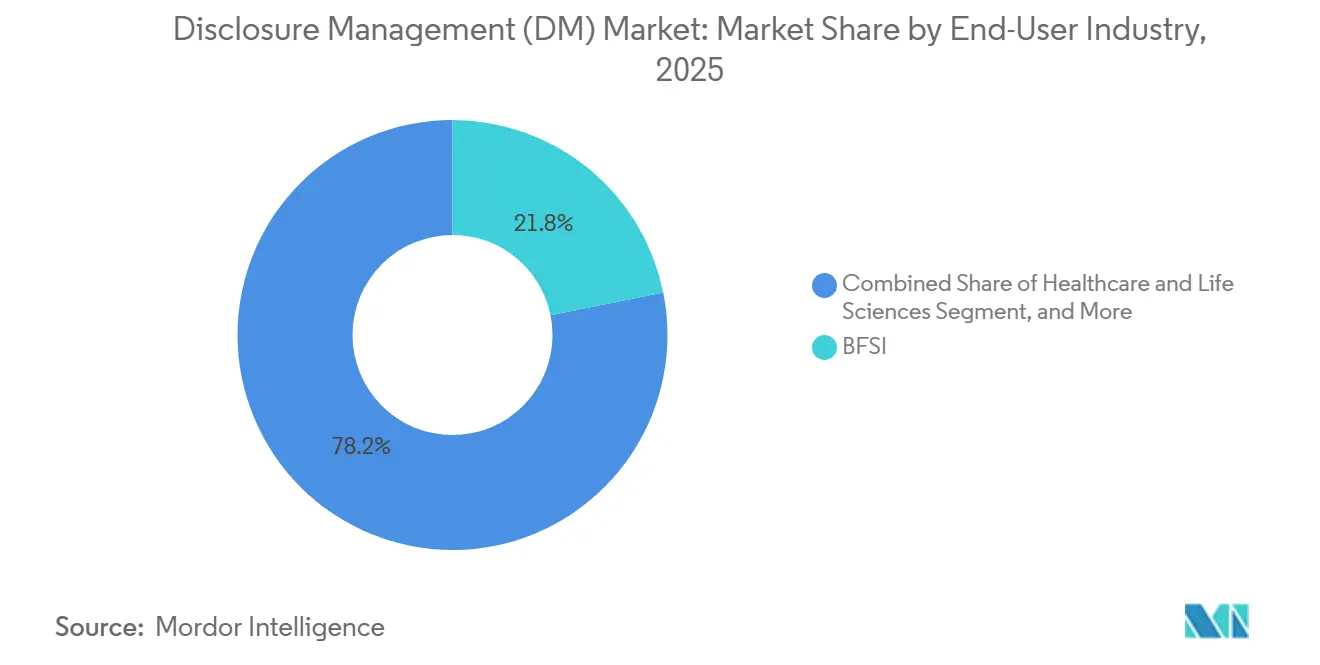
- Banking, financial services, and insurance accounted for 21.83% of 2025 spending; healthcare and life sciences are growing the fastest at a 15.23% CAGR.
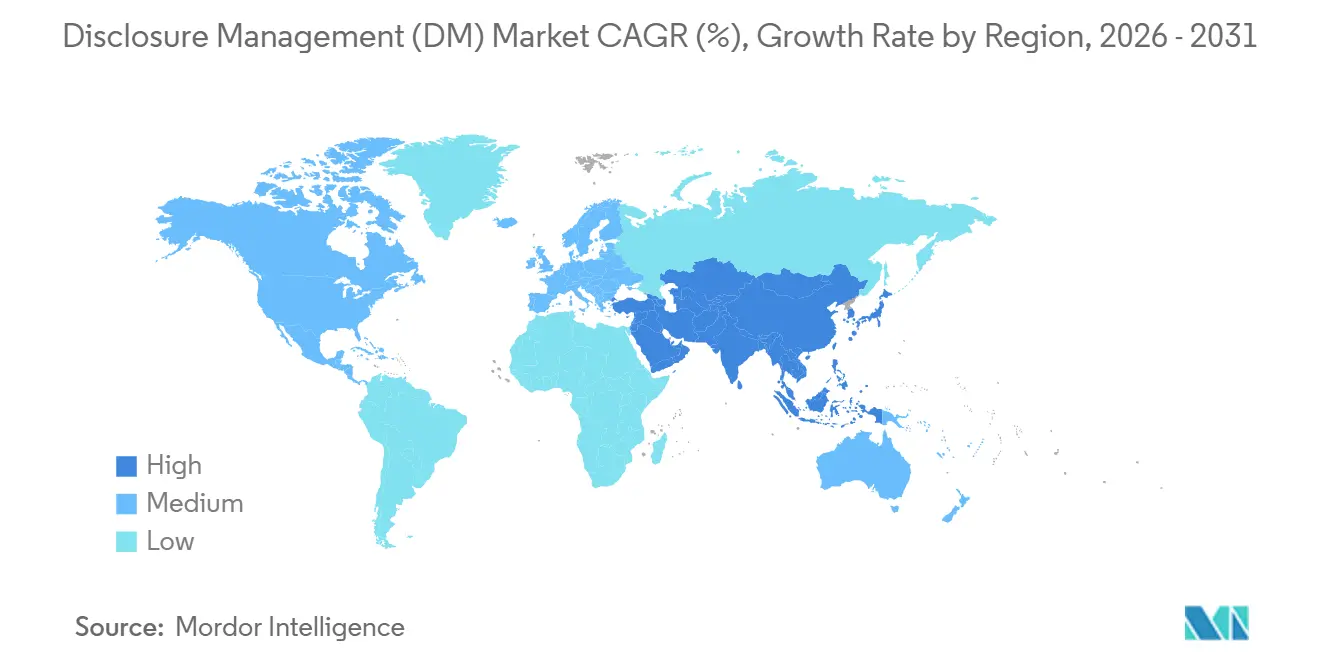
- North America generated 40.75% of revenue in 2025, yet Asia-Pacific is forecast to rise at a 14.87% CAGR through 2031.
Note: Market size and forecast figures in this report are generated using Mordor Intelligence’s proprietary estimation framework, updated with the latest available data and insights as of 2026.
Global Disclosure Management (DM) Market Trends and Insights
Drivers Impact Analysis*
| Driver | (~) % Impact on CAGR Forecast | Geographic Relevance | Impact Timeline |
|---|---|---|---|
| Rising Compliance Complexity Across Multi-Format, Multi-Jurisdiction Filings | +3.20% | Global, with peak intensity in North America and Europe | Medium term (2-4 years) |
| Mandates for Inline XBRL and Real-Time Reporting by Regulators | +2.80% | North America, Europe, Asia-Pacific (China, Japan) | Short term (≤ 2 years) |
| Demand for ESG/Sustainability Transparency from Investors | +2.50% | Global, led by Europe and North America, expanding to Asia-Pacific | Long term (≥ 4 years) |
| Automation Needs to Reduce Disclosure Cycle-Time and Manual Errors | +2.10% | Global, with early adoption in BFSI and large enterprises | Medium term (2-4 years) |
| Cloud-Native Report-as-a-Service Platforms Lowering TCO | +1.90% | Global, strongest uptake in SMEs and emerging markets | Medium term (2-4 years) |
| AI-Driven Narrative Generation and Anomaly Detection Tools | +1.60% | North America and Europe, pilot phase in Asia-Pacific | Long term (≥ 4 years) |
| Source: Mordor Intelligence | |||


Rising Compliance Complexity Across Multi-Format, Multi-Jurisdiction Filings
Issuers must track 47 XBRL taxonomies that update on divergent schedules, forcing cross-listed companies to reconcile U.S. GAAP and IFRS elements and then retag for EDGAR and ESEF filing portals. January-2024 U.S. GAAP revisions for lease accounting and March-2024 ESEF sustainability extensions highlight the widening cadence gap. Maintaining parallel mapping tables now absorbs close to one-fifth of close-cycle hours, so platforms that automate taxonomy synchronization are becoming essential, especially for filers juggling dual deadlines within a five-day window.
Mandates for Inline XBRL and Real-Time Reporting by Regulators
The SEC expanded inline XBRL tagging to exhibit 101 filing-fee tables in 2025 and shortened the review window, boosting demand for auto-tagging engines.[2]United States Securities and Exchange Commission, “EDGAR Filer Manual,” sec.gov ESMA plans to embed sustainability metrics into its inline XBRL framework, effectively merging financial and ESG data ESMA.EUROPA.[3]European Securities and Markets Authority, “European Single Electronic Format,” esma.europa.eu Japan’s Tokyo Stock Exchange has already required climate-disclosure tables in annual securities reports, with South Korea piloting live XBRL earnings feeds. Finance teams now embed tagging logic at trial-balance level so filings and management reports roll out simultaneously, a shift that accelerates platform refresh cycles.
Demand for ESG and Sustainability Transparency from Investors
Asset owners representing USD 130 trillion are embedding ESG metrics into capital allocation. IFRS S1 and S2, effective for fiscal 2024, moved climate data into the core financial reporting orbit. The European Union’s Corporate Sustainability Reporting Directive layers double materiality and third-party assurance on roughly 50,000 entities, while California’s Senate Bill 253 extends Scope 3 reporting to thousands of national and foreign filers. Disclosure tools now bundle carbon accounting and supply-chain connectors so finance teams can automate greenhouse gas metrics and attach them to revenue lines, facilitating audit-ready sustainability statements.[1]European Securities and Markets Authority, “ESEF Reporting Manual 2024,” esma.europa.eu
Automation Needs to Reduce Disclosure Cycle-Time and Manual Errors
Median 10-K filing time among Fortune 1000 issuers dropped from 28 days in 2019 to 22 days in 2024, but XBRL error letters from the United States Securities and Exchange Commission rose by one-third in the same period. Spreadsheet workflows break under compressed timelines, and a single formula error can trigger costly restatements. Automated validation engines that cross-check tagged items against source ledgers cut rework, reduce comment-letter risk, and free accountants to focus on judgment-intensive footnotes.
Restraints Impact Analysis*
| Restraint | (~) % Impact on CAGR Forecast | Geographic Relevance | Impact Timeline |
|---|---|---|---|
| Conflicting Global/Regional Taxonomy Standards and Updates | -1.80% | Global, most acute in cross-border filers spanning North America, Europe, Asia-Pacific | Medium term (2-4 years) |
| Cyber-Security and Data-Sovereignty Concerns in Cloud Adoption | -1.50% | Europe, Middle East, Asia-Pacific (China, India, Indonesia) | Short term (≤ 2 years) |
| Shortage of Disclosure-Specialised Finance Talent | -1.20% | Global, with acute gaps in North America and Europe | Long term (≥ 4 years) |
| High Switching Cost from Legacy Excel/ERP Add-Ins | -1.00% | North America and Europe, concentrated in large enterprises | Medium term (2-4 years) |
| Source: Mordor Intelligence | |||
Conflicting Global and Regional Taxonomy Standards and Updates
U.S. GAAP and IFRS taxonomies overlap on only two-fifths of elements, while Japan, China, and individual European regulators publish jurisdiction-specific schemas that rarely synchronize release cycles. Companies navigating three or more regimes must fund constant remapping projects that inflate consulting spend and slow close cycles. Smaller vendors struggle to maintain coverage, exposing customers to filing rejections when new elements become mandatory, and the resulting uncertainty discourages some issuers from embracing new digital formats.
Cyber-Security and Data-Sovereignty Concerns in Cloud Adoption
Finance data carries insider-trading risk, and regulators now require near-immediate breach disclosures. Meanwhile, the General Data Protection Regulation, India’s Digital Personal Data Protection Act, and China’s Data Security Law mandate local data storage, fragmenting the addressable cloud market. Vendors must invest in region-specific instances and certifications, reducing scale economies and complicating multinational rollouts, especially for highly regulated industries that still prefer on-premises or hybrid models.
*Our forecasts treat driver/restraint impacts as directional, not additive. The impact forecasts reflect baseline growth, mix effects, and variable interactions.
Segment Analysis
By Component: Services Gain as Taxonomy Complexity Outpaces Internal Expertise
Software contributed 61.41% of 2025 revenue, underscoring its installed user base across consolidation, XBRL tagging, and narrative editing workflows. Services, however, are projected to expand faster, advancing at a 14.55% CAGR as companies seek outside support for taxonomy mapping, template customization, and managed submissions. The Disclosure management market size for services is therefore poised to increase as regulatory updates accelerate.
Professional advisors provide turnkey implementations, audit-ready mappings, and help desks, easing the burden on thinly staffed finance teams. Big Four firms and niche consultancies bundle software with advisory retainers, converting one-time projects into recurring revenue. As frameworks multiply, enterprises opt for managed services that guarantee compliance across SEC, ESMA, and ISSB regimes, reinforcing a services-led growth trajectory within the Disclosure management market.

By Deployment Model: Hybrid Architectures Bridge On-Premises Legacy and Cloud Innovation
Cloud captured 68.94% of spending in 2025 and is forecast to rise at a 14.91% CAGR, powered by subscription pricing and automatic taxonomy updates. The Disclosure management market share held by cloud vendors benefits from real-time collaboration and lower IT overhead. On-premises systems linger inside defense, banking, and government domains that prohibit external hosting, while hybrid configurations permit sensitive data to stay behind a firewall until filings are ready for submission.
Workiva and BlackLine supply connectors that shuttle trial-balance data from on-premises ERPs into cloud tagging engines, satisfying sovereignty rules without sacrificing automation. As cloud providers open additional regional data centers and secure local certifications, hybrid loads are expected to tilt toward fully cloud deployments, further concentrating revenue among born-in-the-cloud platforms inside the Disclosure management market.
By End-User Enterprise Size: SMEs Leapfrog Legacy Systems with Cloud-First Strategies
Large enterprises generated 55.29% of 2025 sales thanks to complex, multi-entity structures that demand advanced controls and multi-taxonomy libraries. Yet SMEs are the growth engine, climbing at a 14.98% CAGR through 2031 as cloud economics eliminate upfront licensing. The Disclosure management market size for SMEs will surge as templated inline XBRL and ESG forms remove the need for in-house specialists.
Subscription packages below USD 50,000 per year resonate with finance managers who previously outsourced tagging on an ad-hoc basis. Vendors nurture a land-and-expand model: once SMEs adopt disclosure modules, they add consolidation, reconciliation, and analytics, raising average contract value. Continued regulatory trickle-down to smaller issuers cements SME momentum within the broader Disclosure management market.

By Application: ESG Reporting Surges as Investors Demand Non-Financial Transparency
Regulatory and tax filing retained a 34.62% revenue share in 2025, driven by mandatory SEC and ESMA submissions. ESG reporting, though, is on track to be the fastest mover, accelerating at a 15.01% CAGR through 2031. The Disclosure management market size attached to ESG modules benefits from ISSB standards that extend structured data beyond finance.
Linking sustainability metrics to financial statements in one platform streamlines assurance audits and satisfies investor due diligence workflows. Pre-built ESRS, IFRS S2, and California climate templates accelerate compliance for multinationals. Vendors now market squarely at sustainability officers as well as controllers, broadening the decision circle and expanding wallet share inside the Disclosure management market.
Geography Analysis
North America anchored 40.75% of 2025 revenue, underpinned by the SEC’s aggressive inline XBRL mandates and accelerated 10-K deadlines. Canada’s regulators are piloting structured continuous-disclosure forms, and Mexico’s exchange promotes XBRL for listed issuers, reinforcing the region’s leadership. Capital-market depth, investor activism, and a dense ecosystem of audit firms keep platform spending high.
Europe’s mature base reflects ESMA’s European Single Electronic Format, which standardizes tagging across 27 member states. National supervisors in Germany, France, Italy, Spain, and the United Kingdom add jurisdiction-specific extensions that spur continued license upgrades. Post-Brexit divergence obliges UK filers to reconcile FRC taxonomies with ESEF, a requirement that channels additional services revenue to multi-standard platforms within the Disclosure management market.
Asia-Pacific is the fastest climber at a 14.87% CAGR through 2031 as regulators in China, India, and Japan converge toward global best practices while retaining regional rules. China’s securities watchdog tightened segment-reporting granularity, India’s SEBI rolled out mandatory sustainability disclosures, and Japan’s FSA pilots XBRL submissions. Vendors that localize interfaces and taxonomy libraries in Chinese, Japanese, and Hindi are positioned to capture outsized growth. Markets in South America, the Middle East, and Africa remain nascent but are opening as exchanges modernize listing rules and governments prioritize transparency.

Competitive Landscape
The top five vendors Workiva, Oracle, SAP, BlackLine, and Wolters Kluwer collectively hold about 45% of global revenue, leaving headroom for regional and vertical specialists. Pure-play Workiva serves 6,541 customers and posted USD 224 million in Q3 2025 revenue, boasting retention above 95%. Oracle and SAP embed disclosure functions in their enterprise-resource-planning suites, appealing to large groups that favor a single application stack, though implementations are lengthy.
BlackLine’s December 2025 acquisition of WiseLayer brought AI anomaly detection into account-reconciliation workflows, signaling a shift toward preventive controls that feed clean data into disclosure engines. New entrants target mid-market firms with simplified user experiences priced below USD 50,000 per annum, while regional players add local taxonomies in Korean, Arabic, or Portuguese to win in emerging markets. Security validation SOC 2 Type II, ISO 27001, and data residency options has become table stakes. As frameworks blur finance and sustainability boundaries, vendors that natively integrate ESG data collection, consolidation, and narrative generation stand to widen moats inside the Disclosure management market.
Disclosure Management (DM) Industry Leaders
SAP SE
Oracle Corporation
Workiva, Inc.
insightsoftware
LucaNet AG
- *Disclaimer: Major Players sorted in no particular order

Recent Industry Developments
- June 2025: Scytale acquired AudITech to add SOX ITGC automation to its compliance suite.
- May 2025: KPMG took a minority stake in Anecdotes to enhance AI-enabled GRC decision making.
- March 2025: Wolters Kluwer’s CCH Tagetik attained 27 top rankings in the BARC consolidation survey, reflecting 96% user recommendation rates.
- October 2024: CyberArk closed its USD 1.66 billion Venafi acquisition, bolstering identity security for enterprise disclosure platforms.


Global Disclosure Management (DM) Market Report Scope
The Disclosure Management Market Report is Segmented by Component (Software, Services), Deployment Model (On-Premises, Cloud, Hybrid), End-User Enterprise Size (Large Enterprises, Small and Medium Enterprises), Application (Regulatory and Tax Filing, Financial Consolidation and Close, Internal and External Financial Reporting, ESG and Sustainability Reporting), End-User Industry (BFSI, IT and Telecom, Healthcare and Life Sciences, Retail and E-Commerce, Manufacturing, Energy and Utilities, Government and Public Sector, Other End-User Industry), and Geography (North America, Europe, Asia-Pacific, Middle East, Africa, South America). The Market Forecasts are Provided in Terms of Value (USD).
| Software | Stand-Alone Disclosure Software |
| Integrated CPM/ERP Modules | |
| Services | Professional (Implementation, Consulting) |
| Managed/BPO |
| On-Premises |
| Cloud |
| Hybrid |
| Large Enterprises |
| Small and Medium Enterprises |
| Regulatory and Tax Filing |
| Financial Consolidation and Close |
| Internal and External Financial Reporting |
| ESG and Sustainability Reporting |
| BFSI |
| IT and Telecom |
| Healthcare and Life Sciences |
| Retail and E-Commerce |
| Manufacturing |
| Energy and Utilities |
| Government and Public Sector |
| Other End-User Industry |
| North America | United States |
| Canada | |
| Mexico | |
| Europe | Germany |
| United Kingdom | |
| France | |
| Italy | |
| Spain | |
| Rest of Europe | |
| Asia-Pacific | China |
| Japan | |
| India | |
| South Korea | |
| Australia and New Zealand | |
| Rest of Asia-Pacific | |
| Middle East | United Arab Emirates |
| Saudi Arabia | |
| Rest of Middle East | |
| Africa | South Africa |
| Nigeria | |
| Rest of Africa | |
| South America | Brazil |
| Argentina | |
| Rest of South America |
| By Component | Software | Stand-Alone Disclosure Software |
| Integrated CPM/ERP Modules | ||
| Services | Professional (Implementation, Consulting) | |
| Managed/BPO | ||
| By Deployment Model | On-Premises | |
| Cloud | ||
| Hybrid | ||
| By End-User Enterprise Size | Large Enterprises | |
| Small and Medium Enterprises | ||
| By Application | Regulatory and Tax Filing | |
| Financial Consolidation and Close | ||
| Internal and External Financial Reporting | ||
| ESG and Sustainability Reporting | ||
| By End-User Industry | BFSI | |
| IT and Telecom | ||
| Healthcare and Life Sciences | ||
| Retail and E-Commerce | ||
| Manufacturing | ||
| Energy and Utilities | ||
| Government and Public Sector | ||
| Other End-User Industry | ||
| By Geography | North America | United States |
| Canada | ||
| Mexico | ||
| Europe | Germany | |
| United Kingdom | ||
| France | ||
| Italy | ||
| Spain | ||
| Rest of Europe | ||
| Asia-Pacific | China | |
| Japan | ||
| India | ||
| South Korea | ||
| Australia and New Zealand | ||
| Rest of Asia-Pacific | ||
| Middle East | United Arab Emirates | |
| Saudi Arabia | ||
| Rest of Middle East | ||
| Africa | South Africa | |
| Nigeria | ||
| Rest of Africa | ||
| South America | Brazil | |
| Argentina | ||
| Rest of South America | ||


Key Questions Answered in the Report
What is the current value of the disclosure management market?
It stands at USD 1.61 billion in 2026 and is forecast to reach USD 3.11 billion by 2031.
Which deployment model is growing the fastest?
Cloud platforms lead with a 14.91% CAGR owing to subscription pricing and automatic taxonomy updates.
Why are SMEs adopting disclosure solutions so quickly?
Cloud templates remove upfront licensing costs and embed ready-made XBRL and ESG forms, enabling SMEs to migrate from spreadsheets without hiring specialists.
How are inline XBRL mandates affecting vendor demand?
Mandatory machine-readable filings in the United States, Europe, and Asia-Pacific compel issuers to license automated tagging engines rather than rely on manual spreadsheets.
Which industry segment is projected to expand the most?
Healthcare and life sciences are advancing at a 15.23% CAGR as drug-pricing and clinical-data transparency rules tighten.
What role does AI play in disclosure preparation?
Generative and machine-learning tools draft MD&A text, auto-tag financial lines, and flag outliers, cutting preparation time and reducing error rates.
Page last updated on:


