Digital Freight Matching Platforms Market Size and Share
Market Overview
| Study Period | 2020 - 2031 |
|---|---|
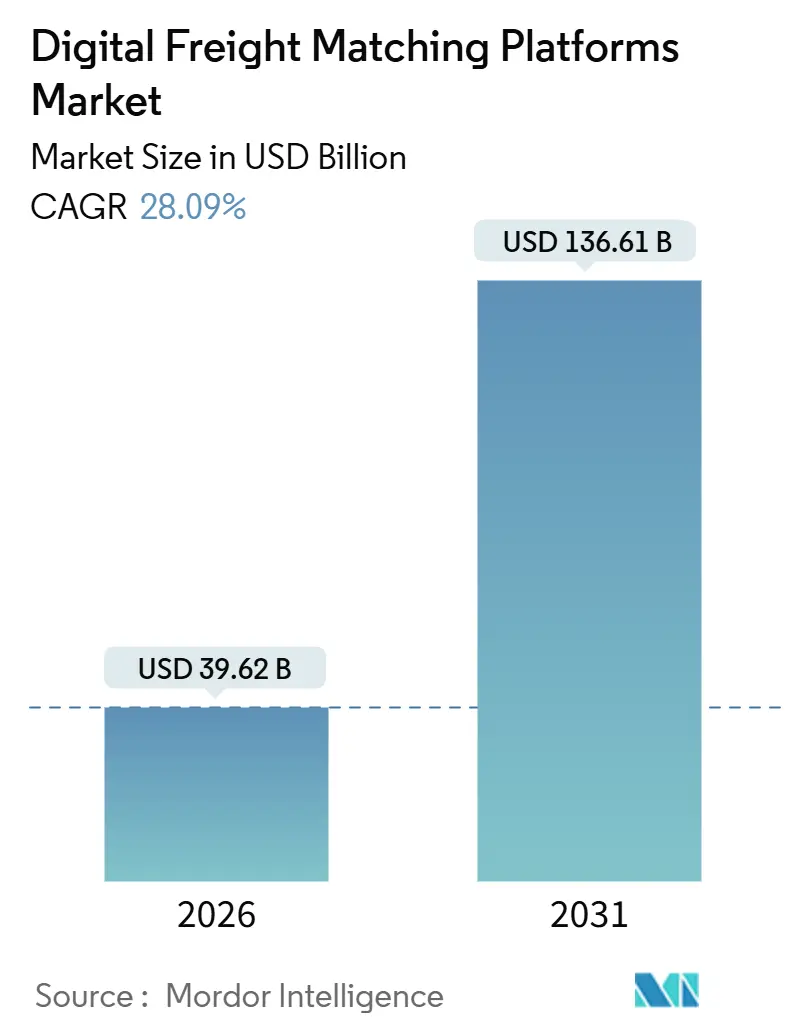
| Market Size (2026) | USD 39.62 Billion |
| Market Size (2031) | USD 136.61 Billion |
| Growth Rate (2026 - 2031) | 28.09% CAGR |
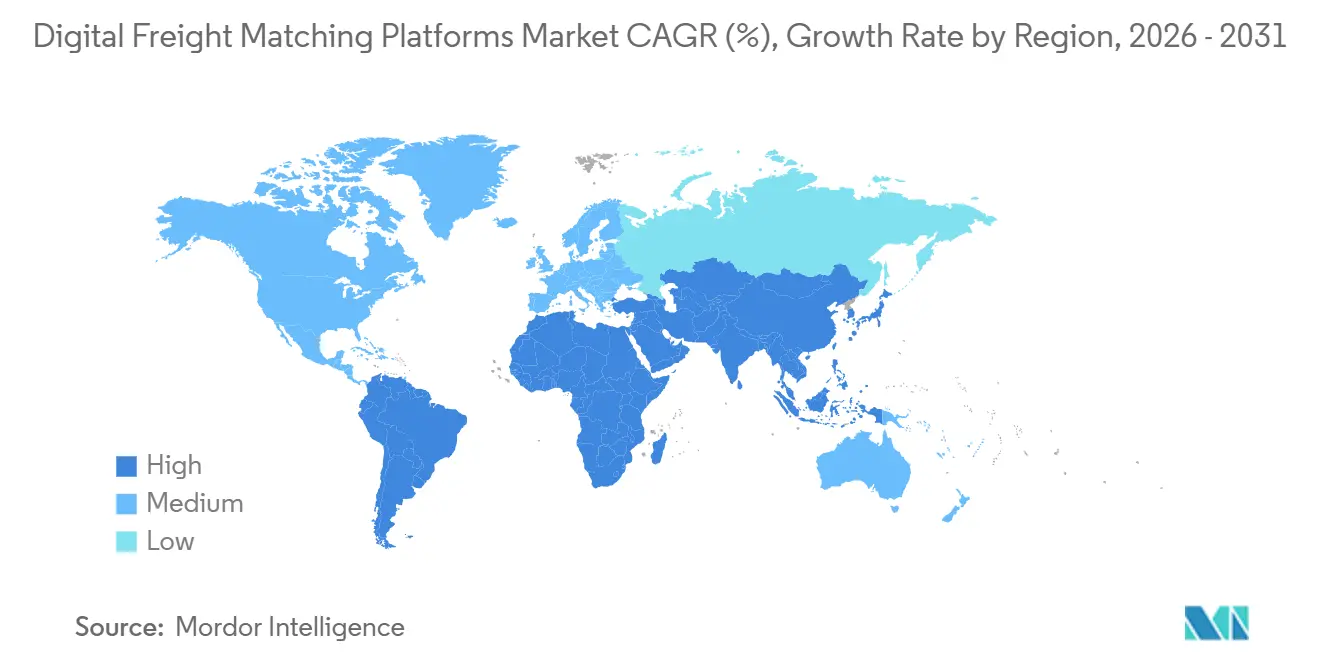
| Fastest Growing Market | Asia Pacific |
| Largest Market | North America |
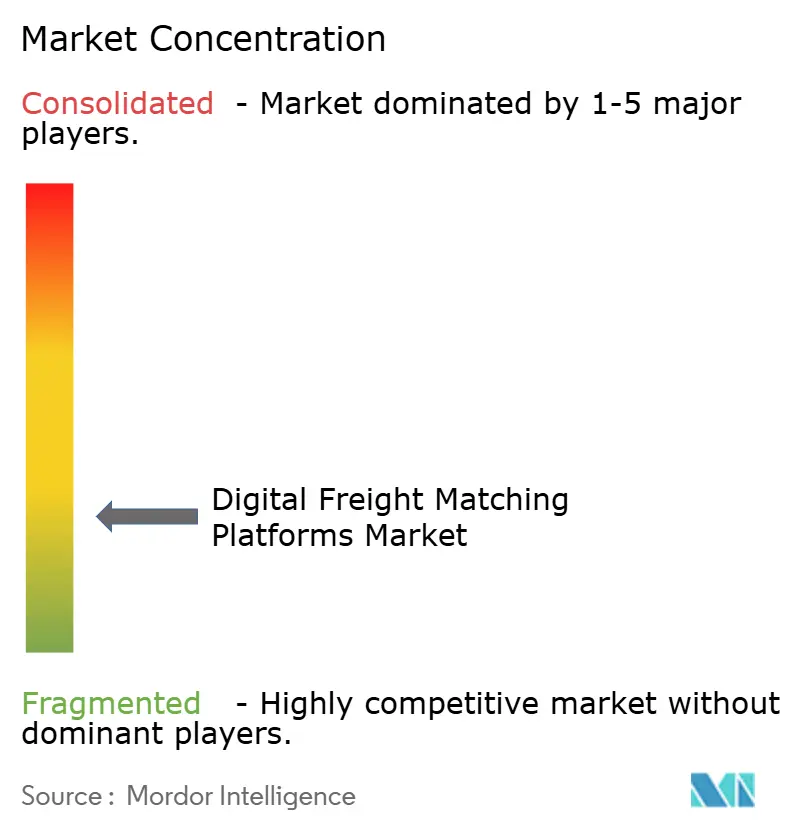
| Market Concentration | Low |
Major Players *Disclaimer: Major Players sorted in no particular order Image © Mordor Intelligence. Reuse requires attribution under CC BY 4.0. | |
Digital Freight Matching Platforms Market Analysis by Mordor Intelligence
The Digital Freight Matching Platforms Market size is estimated at USD 39.62 billion in 2026, and is expected to reach USD 136.61 billion by 2031, at a CAGR of 28.09% during the forecast period (2026-2031). Tight shipment lead times, the rise of parcelized e-commerce flows, and the regulatory push for Scope 3 carbon reporting are steering shippers toward data-rich ecosystems that collapse pricing, capacity search, and documentation into one workflow. Consolidation among brokerages, along with embedded financial products such as same-day pay and cargo insurance, is expanding platform revenue streams beyond the core matching fee. Telematics penetration, bolstered by 5G rollouts, feeds real-time truck location and equipment status into pricing engines, enabling dynamic rate adjustments in 30-minute cycles. Finally, persistent freight-fraud threats are prompting widespread adoption of carrier-identity verification and blockchain-anchored proof-of-delivery, securing trust in the digital freight matching platforms market.
Key Report Takeaways
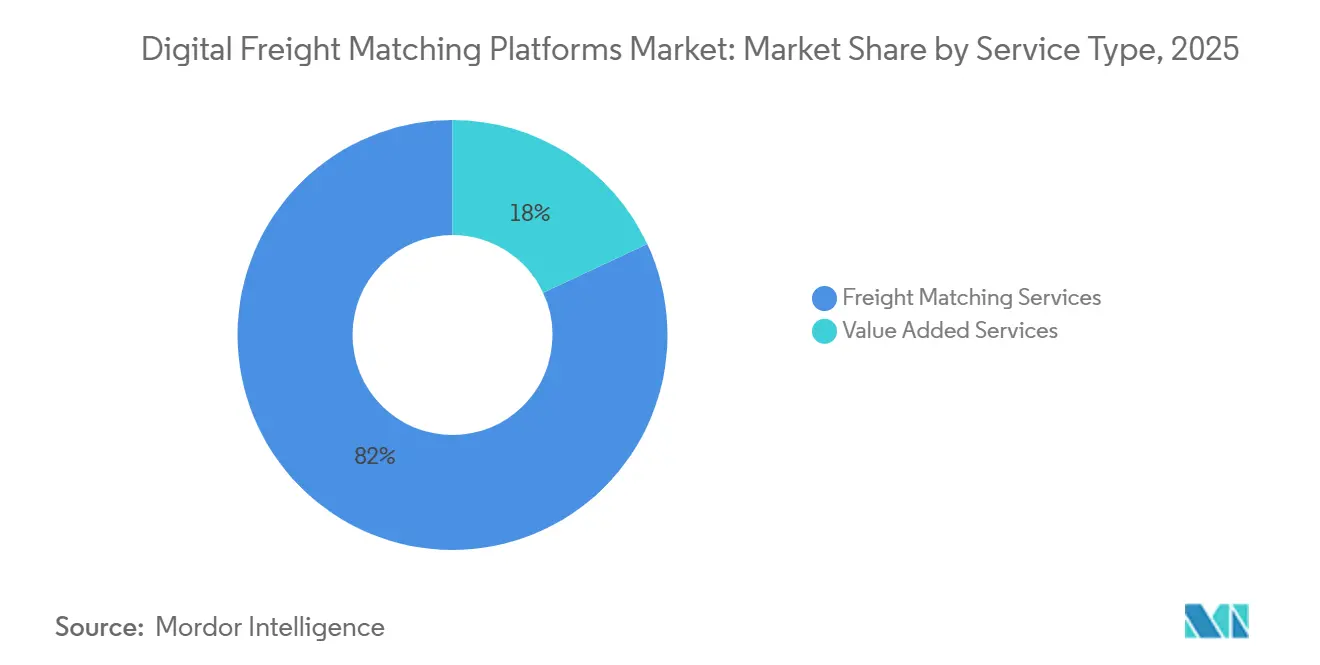
- By service outlook, freight-matching services led with 81.96% of the digital freight matching platforms market size in 2025, while value-added services are projected to expand at a 32.51% CAGR between 2026-2031.
- By platform outlook, web-based portals captured 54.73% of the digital freight matching platforms market share in 2025; mobile-based apps are forecast to grow at a 33.14% CAGR between 2026-2031, on the back of owner-operator smartphone adoption.
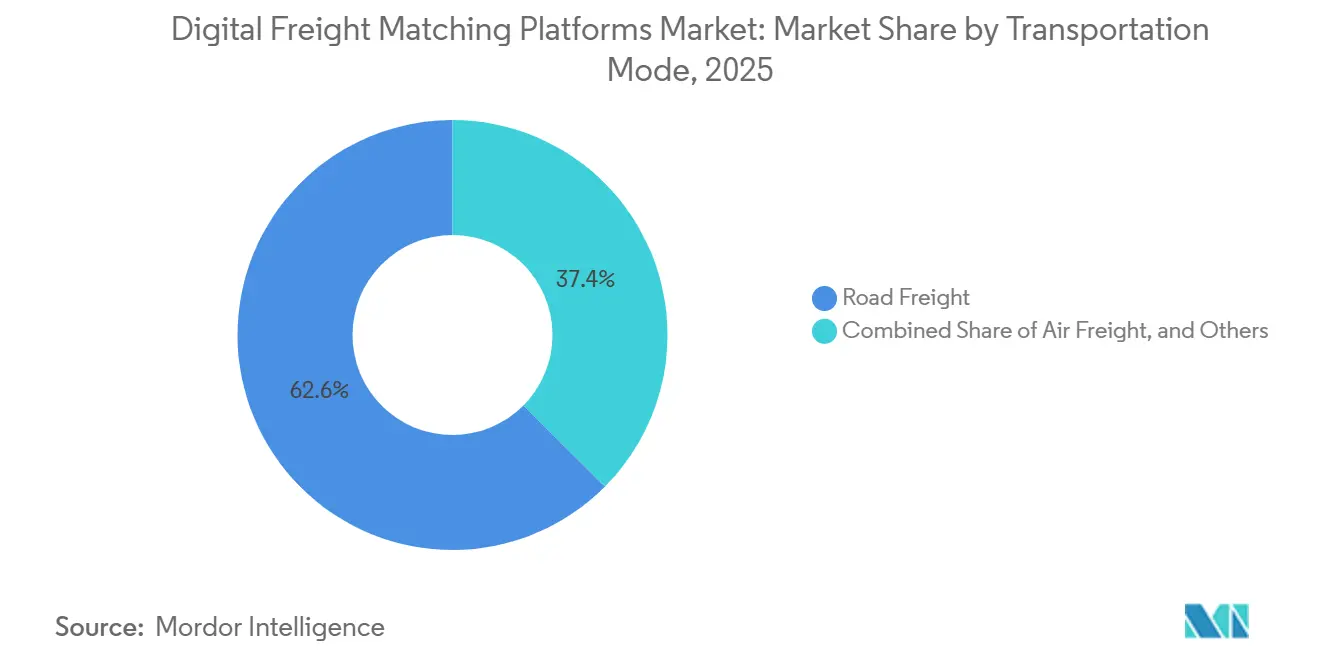
- By transportation mode, road freight held a 62.56% share in 2025, whereas air freight is expected to post the fastest growth at 33.35% CAGR between 2026-2031.
- By end user, retail & e-commerce accounted for 27.57% of demand in 2025 and is projected to rise at a 30.08% CAGR between 2026-2031, as next-day delivery becomes the norm.
- By geography, North America remained the largest regional contributor with a 38.16% share in 2025, while Asia-Pacific is anticipated to grow at a 35.42% CAGR between 2026-2031, on the back of India’s Unified Logistics Interface Platform and China’s 5G telematics mandate.
Note: Market size and forecast figures in this report are generated using Mordor Intelligence’s proprietary estimation framework, updated with the latest available data and insights as of January 2026.
Global Digital Freight Matching Platforms Market Trends and Insights
Drivers Impact Analysis*
| Driver | (~) % Impact on CAGR Forecast | Geographic Relevance | Impact Timeline |
|---|---|---|---|
| Rising need for reliable connections between carriers and shippers | +5.2% | North America and Europe core; global spillover | Medium term (2-4 years) |
| Demand for real-time shipment visibility | +4.8% | North America, Europe, Asia-Pacific urban corridors | Short term (≤ 2 years) |
| E-commerce parcelization boosts spot-capacity demand | +6.1% | Highest in Asia-Pacific and North America | Short term (≤ 2 years) |
| AI-driven autonomous procurement and dynamic pricing | +5.5% | North America and Europe early uptake | Medium term (2-4 years) |
| Scope 3 carbon reporting drives data-centric load consolidation | +3.7% | North America and EU mandates | Long term (≥ 4 years) |
| Proliferation of edge-enabled telematics (5G/IoT sensors) | +4.3% | Rapid rollout in North America and China | Medium term (2-4 years) |
| Source: Mordor Intelligence | |||
Rising Need for Reliable Connections Between Carriers and Shippers
The abrupt shutdown of a high-profile digital broker in late 2023 left shippers scrambling to re-route thousands of daily loads, exposing the operational risk of thinly capitalized platforms. In response, platforms have tightened onboarding rules, demanding 12-month performance histories, active insurance, and clean FMCSA safety scores before awarding tenders. Licensed brokers must now disclose carrier compensation within 48 hours of delivery under the Broker Transparency Rule, narrowing information gaps that once discouraged carriers from app-based load boards. Repeat-carrier relationships are rewarded with higher tender acceptance probabilities, driving a virtuous cycle of reliability and volume that entrenches incumbents possessing deep carrier panels. Consequently, the digital freight matching platforms market increasingly competes on network quality rather than on take-rate discounts[1]“Broker Transparency Final Rule,” U.S. Federal Motor Carrier Safety Administration, fmcsa.dot.gov.
Demand for Real-Time Shipment Visibility
Sub-hourly GPS pings have become table-stakes, with 72% of shippers in a 2024 survey insisting on location updates for high-value loads. Integrations with Motive, Geotab, and Samsara funnel telemetry from more than 6 million Class 8 trucks into transport-management systems, replacing phone check-calls. Automated ETA refreshes lower detention penalties and allow warehouse docks to re-sequence inbound appointments on the fly. The ripple effect is tighter inventory buffers, which free working capital for shippers while driving higher transaction velocity for platforms. Visibility also underpins insurance underwriting, with real-time temperature or shock data satisfying cargo-policy riders and earning rate discounts that platforms pass along to carriers[2]“SEC Adopts Climate Disclosure Rules,” U.S. Securities and Exchange Commission, sec.gov.
E-Commerce Parcelization Boosts Spot-Capacity Demand
Two-thirds of marketplace sellers now ship in LTL or parcel quantities rather than full pallets, compressing tender lead times and swelling spot-market volumes. Digital brokers counter volatility by forming same-day alliances with regional carriers; Uber Freight’s partnership with Better Trucks cut empty miles by 22% on pilot lanes across Texas and California. Shopify sends more than a million daily orders through API-connected networks, sidestepping 3PLs that require 48-hour booking windows. For the digital freight matching platforms market, parcelization translates to higher transaction counts per revenue dollar, magnifying the revenue opportunity for platforms that automate micro-loads efficiently.
AI-Driven Autonomous Procurement and Dynamic Pricing
Reinforcement-learning agents now award tenders in under 15 minutes, achieving 94% acceptance rates compared with the six-hour norm for human brokerage. Generative AI drafts RFPs and proposes carrier pairings, cutting cycle times by one-third for mid-market manufacturers. Spot rates refresh every 30 minutes based on live load-to-truck ratios from DAT, diesel prices, and weather events, allowing platforms to preserve margin while offering fair rates that maintain carrier loyalty. Partnerships with autonomous-truck developers pre-position self-driving tractors on dense corridors, shaving 20% off haulage costs and building a data moat that pure load boards cannot replicate.
Restraints Impact Analysis*
| Restraint | (~) % Impact on CAGR Forecast | Geographic Relevance | Impact Timeline |
|---|---|---|---|
| High fragmentation of logistics industry | -3.4% | Most acute in North America and Europe | Medium term (2-4 years) |
| Cyber-security and data-privacy risks | -2.8% | Greatest regulatory exposure in EU and North America | Short term (≤ 2 years) |
| Rising freight-fraud undermines platform trust | -2.1% | North America hot-spot, creeping into Asia-Pacific | Short term (≤ 2 years) |
| Lack of open interoperability standards (TMS ↔ DFM APIs) | -2.6% | Fragmentation highest among mid-market shippers | Medium term (2-4 years) |
| Source: Mordor Intelligence | |||
High Fragmentation of Logistics Industry
In the United States, 91% of 1.2 million licensed carriers run six or fewer trucks, a structure that resists full digital onboarding. Many owner-operators rely on legacy dispatchers, paper invoices, and fuel-stop fax machines, forcing digital brokers to maintain phone support that tempers automation gains. Europe’s obstacle is regulatory diversity, where 27 member states interpret cabotage and driver rest rules differently, complicating cross-border network orchestration. Even after Sennder absorbed C.H. Robinson’s EU unit, carrier contract migrations and VAT differences slowed unified algorithm deployment[3]“Commercial Motor Vehicle Facts,” U.S. Federal Motor Carrier Safety Administration, fmcsa.dot.gov.
Cyber-Security and Data-Privacy Risks
Ransomware disrupted two U.S. LTL carriers in 2024, freezing shipment visibility and billing for weeks and spotlighting the vulnerability of cloud platforms. CISA guidance now prescribes zero-trust architecture, MFA, and encrypted API gateways for freight technology providers. GDPR fines of up to 4% of global revenue raise the stakes for breach prevention in Europe. Identity fraud compounds the exposure; the FBI attributes 18% of 2023 cargo-theft reports to digitally facilitated double brokering. Platforms therefore face a cost trade-off between frictionless onboarding and rigorous security vetting[4]“Mobility Package,” European Commission, europa.eu.
*Our forecasts treat driver/restraint impacts as directional, not additive. The impact forecasts reflect baseline growth, mix effects, and variable interactions.
Segment Analysis
By Service Outlook: Value-Added Services Accelerate Revenue Diversification
Freight-Matching Services dominated with 81.96% of 2025 revenue, reflecting the foundational importance of swift load-post and bid workflows. Yet Value-Added Services are predicted to expand at a 32.51% CAGR between 2026-2031 as platforms embed factoring, fuel cards, and compliance dashboards. The digital freight matching platforms market share balance is thus tilting toward ancillary revenue streams that cushion the cyclical nature of spot-rate margins. For instance, Loadsmart’s embedded cargo coverage retains 15% of premiums at checkout, surpassing the 8–12% take-rate on matchmaking alone. Redwood Logistics teamed with TriumphPay in 2025, cutting carrier cash-conversion cycles from 30 days to 24 hours and deepening loyalty among small fleets.
The shift also sharpens competitive moats. DAT’s purchase of Convoy’s assets emphasized shipper contracts and payment rails over raw matching technology, illustrating how the digital freight matching platforms market is revaluing data and financial infrastructure. Platforms that fail to cross-sell insurance, payments, or regulatory compliance risk commoditization as APIs make basic load matching ubiquitous. Consequently, the digital freight matching platforms market size attributable to Value-Added Services is on course to more than triple over the forecast window, reshaping margin profiles across the sector.


By Platform Outlook: Mobile Interfaces Propel Owner-Operator Participation
Web portals commanded 54.73% of 2025 spending because enterprise shippers process multi-load tenders via desktop dashboards that sync with TMS software. Nonetheless, mobile apps are forecast to post a 33.14% CAGR (2026-2031), propelled by more than 500,000 U.S. owner-operators who prefer smartphone-based workflows. Uber Freight reports that 62% of carrier interactions now occur within its mobile app, where drivers can accept a load, scan the bill of lading, and trigger instant payment in one session. Cargomatic’s camera-based barcode scan reduces data-entry errors by 35%, proving that phone sensors unlock automation absent on web platforms.
Latency improvements from 5G further tip the scales; sub-100-millisecond round-trips enable real-time video inspections and live chat, features inadequate on legacy web dashboards. Yet complex multi-stop or LTL consolidation tasks still favor large-screen planning grids. Providers, therefore, maintain feature parity across channels to capture both enterprise and long-tail carrier cohorts, ensuring that the digital freight matching platforms market growth is inclusive of diverse user preferences.
By Transportation Mode: Air Freight Digitization Surges
Road Freight accounted for 62.56% of 2025 revenue because truckload spot markets are mature and fragmented, ideal conditions for digital brokerage. However, Air Freight bookings through WebCargo, CargoAi, and airline-direct APIs are set to rise at a 33.35% CAGR (2026-2031) as e-commerce and high-value pharmaceuticals demand cross-border speed. The International Air Transport Association’s ONE Record standard lets platforms harvest capacity across 35 airlines without bespoke integrations.
Ocean digitization has been uneven since the TradeLens wind-down, yet Maersk Spot’s 12% share of its own container volume in 2024 proves shippers will pay for rate certainty and guaranteed space. Rail remains the laggard due to limited real-time capacity disclosure by Class I railroads, though J.B. Hunt now routes 28% of its intermodal volume through automated tendering. With air carriers racing to publish digital tariffs, air cargo could overtake ocean in digital penetration well before the forecast horizon, diversifying the digital freight matching platforms market.

By End User: Retail and E-Commerce Outpaces All Sectors
Retail & E-commerce captured 27.57% share in 2025 and is forecast to grow at 30.08% CAGR (2026-2031) as same-day delivery expectations spread beyond Tier 1 cities. Amazon, Shopify, and a raft of marketplace operators tap real-time spot capacity to manage peak-season overflow, bypassing 3PL booking windows that stretch to 48 hours. Manufacturing, the second-largest cohort, leans on just-in-time replenishment; semiconductor shortages pushed OEMs to raise spot freight spend by 22% in 2024 for expedited components.
Food & Beverages and Healthcare require temperature control and chain-of-custody documentation. Platforms integrating Samsara or Tive IoT sensors satisfy FSMA and GDP compliance, enabling premium rates and higher wallet share. Oil & Gas relies on specialized flatbeds and tankers in resource basins, with verticalized brokers optimizing backhaul for drilling equipment. Collectively, these dynamics cement Retail & E-commerce as the prime growth engine for the digital freight matching platforms market, while niche verticals reinforce the importance of segment-specific compliance expertise.
Geography Analysis
North America contributed 38.16% of 2025 revenue thanks to high ELD compliance, mature brokerage ecosystems, and the swift enactment of the Broker Transparency Rule. RXO’s USD 1.025 billion purchase of Coyote Logistics united a portfolio of 100,000 carriers and USD 7 billion in annual freight under a single tech stack, intensifying competitive scale advantages. Canada is catching up through cross-border lanes that link Ontario’s automotive hub with U.S. Midwest warehouses, while Mexico’s near-shoring boom lifted cross-border volumes 14% in 2024, prompting bilingual, peso-denominated apps.
Asia-Pacific is the fastest-growing region, projected at a 35.42% CAGR between 2026-2031. China’s 5G-enabled telematics mandate creates a centralized data lake feeding national load-matching hubs, while India’s Unified Logistics Interface Platform standardizes APIs across state lines, slashing integration costs. Southeast Asia’s e-commerce wave aggregates motorcycle couriers and three-wheelers on digital apps, turning micro-loads into a lucrative niche. Japan’s aging driver population accelerates the adoption of autonomous trucks on the Tokyo-Osaka artery, an early indicator that labor scarcity can catalyze digital uptake.
Europe trails due to linguistic and regulatory fragmentation, but Sennder’s takeover of C.H. Robinson’s EU unit may forge a pan-regional network that eases cross-border booking. The EU Mobility Package tightens cabotage and driver-rest compliance, prompting platforms to embed auto-generated logs that minimize fines. The Middle East and Africa remain nascent, yet Saudi Arabia’s National Transport and Logistics Strategy seeks to trim logistics costs from 13% to 8% of GDP by 2030, creating a policy tailwind. South Africa’s port congestion drives inland freight digitization, while Nigeria’s pilot corridors hint at 25% freight savings through load consolidation.

Competitive Landscape
The largest providers, C.H. Robinson, Uber Freight, XPO, J.B. Hunt 360, and DAT, control the majority of digitally matched North American volume, indicating moderate concentration. Consolidation surged after RXO’s Coyote deal and Sennder’s European acquisition, signaling that scale and exclusive shipper data trump raw technology in today’s digital freight matching platforms market. Strategic differentiation revolves around vertical specialization and embedded finance. For example, Uber Freight bundles fuel cards and same-day pay to lift wallet share per load, whereas DAT leverages Convoy’s payment rails to pivot from data vendor to full-scope broker.
Autonomous procurement agents are the newest battleground, reaching 94% tender acceptance in 15 minutes for platforms deploying reinforcement learning. Broker transparency rules push incumbents to justify take-rates with tangible services, carbon auditing, insurance, and factoring, rather than opaque spreads.
Disruptors unable to layer financial and compliance tools risk margin erosion as load-matching APIs commoditize. The competitive narrative, therefore, favors well-capitalized players that marry deep data lakes, embedded payments, and vertical compliance expertise.
Digital Freight Matching Platforms Industry Leaders
Uber Freight (Uber Technologies, Inc.)
Convoy, Inc
XPO, Inc.
C.H. Robinson
DAT Freight & Analystics
- *Disclaimer: Major Players sorted in no particular order

Recent Industry Developments
- November 2025: Uber Freight teamed with Better Trucks to cut empty miles by 22% on last-mile consolidation lanes in California and Texas.
- July 2025: DAT Freight & Analytics acquired Convoy’s platform assets, integrating carrier payment infrastructure to extend beyond benchmarking into managed freight.
- September 2024: RXO closed its USD 1.025 billion takeover of Coyote Logistics, forming a USD 7 billion revenue platform with 100,000 active carriers.
- September 2024: Sennder acquired C.H. Robinson’s European surface-transportation arm, marking the first venture-backed purchase of a legacy broker’s continental network.


Global Digital Freight Matching Platforms Market Report Scope
Digital freight matching platforms provide shippers and carriers with solutions by connecting in real time. It is a relatively new technology offered through an application or a platform that enables shippers to share their load requirements and assist carriers in finding and booking loads efficiently.
A complete background analysis of the digital freight matching platforms market, including an assessment of the sector and the contribution of the industry to the economy, market overview, market size estimation for critical segments, key regions, and emerging trends in the market segments, market dynamics, and essential production and consumption statistics, are covered in the report.
The digital freight matching platforms market is segmented by service outlook (value-added services and freight matching services), platform outlook (web-based and mobile-based), transportation mode (rail freight, road freight, ocean freight, and air freight ), end user (food & beverages, retail & e-commerce, manufacturing, oil & gas, automotive, healthcare, and other end users) and region (North America, Europe, Asia-Pacific, Latin America, and Middle East and Africa). The report offers market size and forecasts for the digital freight matching platforms market in value (USD) for all the above segments.
| Freight-Matching Services |
| Value-Added Services |
| Web-Based |
| Mobile-Based |
| Rail Freight |
| Road Freight |
| Ocean Freight |
| Air Freight |
| Food and Beverages |
| Retail and E-commerce |
| Manufacturing |
| Oil and Gas |
| Automotive |
| Healthcare |
| Other End-Users |
| North America | United States |
| Canada | |
| Mexico | |
| South America | Brazil |
| Argentina | |
| Rest of South America | |
| Europe | Germany |
| United Kingdom | |
| France | |
| Spain | |
| Italy | |
| Russia | |
| Rest of Europe | |
| Asia-Pacific | China |
| India | |
| Japan | |
| South Korea | |
| Australia and New Zealand | |
| Southeast Asia | |
| Rest of Asia-Pacific | |
| Middle East and Africa | United Arab Emirates |
| Saudi Arabia | |
| Qatar | |
| South Africa | |
| Nigeria | |
| Rest of Middle East and Africa |
| By Service Outlook | Freight-Matching Services | |
| Value-Added Services | ||
| By Platform Outlook | Web-Based | |
| Mobile-Based | ||
| By Transportation Mode | Rail Freight | |
| Road Freight | ||
| Ocean Freight | ||
| Air Freight | ||
| By End-User | Food and Beverages | |
| Retail and E-commerce | ||
| Manufacturing | ||
| Oil and Gas | ||
| Automotive | ||
| Healthcare | ||
| Other End-Users | ||
| By Geography | North America | United States |
| Canada | ||
| Mexico | ||
| South America | Brazil | |
| Argentina | ||
| Rest of South America | ||
| Europe | Germany | |
| United Kingdom | ||
| France | ||
| Spain | ||
| Italy | ||
| Russia | ||
| Rest of Europe | ||
| Asia-Pacific | China | |
| India | ||
| Japan | ||
| South Korea | ||
| Australia and New Zealand | ||
| Southeast Asia | ||
| Rest of Asia-Pacific | ||
| Middle East and Africa | United Arab Emirates | |
| Saudi Arabia | ||
| Qatar | ||
| South Africa | ||
| Nigeria | ||
| Rest of Middle East and Africa | ||


Key Questions Answered in the Report
What is the projected value of the digital freight matching platforms market in 2031?
The market is forecast to reach USD 136.61 billion by 2031, growing at a 28.09% CAGR from 2026 to 2031.
Which region is expected to record the fastest revenue growth?
Asia-Pacific is set to expand at a 35.42% CAGR between 2026-2031, propelled by India’s ULIP rollout and China’s 5G telematics mandate.
Why are value-added services important for digital freight platforms?
Why are value-added services important for digital freight platforms?
How do regulatory changes affect carrier-broker relationships?
How do regulatory changes affect carrier-broker relationships?
What technologies underpin autonomous freight procurement?
What technologies underpin autonomous freight procurement?
How are platforms helping shippers meet Scope 3 carbon reporting mandates?
How are platforms helping shippers meet Scope 3 carbon reporting mandates?
Page last updated on:


