
Diamond Jewelry Market Size and Share
Market Overview
| Study Period | 2021 - 2031 |
|---|---|
| Market Size (2026) | USD 90.12 Billion |
| Market Size (2031) | USD 113.48 Billion |
| Growth Rate (2026 - 2031) | 4.57 % |
| Fastest Growing Market | Europe |
| Largest Market | North America |
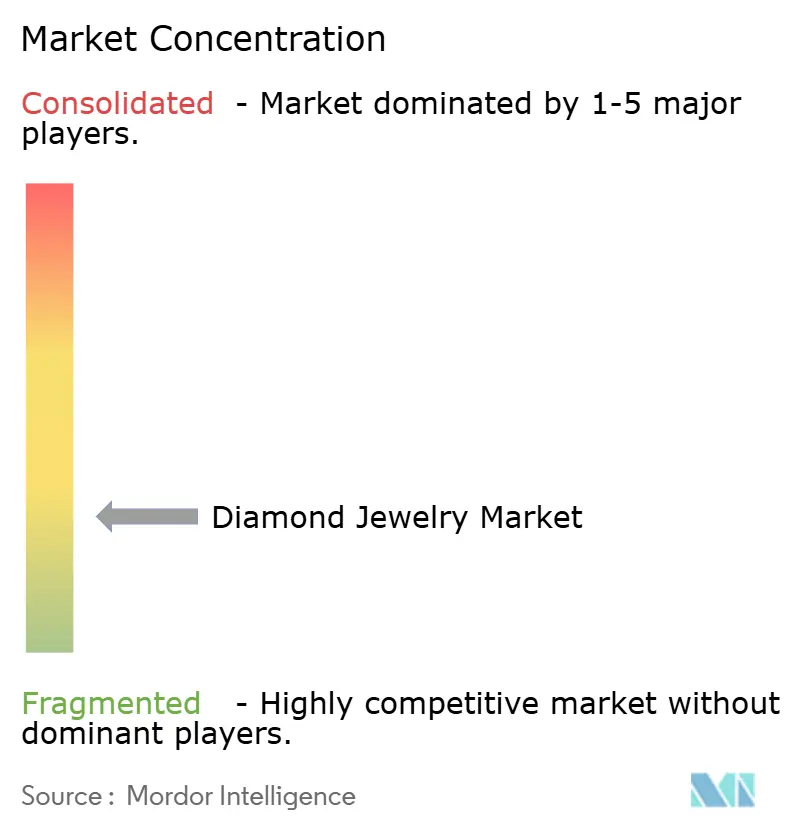
| Market Concentration | Low |
Major Players *Disclaimer: Major Players sorted in no particular order Image © Mordor Intelligence. Reuse requires attribution under CC BY 4.0. | |
Diamond Jewelry Market Analysis by Mordor Intelligence
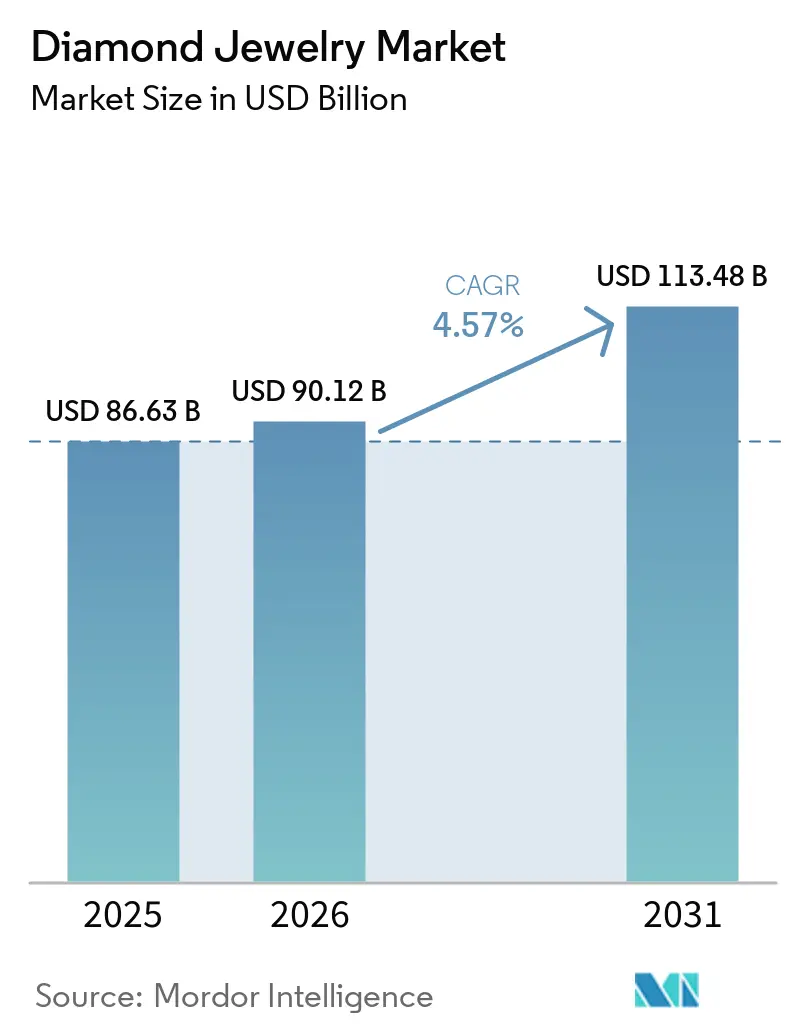
The Diamond jewelry market size was valued at USD 90.12 billion in 2026 and is estimated to reach USD 113.48 billion by 2031, at a CAGR of 4.57% during the forecast period from 2026 to 2031. Demand is separating into accessible lab-grown purchases and higher-value natural diamond purchases. Bridal jewelry remains an important demand base, while gifting and self-purchase occasions are expanding the role of non-bridal formats. Supply reductions by major natural diamond producers may support premium positioning but can also raise input-cost pressure for manufacturers. Digital selling is growing faster than store-based selling, although physical retail remains central to high-value purchases that require product inspection and trust. The Diamond jewelry market is therefore shaped by both broader access to diamond jewelry and a stronger focus on provenance, certification, and premium customer experience.
Key Report Takeaways
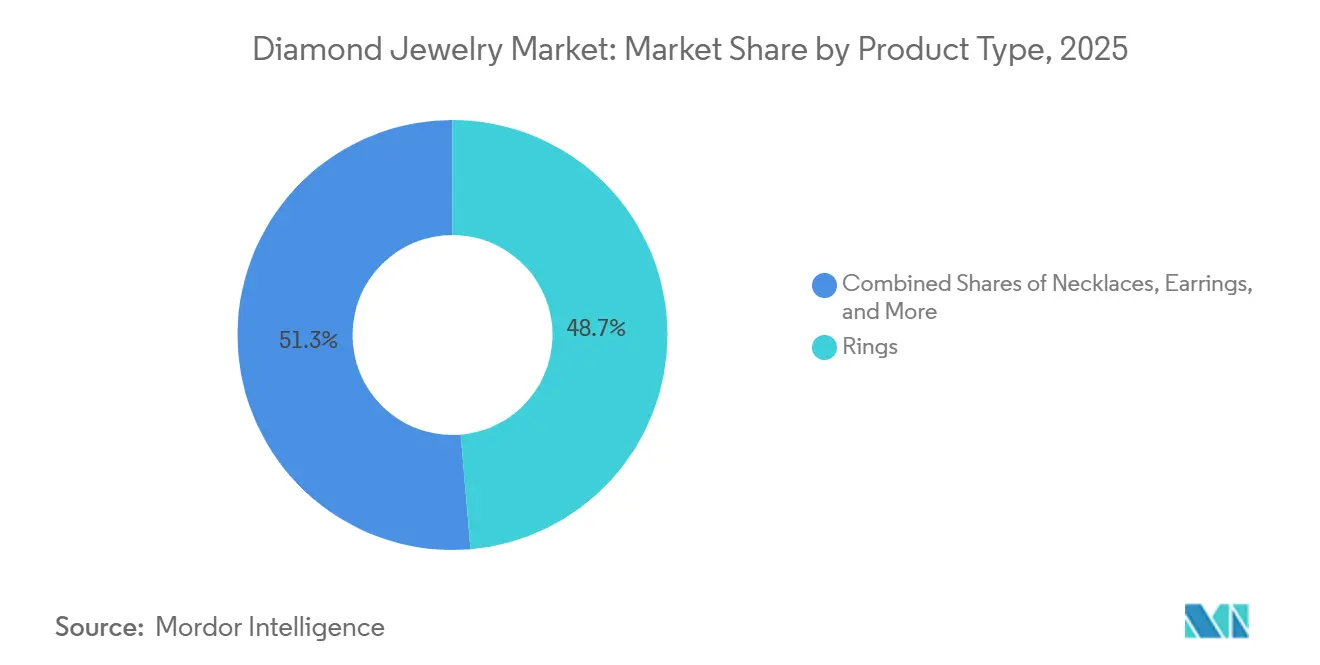
- By product type, rings held 48.67% of the Diamond jewelry market share in 2025, while necklaces are forecast to grow at a 6.24% CAGR through 2031.
- By diamond type, lab-grown diamonds held 65.43% of the Diamond jewelry market share in 2025, while natural diamonds are forecast to advance at a 6.35% CAGR through 2031.
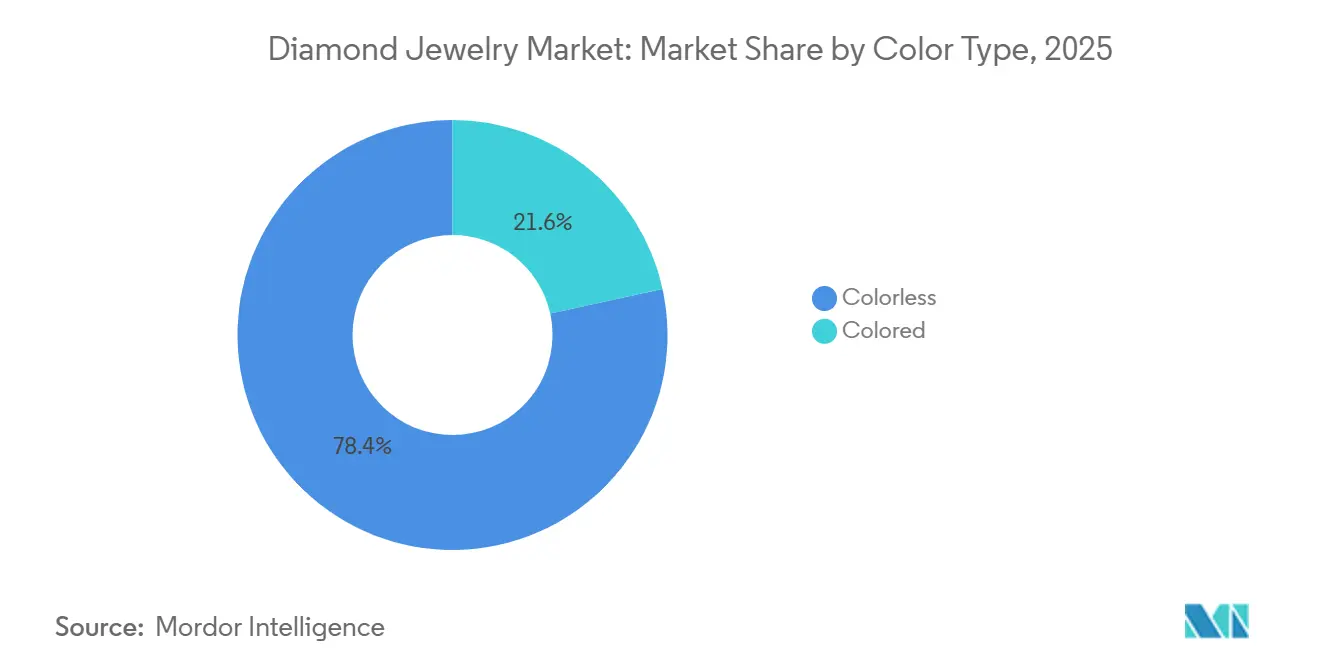
- By color type, colorless diamonds accounted for 78.43% of the Diamond jewelry market size in 2025, while colored diamonds are projected to grow at a 5.82% CAGR through 2031.
- By metal type, gold held 42.83% of the Diamond jewelry market size in 2025, while platinum is forecast to expand at a 5.79% CAGR through 2031.
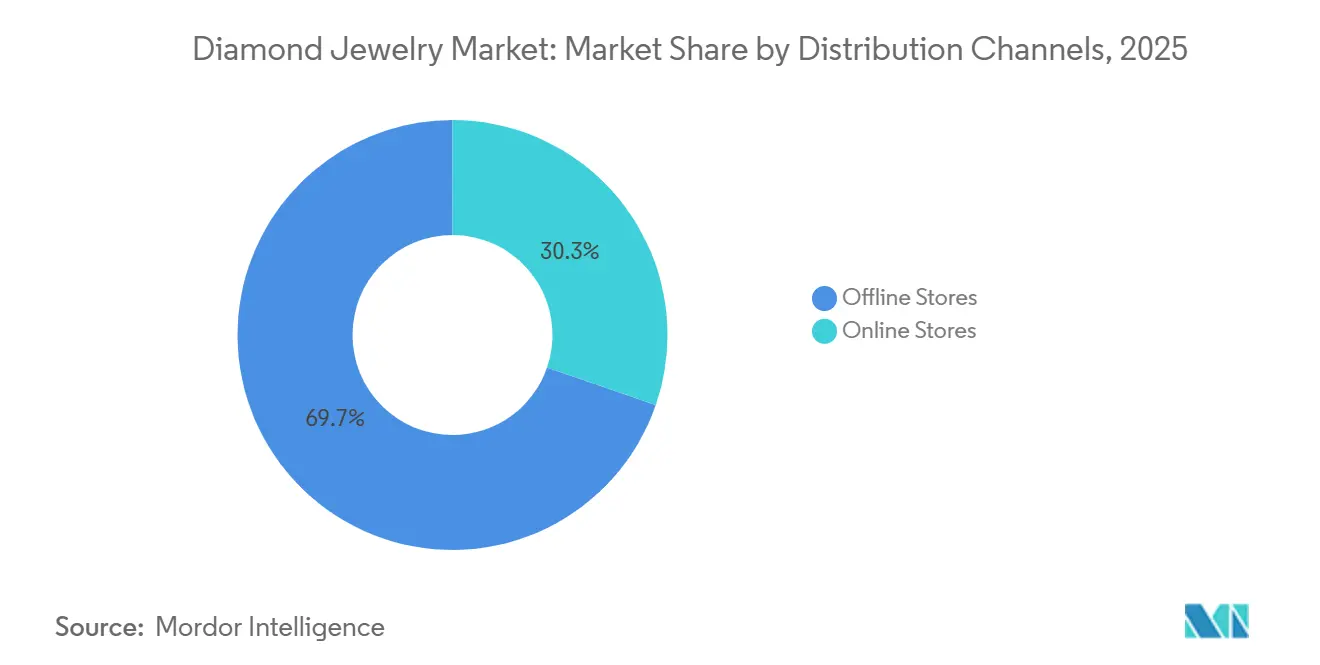
- By distribution channel, offline stores accounted for 69.72% of the 2025 value, while online stores are forecast to grow at a 6.21% CAGR through 2031.
Note: Market size and forecast figures in this report are generated using Mordor Intelligence’s proprietary estimation framework, updated with the latest available data and insights as of January 2026.
Market Trends and Insights
Drivers Impact Analysis of Diamond Jewelry Market*
| Driver | (~) % Impact on CAGR Forecasts | Geographic Relevance | Impact Timeline |
|---|---|---|---|
| Growing demand for bridal and wedding jewelry | +1.2% | Global; North America, India, China | Short term |
| Increasing jewelry customization | +0.8% | Global; North America, W. Europe | Medium term |
| Rising influence of social media and celebrity culture | +0.7% | Global; North America, Europe, APAC | Short term |
| Growing demand for sustainable and ethically sourced diamonds | +0.5% | North America, Europe; spill to India, MEA | Medium term |
| Product innovation and contemporary designs | +0.6% | Global; led by North America & W. Europe | Medium term |
| Increasing preference for luxury and premium products | +0.4% | Global; North America, Europe, MEA luxury hubs | Long term |
| Source: Mordor Intelligence | |||
Growing Demand for Bridal and Wedding Jewelry
Bridal purchases continue to support the Diamond jewelry market because a ring is part of most proposal occasions. The Knot reported that nearly 9 in 10 proposers gave a ring during the proposal, while lab-grown center stones represented 61% of U.S. engagement-ring purchases by unit count in 2026. The same study reported average engagement-ring spending of USD 4,600 and an average center stone size of 1.9 carats. Natural diamond sales at U.S. independent jewelers increased 4% in Q4 2025 and 9% in Q1 2026, with demand concentrated in stones of 1 carat or more. In India, bridal and wedding occasions accounted for 86% of natural diamond consumption, while self-gifting and anniversary purchases broadened repeat demand. The Kimberley Process covers more than 99% of global rough diamond trade, making its certification a core trust requirement for retailers serving bridal buyers
Increasing Jewelry Customization
Customization is becoming a standard part of the Diamond jewelry market, especially in mid-priced and premium engagement jewelry. The supplied research indicates that 88% of U.S. couples selected customized engagement rings in 2025, shifting demand from standard catalog products toward tailored designs. Natural Diamond Council research identified nostalgia, self-expression, and vintage styles as major consumer themes, supporting demand for Art Deco cuts, stacked rings, and heirloom-style settings[1]. Lower per-carat lab-grown diamond prices give buyers more budget for metalwork, engraving, and fancy cuts. This makes customized jewelry more accessible across the USD 2,000 to USD 6,000 price range. Brands that combine design consultation with clear diamond information can improve conversion without relying only on promotional pricing.
Rising Influence of Social Media and Celebrity Culture
Social media shortens the time between a visible design moment and retail demand in the Diamond jewelry market. Natural Diamond Council and Tenoris data linked Selena Gomez’s engagement announcement, which featured a marquise ring, to higher sales of marquise-cut diamonds among U.S. specialty jewelers. De Beers reported that Gen Z represented 18% of U.S. natural diamond purchasers and 23% of demand by value in 2026. The group also reported 1.83 annual purchase occasions for Gen Z buyers, compared with an industry average of 1.7 occasions. Bridal purchases accounted for 45% of Gen Z natural diamond demand in this research. Faster trend cycles are encouraging brands to use smaller capsule collections and limited editions that reflect changing tastes without extending inventory risk.
Growing Demand for Sustainable and Ethically Sourced Diamonds
Ethical sourcing has become a commercial requirement in the Diamond jewelry market, rather than a limited brand claim. The Kimberley Process chair in 2026 called for stronger traceability standards, digital communication, and improved management of financial integrity risks. De Beers introduced its ORIGIN branded polished diamond program in North America in 2025 through 19 retail partners, using the Tracr platform to provide mine-to-market provenance. The program gives participating retailers a verifiable product history that can support customer discussions on origin. The Luanda Accord linked diamond-producing countries with category marketing investment in 2025, placing provenance messaging alongside demand-generation activity. Lab-grown diamonds can avoid mining-related land use, although their CVD and HPHT production methods still require substantial energy. Clear evidence on source and production method can therefore matter more than broad sustainability claims.
Restraints Impact Analysis of Diamond Jewelry Market*
| Restraint | (~) % Impact on CAGR Forecasts | Geographic Relevance | Impact Timeline |
|---|---|---|---|
| High cost of natural diamond jewelry | -0.9% | Global; acute in APAC emerging markets | Medium term |
| Competition from alternative gemstones | -0.7% | Global; North America, Europe | Medium term |
| Consumer concerns about authenticity and transparency | -0.5% | Global; North America, Europe; spill to APAC | Medium term |
| Availability of alternative imitation jewelry | -0.4% | Global; APAC and North America mid-market | Short term |
| Source: Mordor Intelligence | |||
High Cost of Natural Diamond Jewelry
The cost of natural diamond jewelry remains a constraint because buyers can compare it directly with lower-priced lab-grown stones. The supplied research reported that an unbranded 1-carat round lab-grown diamond cost USD 845 in Q1 2025, compared with USD 3,895 for a comparable natural stone. De Beers identified the 0.3 to 1-carat natural diamond range as the area most affected by synthetic diamond demand. Record gold prices in 2025 increased the total cost of jewelry with gold settings, particularly for buyers with fixed budgets. The challenge is greater in developing retail markets, where resale options for natural diamond jewelry are less formalized. Premium products retain more pricing power, while the mid-priced natural diamond segment faces continuing pressure on purchase volume.
Competition from Alternative Gemstones
Alternative gemstones are competing for purchase occasions that traditionally favored diamonds in the Diamond jewelry market. Colored sapphires, emeralds, rubies, and moissanite provide more choices for buyers who prioritize design distinction over the traditional diamond status signal. Pandora expanded its material range in 2026 with platinum-plated designs while continuing its development of lab-grown diamond jewelry. Research from The Plumb Club found that 37% of U.S. consumers lacked enough information to distinguish natural and lab-grown diamonds. YouGov found that 29% of U.K. adults would consider a lab-grown diamond, rising to 49% among adults aged 18 to 24[2]. Diamond certification remains an important differentiator in bridal jewelry, where buyers often place a high value on independently documented quality.
*Our forecasts treat driver/restraint impacts as directional, not additive. The impact forecasts reflect baseline growth, mix effects, and variable interactions.
Diamond Jewelry Market Segment Analysis
By Product Type:
Necklaces and Non-Bridal Formats Gain Structural MomentumRings held 48.67% of 2025 product value and remained the largest product category in the Diamond jewelry market. Their position reflects the continuing importance of engagement rings across major consumer regions. Necklaces are forecast to grow at a 6.24% CAGR through 2031 as lower lab-grown diamond prices extend access to tennis necklaces, layered pendants, and statement chains. The supplied research showed that tennis bracelets rose from 3.5% of lab-grown diamond product sales in 2020 to 11.9% in 2025. This shift indicates that buyers are using diamonds in more everyday formats, rather than only for an engagement purchase.
Earrings remain an accessible entry format for first-time buyers, particularly in Asia-Pacific. Pendants and chains are increasingly promoted as unisex jewelry, including within the expanding male fine-jewelry category. De Beers introduced its Desert Diamonds Icons campaign in 2026 around the eternity band, tennis bracelet, and halo pendant. These 3 formats accounted for 70% of diamond jewelry acquisitions in the supplied research. De Beers also reported that gifting represented 44% of natural diamond jewelry sales in 2025 and self-purchases represented 31%. Expanding these occasions helps balance product demand across the Diamond jewelry industry.

By Diamond Type:
Natural Diamonds Rebuild Premium Value as Supply ContractsLab-grown diamonds held 65.43% of the 2025 diamond-type value in the Diamond jewelry market. Their position rests on lower prices and their broad acceptance in engagement-ring center stones. Natural diamonds are forecast to grow at a faster 6.35% CAGR through 2031, supported by lower supply and premium positioning. De Beers reported that natural diamonds represented 85% of independent jewelers’ diamond sales by value in 2025, compared with 15% for lab-grown diamonds. Value patterns therefore differ from purchase-unit patterns across this category.
Natural diamond production is expected to remain constrained as mines close, and producers reduce output. Antwerp World Diamond Centre reported 105 million carats of global production in 2025, down 13% from 2022[3]. De Beers’ 2026 production guidance of 21 to 26 million carats reflects the same tighter supply environment. The supplied research also indicated slower sales of lab-grown stones weighing 3 carats or more. That result suggests that larger stones do not always create proportional demand once size is no longer the primary constraint. Natural diamonds can benefit when brands connect rarity and provenance with self-expression rather than relying only on bridal tradition.
By Color Type:
Warm-Toned Diamonds Expand the Addressable BaseColorless diamonds held 78.43% of the 2025 color-type value, making them the leading part of the Diamond jewelry market. Their position is supported by the established D to Z grading system and its role in bridal buying decisions. Colored diamonds are projected to grow at a 5.82% CAGR through 2031. De Beers reported 15% year-over-year sales growth for colored and low-colored natural diamonds at U.S. specialty retailers in Q4 2025. The same products recorded 19% year-over-year growth in Q1 2026 after the Desert Diamonds campaign.
Warm white, champagne, and K to Z natural diamonds offer a route to broaden the available range without competing only on the highest color grades. De Beers positioned these diamonds through a campaign centered on individuality and rarity. The supplied research noted a split in China between collectible colored stones and top-grade colorless diamonds, which retained premiums, and commercial-grade colorless diamonds, which faced lab-grown competition. Certified natural fancy colors remain important for high-value jewelry because independent grading makes rarity easier to explain. At the same time, colorless stones continue to play a central supporting role in multi-stone high-jewelry designs. A wider color offering can help retailers serve buyers seeking design variation without leaving the diamond category.
By Metal Type:
Platinum’s Value Proposition Strengthens Against High Gold PricesGold held 42.83% of 2025 metal-type value in the Diamond jewelry market. Its leading position reflects cultural importance in Asian bridal jewelry and its association with stored value in South Asian and Middle Eastern markets. Platinum is forecast to grow at a 5.79% CAGR through 2031. The World Platinum Investment Council reported that global platinum jewelry demand grew 7% in 2025 to 2,157 thousand ounces, its highest level since 2018. The growing price gap between platinum and gold improved platinum’s appeal for retailers and buyers.
China’s platinum jewelry fabrication increased 56% to 589,000 ounces in 2025, according to the supplied research, as retailers shifted inventory from gold toward platinum. In Japan, platinum represented 28% of unit sales, reflecting the country’s long-established preference for the metal. North American platinum jewelry demand grew 6% in 2025, while more than 75% of surveyed fine-jewelry retailers planned to expand platinum inventory in 2026. Silver and other metals remain relevant at entry price points, but higher input costs are increasing material substitution. Pandora launched platinum-plated versions of key bracelets after silver costs more than doubled in 2025. This response shows how metal selection is becoming an active commercial decision across price tiers.
By Distribution Channel:
Omnichannel Integration Separates Leaders from LaggardsOffline stores accounted for 69.72% of 2025 distribution value in the Diamond jewelry market. In-person service remains important for natural diamond purchases that require visual comparison, authentication, and detailed advice. Online stores are forecast to grow at a 6.21% CAGR through 2031. Remote sales work well for lab-grown diamonds because standardized grading certificates and transparent prices can reduce buyer uncertainty. Online growth is therefore likely to be strongest where purchase criteria can be explained clearly without a store visit.
Signet acquired The Clear Cut to support Blue Nile’s premium natural diamond positioning, combining digital education with broader inventory access. Brilliant Earth reported 43 U.S. showrooms and USD 437 million in FY2025 net sales, showing that an online-first model can scale with a focused physical presence. The company recorded 210,158 orders in FY2025, up 13% from the previous year. The supplied research reported an 81.4% jewelry e-commerce cart abandonment rate, reflecting continuing trust and product-evaluation challenges. Digital tools can improve discovery and convenience, but physical retail retains a strong role for higher-value purchases. The Diamond jewelry industry requires retailers to link online information, product availability, and store-level service into a consistent customer journey.
Geography Analysis
North America Diamond Jewelry Market
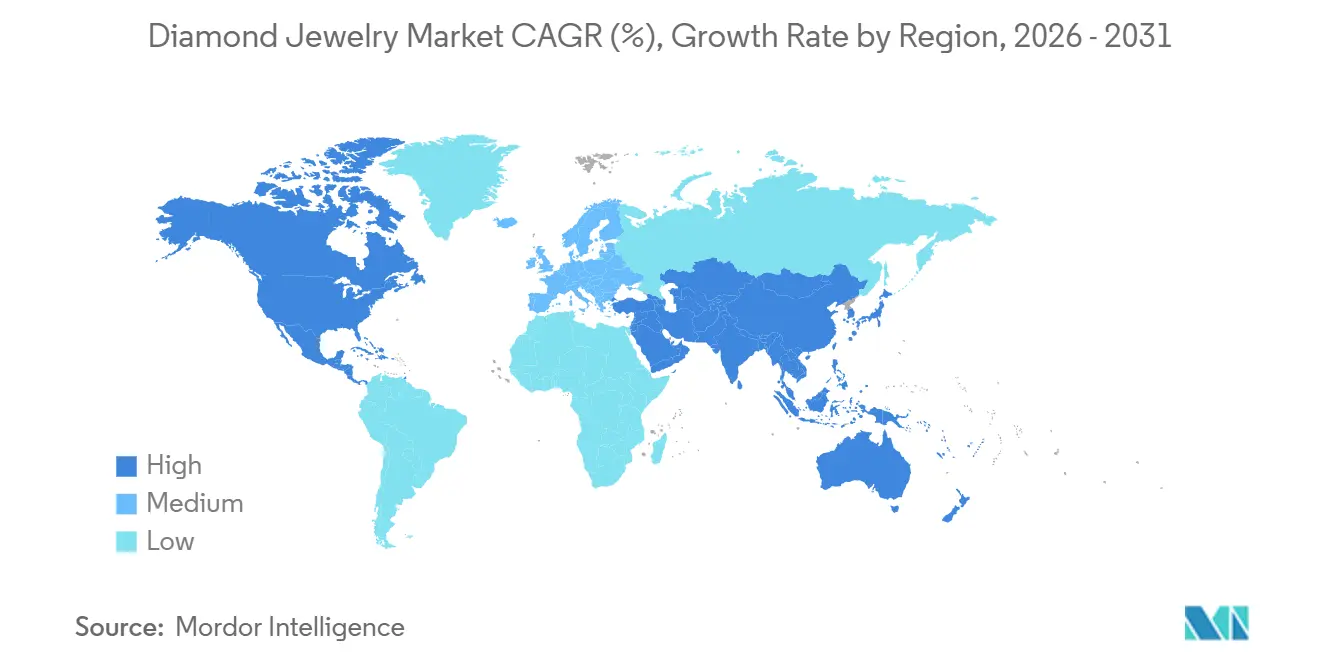
North America held 38.28% of global value in 2025, making it the largest regional part of the Diamond jewelry market. The United States represented 53% of global natural diamond jewelry demand in the supplied research. U.S. jewelry revenue grew 9% in H1 2026, with natural diamonds gaining through higher average selling prices and lab-grown diamonds gaining through higher unit sales. Signet reported FY2026 sales of USD 6.81 billion, same-store sales growth of 1.3%, and an average unit retail price increase of 7%. De Beers Group was available through 19 retail partners at 30 locations in the United States and Canada in 2025, providing retailers with a traceability-based product proposition.
Europe Diamond Jewelry Market
Europe is forecast to grow at a 5.68% CAGR through 2031, the fastest regional rate in the Diamond jewelry market. Richemont’s Jewelry Maisons recorded 8% sales growth in FY2026 to EUR 16.5 billion, equivalent to USD 19.2 billion, and reported double-digit growth in Europe. European platinum jewelry fabrication grew 6% in 2025, marking its fifth consecutive year of growth. Germany, the United Kingdom, France, Italy, and Spain remain important demand centers. Antwerp’s 2025 diamond trade totaled USD 19.07 billion, with polished diamonds accounting for 65.6% of the total.
APAC, South America and MEA Diamond Jewelry Market
Asia-Pacific remains highly varied across the Diamond jewelry market. India captured 12% of global natural diamond demand in 2025, compared with 5% each for China and Japan. Kalyan Jewellers reported FY2026 revenue of INR 35,743 crore, equivalent to USD 4.2 billion, up 43% year over year. China is seeing stronger natural diamond demand among younger, higher-income buyers, while lab-grown products continue to pressure the natural diamond mid-market. South America has demand centered on branded luxury retail and urban e-commerce, while new trade routes may support more competitive supply. The Middle East and Africa benefit from Dubai’s role as a trading hub, and Richemont identified the region as a leading area for wholesale and online growth in FY2026.
Competitive Landscape
The Diamond jewelry market is fragmented in nature, reflecting a fragmented structure in which no company holds more than a mid-single-digit share of global revenue. Luxury groups compete through brand recognition, design expertise, high-jewelry events, and direct client relationships. Richemont’s Jewelry Maisons include Cartier, Van Cleef & Arpels, Buccellati, and Vhernier. The group reported 7 consecutive quarters of double-digit jewelry sales growth by Q1 FY2027. Its FY2026 jewelry sales reached EUR 16.5 billion, equivalent to USD 19.2 billion.
Specialty retailers compete on assortment, financing, customer service, and the connection between stores and online platforms. Signet generated FY2026 sales of USD 6.81 billion, with average unit retail increasing 7%. Brilliant Earth raised its 2026 adjusted EBITDA guidance after reporting Q2 adjusted EBITDA of USD 5.8 million, up 81.3% year over year. Chow Tai Fook plans to increase its international store count from 8 to 50 by FY2030, including new locations in Sydney and Singapore. This strategy expands the group’s access to consumers outside its traditional home markets. The Diamond jewelry market therefore offers space for companies that can serve mid-priced buyers with credible sourcing, design variety, and transparent pricing.
Technology is increasingly affecting competition through product traceability and online selling. De Beers’ Tracr platform is used in supply chain operations with Signet and Chow Tai Fook, enabling a documented mine-to-market record. India chaired the Kimberley Process in 2026 and called for stronger digital traceability requirements. Smaller suppliers may find it harder to meet these documentation expectations. Richemont reported that direct-to-client sales represented 85% of Jewelry Maisons sales in Q3 FY2026. Direct relationships allow major luxury brands to manage client experience and preserve margins. These conditions favor brands that can combine product origin records with high-quality service across every sales channel.
Diamond Jewelry Industry Leaders
-
Signet Jewelers Limited
-
De Beers Group
-
LVMH Moët Hennessy Louis Vuitton SE
-
Richemont SA
-
Titan Company Limited
- *Disclaimer: Major Players sorted in no particular order
Diamond Jewelry Market Companies Covered in this Report
- De Beers Group
- Signet Jewelers Limited
- Chow Tai Fook Jewellery Group Limited
- LVMH Moët Hennessy Louis Vuitton SE
- Richemont SA
- Pandora A/S
- Brilliant Earth, Inc.
- Blue Nile, Inc.
- James Allen
- Kalyan Jewellers India Limited
- Titan Company Limited
- Malabar Gold & Diamonds
- Joyalukkas India Pvt. Ltd.
- Graff Diamonds Limited
- Swatch Group
- Harry Winston, Inc.
- Swarovski AG
- ALROSA PJSC
- Rio Tinto Diamonds
- Petra Diamonds Limited
Recent Industry Developments in Diamond Jewelry Market
- June 2026: Titan Company launched beYon, its first dedicated lab-grown diamond jewelry brand, targeting Gen Z and millennial consumers. The brand introduced more than 1,250 designs across earrings, rings, pendants, necklaces, bracelets, bangles, and nosepins, with prices starting at approximately USD 240.
- January 2026: GemFair and De Beers London launched a 12-piece capsule jewelry collection featuring ethically sourced, artisanal-mined diamonds for the first time. The collection combines rough and polished GemFair diamonds, with each polished stone handcrafted for the pieces.
- November 2025: De Beers introduced its Origin diamond jewelry brand in North America, expanding its retail presence with a collection positioned around the provenance and natural origin of its diamonds. The launch highlights De Beers’ focus on diamond traceability, responsible sourcing, and consumer demand for verified natural diamonds, while strengthening its differentiation from lab-grown alternatives.
Global Diamond Jewelry Market Report Scope
Segmentation Overview
| Rings |
| Necklaces |
| Earrings |
| Bracelets |
| Pendants |
| Chains |
| Other Product Types |
| Natural |
| Lab-Grown |
| Colored |
| Colorless |
| Gold |
| Silver |
| Platinum |
| Other Metals |
| Online Stores |
| Offline Stores |
| North America | United States |
| Canada | |
| Mexico | |
| Rest of North America | |
| Europe | Germany |
| United Kingdom | |
| France | |
| Italy | |
| Spain | |
| Netherlands | |
| Sweden | |
| Poland | |
| Belgium | |
| Rest of Europe | |
| Asia-Pacific | China |
| India | |
| Japan | |
| Australia | |
| South Korea | |
| Vietnam | |
| Indonesia | |
| Rest of Asia-Pacific | |
| South America | Brazil |
| Argentina | |
| Chile | |
| Peru | |
| Colombia | |
| Rest of South America | |
| Middle East and Africa | United Arab Emirates |
| Saudi Arabia | |
| South Africa | |
| Nigeria | |
| Rest of Middle East and Africa |
| Product Type | Rings | |
| Necklaces | ||
| Earrings | ||
| Bracelets | ||
| Pendants | ||
| Chains | ||
| Other Product Types | ||
| Diamond Type | Natural | |
| Lab-Grown | ||
| Color Type | Colored | |
| Colorless | ||
| Metal Type | Gold | |
| Silver | ||
| Platinum | ||
| Other Metals | ||
| Distribution Channel | Online Stores | |
| Offline Stores | ||
| By Geography | North America | United States |
| Canada | ||
| Mexico | ||
| Rest of North America | ||
| Europe | Germany | |
| United Kingdom | ||
| France | ||
| Italy | ||
| Spain | ||
| Netherlands | ||
| Sweden | ||
| Poland | ||
| Belgium | ||
| Rest of Europe | ||
| Asia-Pacific | China | |
| India | ||
| Japan | ||
| Australia | ||
| South Korea | ||
| Vietnam | ||
| Indonesia | ||
| Rest of Asia-Pacific | ||
| South America | Brazil | |
| Argentina | ||
| Chile | ||
| Peru | ||
| Colombia | ||
| Rest of South America | ||
| Middle East and Africa | United Arab Emirates | |
| Saudi Arabia | ||
| South Africa | ||
| Nigeria | ||
| Rest of Middle East and Africa | ||
Key Questions Answered in the Report
What is the projected size of the diamond jewelry sector by 2031?
The sector is projected to reach USD 113.48 billion by 2031, growing at a CAGR of 4.57% from 2026.
Which product category leads diamond jewelry sales?
Rings led product value with a 48.67% share in 2025, supported by engagement and wedding purchases.
Are lab-grown or natural diamonds growing faster?
Natural diamonds are forecast to grow faster at a 6.35% CAGR through 2031, while lab-grown diamonds held 65.43% of 2025 value.
Why is platinum gaining importance in diamond jewelry?
Platinum is forecast to grow at a 5.79% CAGR as its price position versus gold supports retailer inventory decisions and consumer demand.