Defense Manned-Unmanned Teaming Systems Market Size and Share
Market Overview
| Study Period | 2019 - 2030 |
|---|---|
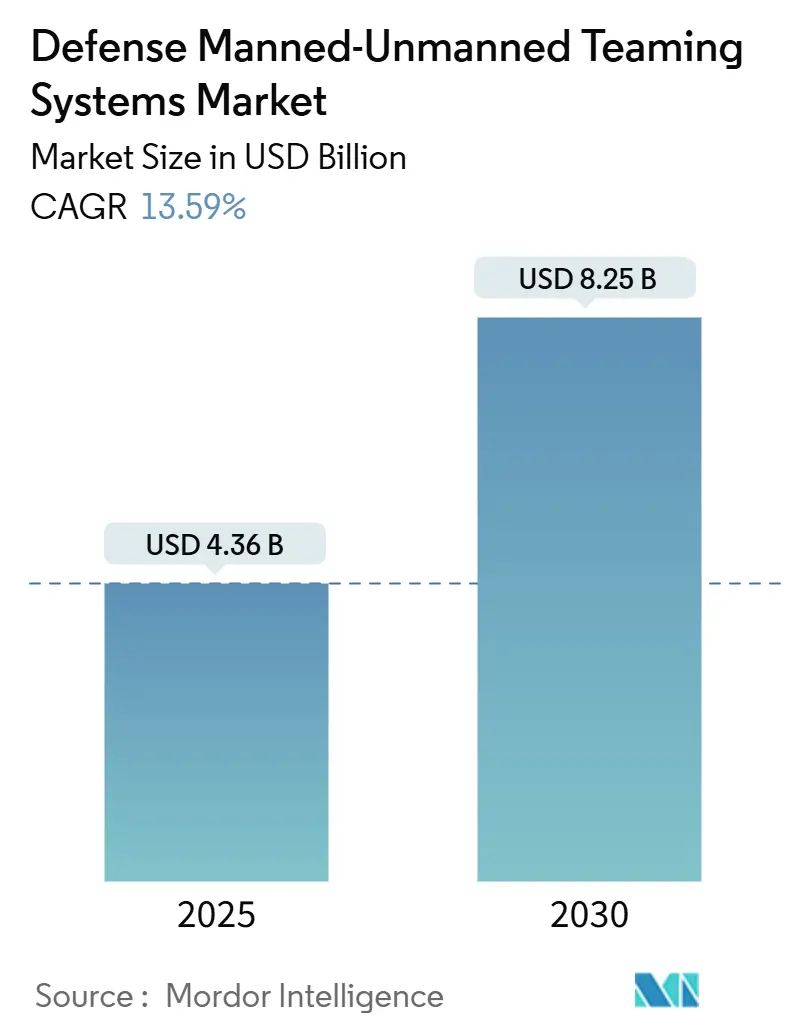
| Market Size (2025) | USD 4.36 Billion |
| Market Size (2030) | USD 8.25 Billion |
| Growth Rate (2025 - 2030) | 13.59% CAGR |
| Fastest Growing Market | North America |
| Largest Market | North America |
| Market Concentration | Medium |
Major Players *Disclaimer: Major Players sorted in no particular order Image © Mordor Intelligence. Reuse requires attribution under CC BY 4.0. | |
Defense Manned-Unmanned Teaming Systems Market Analysis by Mordor Intelligence
The defense manned–unmanned teaming systems (MUM-T) market size is estimated at USD 4.36 billion in 2025 and is projected to reach USD 8.25 billion by 2030, representing a 13.59% CAGR. Momentum stems from doctrinal shifts emphasizing distributed human-machine operations, fast-evolving artificial intelligence (AI), and secure low-latency communications linking crewed and autonomous platforms across every combat domain. Accelerated funding for the Pentagon’s Joint All-Domain Command and Control (JADC2) architecture, NATO rotorcraft modernization mandates, and loyal-wingman demonstration successes extend the addressable defense MUM-T systems market beyond legacy aerospace programs into ground and maritime arenas. Software-defined upgrades now pace capability rollouts, narrowing time from concept to fielding and allowing defense ministries to harvest commercial AI innovation cycles inside traditional platform life spans. Meanwhile, cyber-hardening and mixed-fleet certification costs temper near-term adoption, compelling vendors to design modular security packages that survive contested electromagnetic environments without pricing smaller allied forces out of the market.
Key Report Takeaways
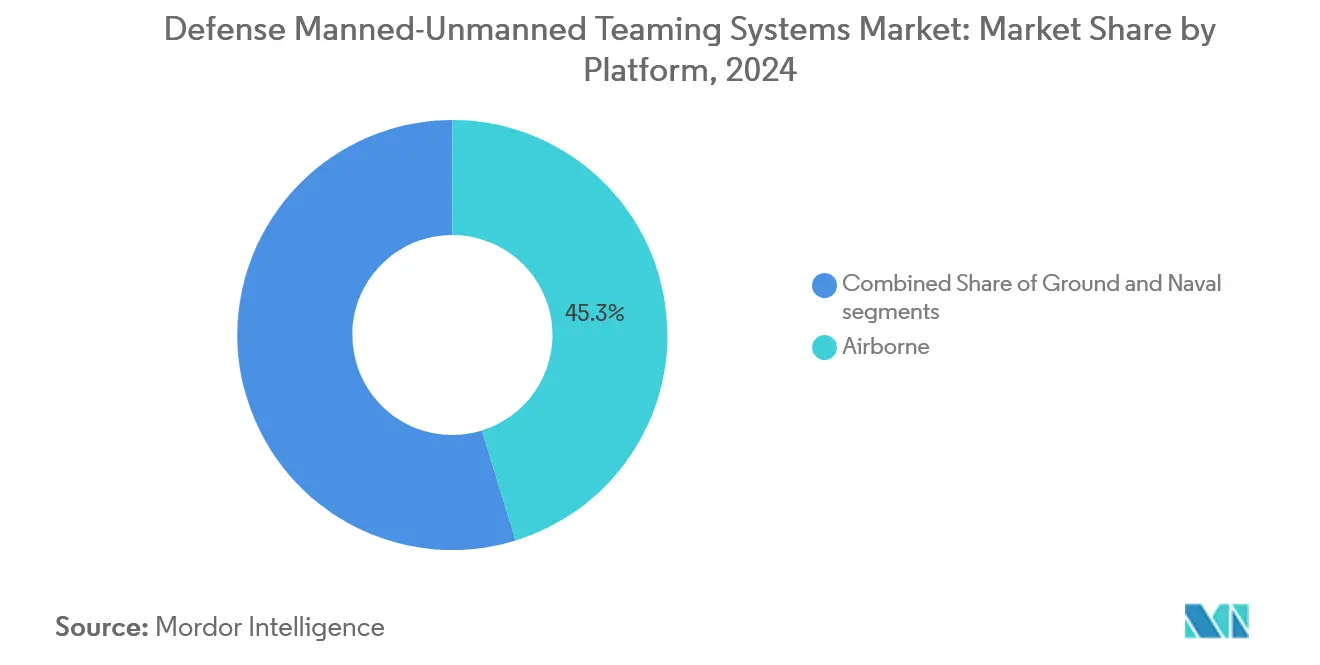
- By platform, airborne systems led with a 45.25% share of the defense manned–unmanned teaming systems market in 2024, while naval solutions recorded the fastest projected CAGR at 15.71% through 2030.
- By level of autonomy, collaborative autonomy (LOA 3) captured 42.75% of the defense MUM-T systems market share in 2024; swarm autonomy (LOA 5) is on track for a 15.71% CAGR to 2030.
- By offering, hardware accounted for 55.32% of the defense MUM-T systems market size in 2024, whereas software solutions are forecasted to expand at a 14.91% CAGR.
- By application, ISR dominated with 45.69% revenue share in 2024; combat operations are advancing at a 14.52% CAGR through 2030.
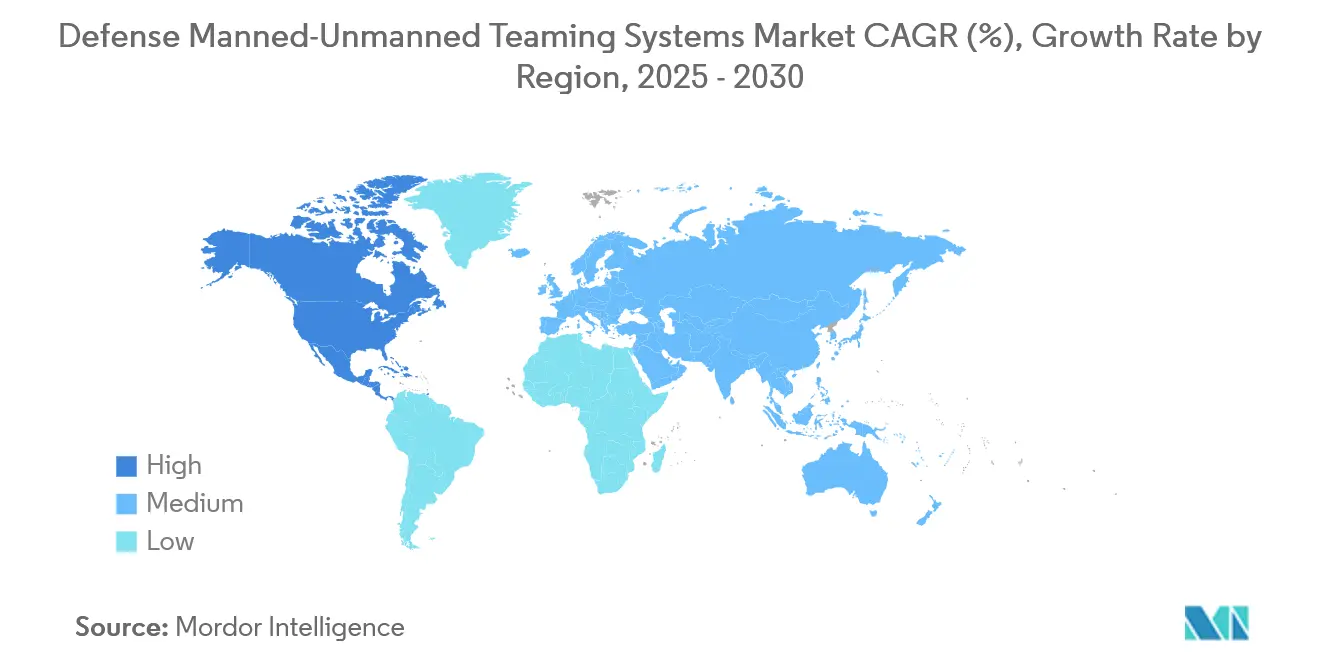
- By geography, North America led with 38.22% of global revenue in 2024 and is projected to register the highest regional CAGR of 16.23% over the outlook period.
Global Defense Manned-Unmanned Teaming Systems Market Trends and Insights
Drivers Impact Analysis*
| Driver | (±) % Impact on CAGR Forecast | Geographic Relevance | Impact Timeline |
|---|---|---|---|
| Rapid fielding of optionally piloted combat aircraft | +2.8% | North America and Europe, spill-over to Asia-Pacific | Medium term (2-4 years) |
| DoD JADC2 funding surge | +3.1% | Global, focus on North America and Indo-Pacific | Long term (≥ 4 years) |
| NATO Next-Generation Rotorcraft (NGRC) integration mandates | +2.9% | Europe and NATO allies, partner nations | Medium term (2-4 years) |
| AI-powered swarming algorithms enabling low-latency teaming | +2.7% | Global, early in North America and Asia-Pacific | Short term (≤ 2 years) |
| Quad-funded Indo-Pacific deterrence programs | +1.8% | Asia-Pacific core, allied nations | Long term (≥ 4 years) |
| Growing demand for integrated manned–unmanned combat operations | +0.5 | Global, focus on North America and Indo-Pacific | Long term (≥ 4 years) |
| Source: Mordor Intelligence | |||
Rapid Fielding of Optionally Piloted Combat Aircraft
The rapid fielding of optionally piloted combat aircraft drives the defense MUM-T systems market as militaries seek flexible platforms that can switch between manned and unmanned modes. The USD 20 billion Next Generation Air Dominance (NGAD) award underpins the Pentagon’s move toward aircraft that switch between crewed and uncrewed modes, cutting training costs, extending mission endurance, and shielding pilots from high-risk penetration strikes.[1]Boeing, “Boeing Awarded NGAD Contract for Next Generation Air Dominance Program,” boeing.com Comparable European roadmaps within the Future Combat Air System (FCAS) synchronize procurement, creating a cross-Atlantic pipeline of interchangeable loyal-wingman assets that lowers incremental unit cost as volumes scale. This capability enhances mission adaptability, reduces pilot risk, and accelerates integration of unmanned teaming concepts into existing force structures for operational superiority.
DoD Joint-All-Domain Command-and-Control Funding Surge
The surge in DoD funding for JADC2 is significantly accelerating the adoption of MUM-T systems. JADC2 emphasizes seamless connectivity, data fusion, and rapid decision-making across air, land, sea, space, and cyber domains. Increased funding enables faster development of interoperable networks that allow manned aircraft, ground systems, and unmanned platforms to coordinate in real time. JADC2’s USD 4.7 billion fiscal-2024 allocation formalizes a network layer where defense MUM-T systems act as data-rich nodes, allowing commanders to collapse sensor-to-shooter cycles and apply effects faster than adversaries can react.[2]U.S. Department of Defense, “Joint All-Domain Command and Control Implementation Strategy,” defense.gov Open-architecture mandates within JADC2 attract non-traditional software firms, accelerating algorithm diversity while disrupting long-standing prime-sub hierarchies. By enhancing situational awareness, speeding response cycles, and supporting precision targeting, this investment directly boosts demand for advanced MUM-T solutions. Ultimately, JADC2 funding ensures MUM-T integration becomes central to modern force structures, enabling superior multi-domain operations and battlefield dominance.
NATO Next-Generation Rotorcraft Integration Mandates
NATO’s mandates for integrating next-generation rotorcraft propel the defense MUM-T systems market, as allied nations prepare fleets that can seamlessly operate with unmanned platforms. These requirements emphasize interoperability, digital connectivity, and advanced mission adaptability, making MUM-T a baseline capability for future rotorcraft. The alliance’s 2025 approval of NGRC requirements compels every member nation to embed MUM-T capabilities in helicopter fleets by 2028, establishing common standards that shrink integration risk and concentrate European demand on a narrower set of compliant platforms.[3]NATO, “Next-Generation Rotorcraft Capability Requirements Approved,” nato.int These rules spill over to partner states in the Indo-Pacific, multiplying export prospects for Airbus, Leonardo, and emerging US competitors. By driving investments in common standards, modular architectures, and unmanned teaming technologies, NATO ensures coalition forces can achieve unified mission execution, improved situational awareness, and reduced operational risks. The integration mandates accelerate demand for MUM-T solutions, as rotorcraft modernization programs across member states prioritize manned–unmanned collaboration as a key enabler of next-generation battlefield effectiveness.
AI-Powered Swarming Algorithms
AI-powered swarming algorithms drive the MUM-T market by enabling coordinated, autonomous behaviors among unmanned assets that multiply mission effects. DARPA’s 100-plus-drone swarm tests validated sub-second decision loops that allow one operator to command many vehicles, reducing manpower footprints and enabling small forces to achieve distributed mass at scale.[4]DARPA, “Autonomous Swarm Demonstrations Validate Multi-Platform Coordination,” darpa.mil Commercial AI specialists enter via joint ventures, injecting venture-speed iteration into defense programs without compromising classified data chains. Advanced swarm AI improves scalability, resilience, and adaptive tactics, allowing manned platforms to orchestrate large numbers of low-cost drones for ISR, EW, decoys, and precision strike with operator burden.
Restraints Impact Analysis*
| Restraint | (±) % Impact on CAGR Forecast | Geographic Relevance | Impact Timeline |
|---|---|---|---|
| Cyber-hardening costs for contested electromagnetic spectrum | -1.9% | Global, acute in high-threat theaters | Short term (≤ 2 years) |
| Ethical and legal ambiguity around lethal autonomy | -1.4% | Global, mixed regional rules | Long term (≥ 4 years) |
| Certification delays for mixed-fleet airworthiness | -1.2% | Asia-Pacific and Middle East | Short term (≤ 2 years) |
| Cybersecurity vulnerabilities and interoperability challenges | -1.5% | Global, mixed regional rules | Long term (≥ 4 years) |
| Source: Mordor Intelligence | |||
Cyber-Hardening Costs for Contested Electromagnetic Spectrum
The high costs of cyber-hardening systems operating in contested electromagnetic spectrum environments are a key restraint on the defense MUM-T market. Ensuring secure communication links, resilient datalinks, and encrypted control channels between manned and unmanned assets demands continuous investment in advanced cybersecurity measures. Budget planners report that integrating anti-jamming waveforms, encrypted links, and autonomous fallback modes raises unit costs 25-40% and stretches delivery schedules 12-18 months, compressing procurement volumes for smaller allies that lack supplemental financing lines. Rising threats of jamming, spoofing, and EW force militaries to adopt costly protective technologies, increasing program budgets and lifecycle expenses. Smaller defense players and allied nations often face funding constraints, limiting adoption at scale. These escalating cyber-hardening costs slow procurement cycles and hinder the rapid deployment of MUM-T solutions across diverse operational theaters.
Ethical and Legal Ambiguity Around Lethal Autonomy
Ethical and legal ambiguity surrounding lethal autonomy is a critical restraint for the defense MUM-T systems market. Using unmanned platforms in offensive roles raises questions about accountability, compliance with international humanitarian law, and proportional use of force. Divergent positions between the Pentagon’s Responsible AI guidance and the pending EU AI Act force contractors to develop multiple autonomy configurations, inflating non-recurring engineering expenses and fragmenting the certified product catalog destined for export markets. Concerns over delegating life-or-death decisions to AI-driven systems have led to widespread debate within NATO, the UN, and defense ministries. This uncertainty often delays procurement and limits full-scale deployment, as governments face public scrutiny and potential legal challenges. The lack of clear regulatory frameworks creates hesitation among stakeholders, slowing investment in advanced MUM-T capabilities with autonomous lethal functions.
*Our forecasts treat driver/restraint impacts as directional, not additive. The impact forecasts reflect baseline growth, mix effects, and variable interactions.
Segment Analysis
By Platform: Airborne Dominance Drives Integration
Airborne systems represented 45.25% of 2024 revenue, underscoring the operational advantages of pairing crewed fighters with loyal-wingman UAVs that extend sensor reach and weapons loadouts without increasing pilot risk. The defense manned–unmanned teaming systems market size for airborne solutions is projected to increase 15.71% annually as the US Collaborative Combat Aircraft and Europe’s FCAS transition from prototype to squadron fielding.[6]Saab, “Centaur AI Agent Integration with Gripen E Fighter,” saab.comGround vehicles follow as urban warfare lessons highlight the utility of robot scouts in subterranean and dense-terrain reconnaissance. At the same time, maritime demand builds around mine countermeasures and antisubmarine patrols, where unmanned craft operate where manned hulls dare not. Integration complexity skews by domain: aircraft leverage established air-traffic frameworks, whereas ground and naval assets must rewrite doctrine for mixed crews under denied communications.


By Level of Autonomy: Collaborative Systems Lead Market
Collaborative autonomy (LOA 3) took 42.75% of 2024 sales as commanders favor architectures that keep humans on the decision loop yet offload sensing, navigation, and target-cueing to machines. Swarm autonomy (LOA 5) accelerates fastest, at 13.83% CAGR, fueled by validated algorithms that overwhelm defenses via unpredictable vectors. Defense ministries deploy mixed-autonomy packages pairing LOA 5 decoys with LOA 3 shooters to hedge legal exposure while reaping tempo advantages. This trend reflects a pragmatic balance between operational effectiveness and ethical oversight. Collaborative systems reassure policymakers by ensuring human authority over lethal actions while exploiting machine efficiency in dynamic environments. Meanwhile, the momentum behind swarm autonomy highlights its disruptive potential in saturation attacks, EW, and contested airspace penetration. Increasing investments in AI-enabled mission management software and secure networking architectures reinforce both segments.
By Offering: Software Innovation Accelerates Growth
Hardware retained 55.32% of 2024 outlays, reflecting the capital weight of sensors, processors, and secure radios fitted to current fleets. Yet software enjoys a 14.91% CAGR through 2030 as AI model retraining, autonomy stacks, and cyber-defense updates move onto subscription cycles that refresh weapon-system behaviors as fast as new code drops can be accredited. Services training, sustainment, and systems integration—grow from the smallest base yet at the sharpest slope as multirole autonomy complicates lifecycle support. The growing weight of software reflects the shift from platform-centric procurement to capability-centric modernization. Defense agencies increasingly view autonomy stacks, swarm coordination algorithms, and cybersecurity modules as force multipliers that can be iteratively upgraded without replacing hardware. This agility is critical in countering rapidly evolving EW threats and adversarial AI. Meanwhile, the services segment benefits from rising demand for operator training in mixed-autonomy missions, integration with legacy command-and-control (C2) systems, and continuous sustainment of manned–unmanned fleets. These trends underscore how software-driven innovation and lifecycle services reshape value chains once dominated exclusively by hardware investments.

By Application: ISR Dominance Faces Combat Growth
ISR captured 45.69% of demand in 2024 because persistent unmanned sensors married to human pattern recognition deliver high-value intelligence with minimal risk. Combat operations, advancing 14.52% CAGR, rise on a doctrine that uses AI-assisted targeting to unleash massed effects while limiting collateral damage. EW roles expand as swarming decoys saturate enemy radars, and logistics missions leverage autonomous convoys to cut casualty exposure on resupply runs. The dominance of ISR reflects the enduring centrality of information superiority in modern conflicts, where timely intelligence drives both deterrence and precision strike effectiveness. However, the rapid rise of combat applications signals a doctrinal shift toward employing MUM-T as an active force multiplier rather than a passive sensor layer. EW growth highlights the increasing role of unmanned platforms in shaping contested spectrum battles, blinding or deceiving adversary defenses at scale. Meanwhile, logistics missions demonstrate the versatility of autonomy by reducing risks in vulnerable supply chains. Collectively, these applications illustrate how MUM-T adoption is broadening beyond reconnaissance into full-spectrum operations.
Geography Analysis
North America’s 38.22% share derives from robust budgets, classified test ranges, and a decade-plus head start in fielding MQ-class UAVs; it also logs the fastest 16.23% CAGR thanks to NGAD, B-21, and JADC2 funding. Europe ranks next, propelled by NGRC and FCAS but moderated by regulatory caution over lethal autonomy.
Asia-Pacific, buoyed by Quad cooperation and indigenous programs in Japan, South Korea, and Australia, posts double-digit gains as partners align procurement with US datalink standards. Middle East customers adopt MUM-T systems to offset workforce constraints and operate in GPS-denied deserts, while emerging African users pursue unmanned patrol craft for littoral security. This regional distribution underscores how strategic imperatives and industrial capacity shape MUM-T adoption.
North America leverages its mature defense-industrial base to integrate autonomy into next-generation platforms, rapidly setting global benchmarks. Europe’s collaborative programs underscore the push for sovereignty in high-tech defense, even as ethical debates slow the development of lethal applications. Asia-Pacific’s growth reflects its dual emphasis on indigenous R&D and interoperability with US-led architectures, positioning it as a pivotal growth arena. Meanwhile, Middle Eastern and African uptake illustrates how MUM-T systems are increasingly seen as high-end warfare enablers and cost-effective solutions to workforce and security shortfalls.

Competitive Landscape
The market skews moderately consolidated: The Boeing Company, Lockheed Martin Corporation, Northrop Grumman Corporation, Airbus SE, Leonardo S.p.A., and Saab AB anchor platform portfolios yet increasingly partner with AI natives such as Helsing to accelerate algorithm releases. High entry barriers: ITAR compliance, security clearances, and test-range access protect incumbents, though open-architecture rulings let specialist software suppliers bolt into end-system stacks via APIs.
Differentiation migrates from airframe performance to code velocity, forcing primes to adopt agile DevSecOps pipelines so that autonomy features refresh quarterly, not yearly. Regional champions are also emerging, with South Korea’s Hanwha Systems and Israel Aerospace Industries advancing indigenous MUM-T platforms tailored to local doctrines. These firms leverage cost competitiveness and rapid prototyping cycles to challenge Western primes in export markets. At the same time, big tech players such as Palantir, Anduril, and Shield AI are reshaping the ecosystem by offering AI, edge-computing, and swarming solutions as plug-and-play modules. This convergence of defense primes and software-first firms creates a dual-speed market where incumbents secure long-term procurement contracts while disruptors capture agile upgrade cycles. Strategic alliances, joint ventures, and acquisitions are intensifying as stakeholders race to dominate autonomy standards and interoperability frameworks.
Defense Manned-Unmanned Teaming Systems Industry Leaders
RTX Corporation
Lockheed Martin Corporation
The Boeing Company
Northrop Grumman Corporation
Airbus SE
- *Disclaimer: Major Players sorted in no particular order


Recent Industry Developments
- September 2025: BAE Systems and QinetiQ test Eurofighter’s control of UAVs under Project Hera Trials (synthetic so far), validating connectivity, interoperability, human-machine interfaces, and goal-based autonomy. This will pave the way for real-world crewed-uncrewed teaming (MUM-T / CUC-T) operations.
- September 2025: Kratos and NCSIST unveil the “Mighty Hornet IV” Attack UAV, an upgraded MQM-178 target drone featuring Mach 0.8 speed, high-G maneuverability, and a 35,000-ft ceiling designed for international marketing and MUM-T operational roles.
- August 2025: The Republic of Korea (ROK) Navy is developing a MUM-T Battle Group centered on a drone carrier. The vessel will operate manned and unmanned aerial vehicles (UAVs) to support amphibious assault operations.


Global Defense Manned-Unmanned Teaming Systems Market Report Scope
| Airborne |
| Ground |
| Naval |
| Supervised Autonomy (LOA 2) |
| Collaborative Autonomy (LOA 3) |
| Autonomous Wingman/Loyal Wingman (LOA 4) |
| Swarm Autonomy (LOA 5) |
| Hardware |
| Software |
| Services |
| Intelligence, Surveillance, and Reconnaissance (ISR) |
| Combat Operations |
| Electronic Warfare (EW) and Decoy |
| Logistics and Resupply |
| North America | United States | |
| Canada | ||
| Mexico | ||
| Europe | United Kingdom | |
| Germany | ||
| France | ||
| Italy | ||
| Spain | ||
| Russia | ||
| Rest of Europe | ||
| Asia-Pacific | China | |
| India | ||
| Japan | ||
| South Korea | ||
| Australia | ||
| Rest of Asia-Pacific | ||
| South America | Brazil | |
| Argentina | ||
| Rest of South America | ||
| Middle East and Africa | Middle East | United Arab Emirates |
| Saudi Arabia | ||
| Turkey | ||
| Rest of Middle East | ||
| Africa | South Africa | |
| Nigeria | ||
| Rest of Africa | ||
| By Platform | Airborne | ||
| Ground | |||
| Naval | |||
| By Level of Autonomy | Supervised Autonomy (LOA 2) | ||
| Collaborative Autonomy (LOA 3) | |||
| Autonomous Wingman/Loyal Wingman (LOA 4) | |||
| Swarm Autonomy (LOA 5) | |||
| By Offering | Hardware | ||
| Software | |||
| Services | |||
| By Application | Intelligence, Surveillance, and Reconnaissance (ISR) | ||
| Combat Operations | |||
| Electronic Warfare (EW) and Decoy | |||
| Logistics and Resupply | |||
| By Geography | North America | United States | |
| Canada | |||
| Mexico | |||
| Europe | United Kingdom | ||
| Germany | |||
| France | |||
| Italy | |||
| Spain | |||
| Russia | |||
| Rest of Europe | |||
| Asia-Pacific | China | ||
| India | |||
| Japan | |||
| South Korea | |||
| Australia | |||
| Rest of Asia-Pacific | |||
| South America | Brazil | ||
| Argentina | |||
| Rest of South America | |||
| Middle East and Africa | Middle East | United Arab Emirates | |
| Saudi Arabia | |||
| Turkey | |||
| Rest of Middle East | |||
| Africa | South Africa | ||
| Nigeria | |||
| Rest of Africa | |||


Key Questions Answered in the Report
What is the current value of the defense manned–unmanned teaming systems spending?
The defense manned–unmanned teaming (MUM-T) systems market size stands at USD 4.36 billion in 2025 and is forecasted to reach USD 8.25 billion by 2030, reflecting a 13.59% CAGR.
Which military domain is adopting MUM-T fastest?
Airborne programs lead with 45.25% revenue share, propelled by loyal-wingman initiatives.
Why is software growth outpacing hardware in this field?
AI and autonomy updates can be rolled out via code refreshes, driving a 14.91% CAGR for software while lowering the need for new platforms.
How are NATO requirements shaping demand?
NGRC rules compel all 30 allies to embed MUM-T in rotorcraft, creating a synchronized multibillion-dollar procurement wave by 2028.
What challenges slow procurement?
Cyber-hardening adds up to 40% to unit cost and ethical ambiguity around lethal autonomy complicates certification, moderating adoption rates.
Which region posts the highest growth outlook?
North America combines a 38.22% revenue base with a 16.23% CAGR, buoyed by JADC2 and NGAD investments.
Page last updated on:


