Dairy Blends Market Size and Share
Market Overview
| Study Period | 2021 - 2031 |
|---|---|
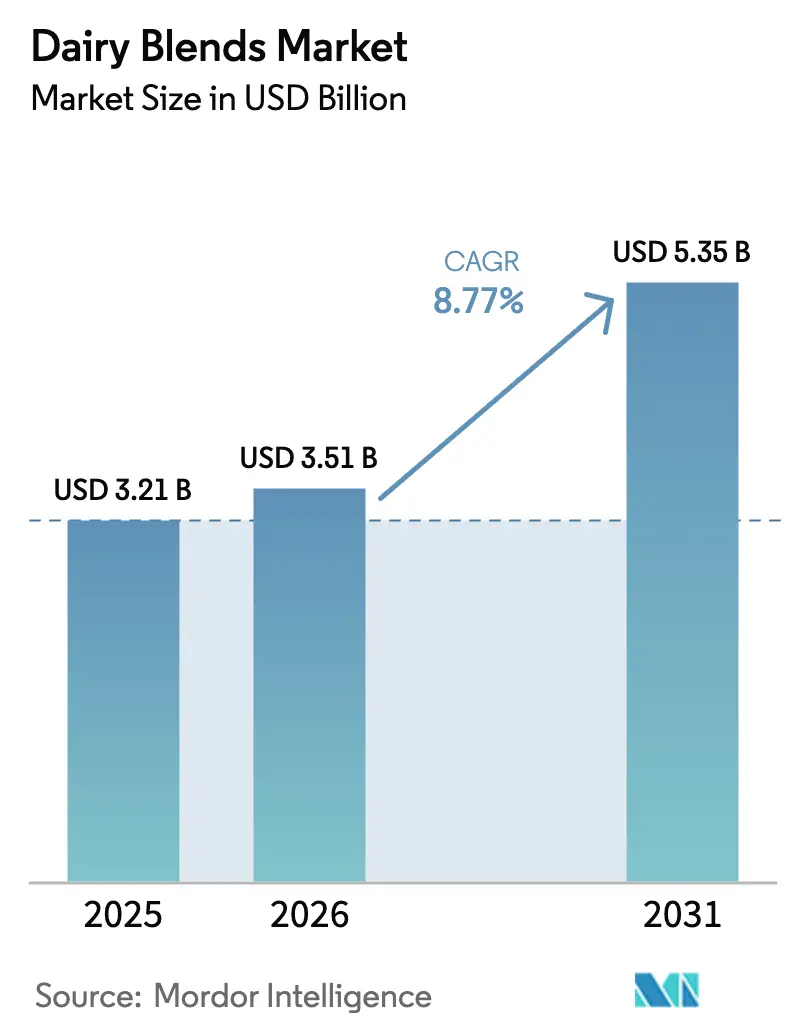
| Market Size (2026) | USD 3.51 Billion |
| Market Size (2031) | USD 5.35 Billion |
| Growth Rate (2026 - 2031) | 8.77% CAGR |
| Fastest Growing Market | Asia Pacific |
| Largest Market | Europe |
| Market Concentration | Medium |
Major Players *Disclaimer: Major Players sorted in no particular order Image © Mordor Intelligence. Reuse requires attribution under CC BY 4.0. | |
Dairy Blends Market Analysis by Mordor Intelligence
The dairy blends market is expected to grow from USD 3.21 billion in 2025 to USD 3.51 billion in 2026 and is projected to reach USD 5.35 billion by 2031, registering a compound annual growth rate (CAGR) of 8.77% during the forecast period (2026-2031). This growth indicates a significant shift in how food manufacturers address cost, functionality, and nutritional claims across applications such as bakery, confectionery, beverages, and infant formula. Increasing health and nutrition awareness is driving consumer demand for foods perceived as nutritious and functional. Dairy blends, particularly those fortified with proteins, vitamins, or minerals, are gaining popularity as balanced and wholesome options for various age groups. This demand is especially pronounced in markets where lifestyle diseases and fitness trends encourage the consumption of high-protein and low-fat food products.
Key Report Takeaways
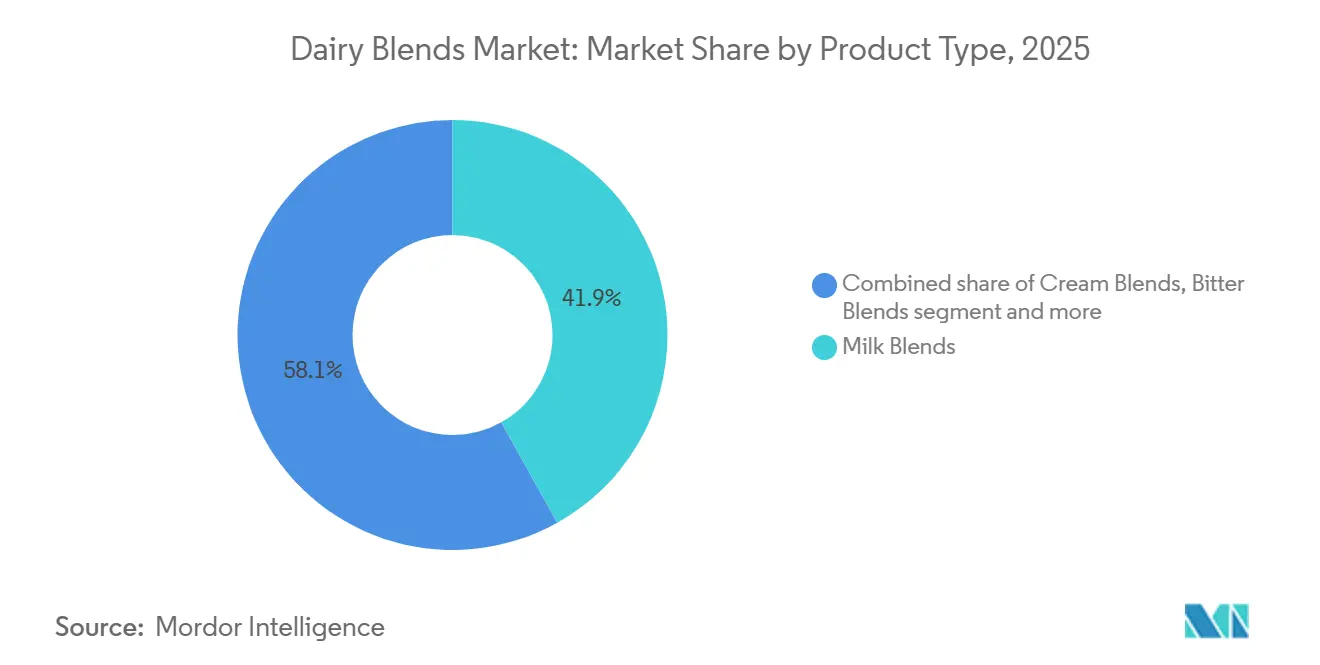
- By product type, milk blends led with 41.91% of the dairy blends market share in 2025, while butter blends are projected to expand at a 9.81% CAGR through 2031.
- By form, powder captured 46.71% share of the dairy blends market size in 2025, whereas liquid is advancing at a 9.51% CAGR through 2031.
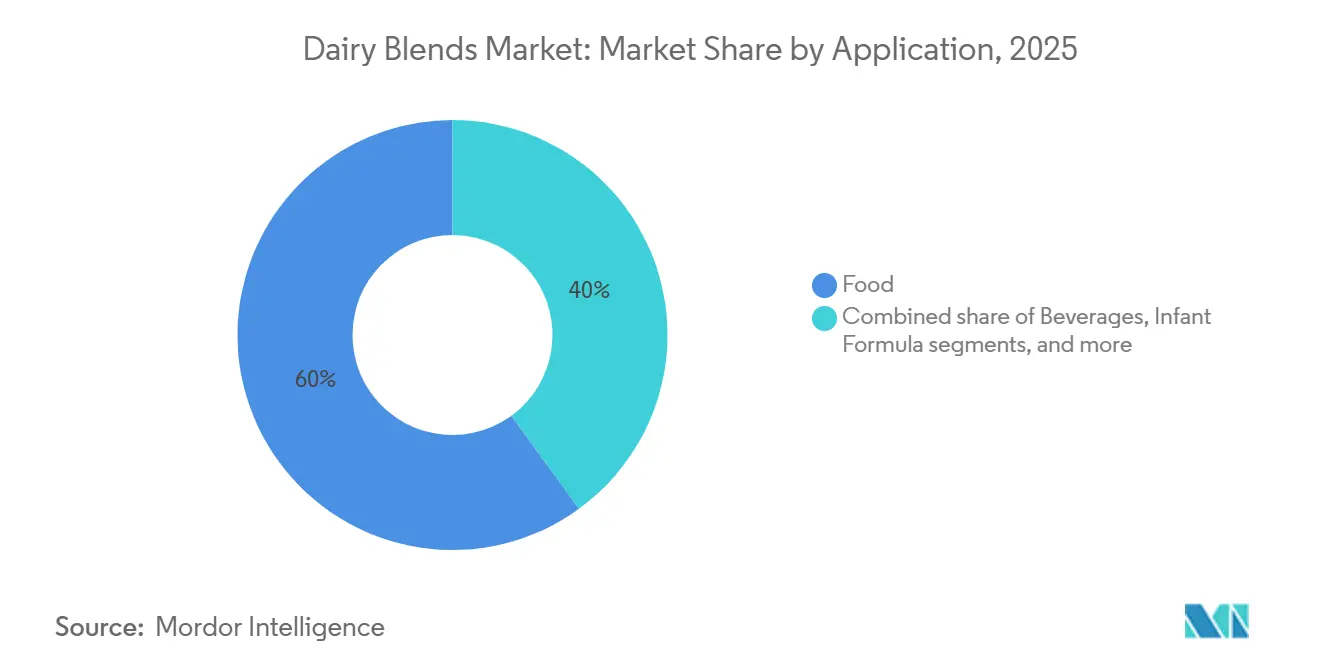
- By application, food accounted for 60.02% of 2025 revenue, yet infant formula is forecast to grow at a 9.22% CAGR between 2026 and 2031.
- By fat content, full-fat blends held 49.08% share in 2025, as fat-free variants accelerate at a 9.34% CAGR through 2031.
- By geography, Europe occupied 28.91% of 2025 volume, and Asia-Pacific is on track for a 9.19% CAGR to 2031.
Note: Market size and forecast figures in this report are generated using Mordor Intelligence’s proprietary estimation framework, updated with the latest available data and insights as of January 2026.
Global Dairy Blends Market Trends and Insights
Drivers Impact Analysis*
| Driver | (~) % Impact on CAGR Forecast | Geographic Relevance | Impact Timeline |
|---|---|---|---|
| Rising adoption of dairy blends across bakery, confectionery, and beverages | +1.8% | Global, with concentration in North America and Europe for bakery; Asia-Pacific for beverages | Medium term (2-4 years) |
| Expansion of foodservice and quick-service restaurants across the globe | +1.5% | Global, led by Asia-Pacific urbanization and North America chain expansion | Long term (≥ 4 years) |
| Growing demand for fortified and high-protein dairy products | +1.6% | North America, Europe, Asia-Pacific core markets | Medium term (2-4 years) |
| Advances in blending, processing, and shelf-life technologies | +1.3% | Global, early adoption in Europe and Oceania | Long term (≥ 4 years) |
| Increasing preference for personalized nutrition driving product variety | +0.9% | North America and Europe, spillover to urban Asia-Pacific | Medium term (2-4 years) |
| Youth-focused flavor innovation and marketing boosting appeal | +0.7% | Global, strongest in North America and Europe | Short term (≤ 2 years) |
| Source: Mordor Intelligence | |||
Rising adoption of dairy blends across bakery, confectionery, and beverages
Bakery and confectionery manufacturers are substituting pure butter and cream with cost-optimized blends that maintain mouthfeel while reducing saturated-fat declarations on nutrition panels. Fonterra launched Anchor Easy Bakery UHT Cream in China during 2024, targeting industrial bakers who require ambient-stable emulsions that survive high-temperature ovens without curdling. Beverage formulators are layering dairy blends into ready-to-drink coffee and protein shakes, where whey-casein ratios dictate foam stability and perceived creaminess. FrieslandCampina partnered with Selecta in January 2024 to supply liquid milk and creamers across 16 European markets, embedding its Lattiz dispensing system into office break rooms. Ice-cream producers blend milk solids with vegetable fats to lower freezing points and improve scoopability, a technique that also hedges against dairy-price spikes. Confectionery fillings in chocolates and biscuits increasingly use dairy blends to achieve specific melting profiles without the cost volatility of pure cocoa butter or anhydrous milk fat.
Expansion of foodservice and quick-service restaurants across globe
The rapid growth of foodservice, particularly quick-service restaurants (QSRs), is a significant driver for the global dairy blends market. Restaurants and QSRs require large quantities of stable, easy-to-handle ingredients such as powdered milk blends, creamers, custard/batter mixes, sauce bases, and fortified powders. These ingredients help reduce on-site processing time, minimize waste, and ensure consistent taste across multiple outlets. As global chains expand, they increasingly demand customized dairy blends that provide predictable functionality, such as foaming, mouthfeel, and shelf-stable protein content, at a lower cost compared to fresh milk. This trend encourages manufacturers and ingredient suppliers to innovate and expand their supply capabilities. In 2024, food sales at foodservice outlets reached USD 1.52 trillion, with full-service establishments contributing USD 552.7 billion and limited-service establishments contributing USD 550.7 billion[1]Source: U.S. Department of Agriculture, “Food Service Industry - Market Segments,” ers.usda.gov. These dynamics directly support larger and more consistent institutional purchases of dairy blend powders and premixes for use in beverages, desserts, bakery, and savory applications.
Growing demand for fortified and high-protein dairy products
Consumers are shifting from commodity milk to functional dairy products that provide protein, calcium, vitamin D, and probiotics in a single serving. This trend supports the use of blends formulated with whey protein isolate, milk protein concentrate, and micronutrient premixes. In 2024, the European Union approved iron milk caseinate and whey protein isolate as novel ingredients, allowing manufacturers to fortify yogurt and cheese analogs without affecting texture[2]Source: European Union, “COMMISSION REGULATION (EU) 2024/1821,” eur-lex.europa.eu. Additionally, the U.S. Food and Drug Administration (FDA) issued a request for information (RFI) regarding manufacturing processes and ingredients used in certain dairy products, referred to in the RFI as high-protein yogurt, Greek yogurt, or Greek-style yogurt[3]Source: U.S. Food and Drug Administration, “FDA Issues Request for Information on High-Protein Yogurt,” fda.gov . This has encouraged formulators to combine whey concentrates with skim milk powder. Sports-nutrition brands are also reformulating protein shakes with dairy blends that provide enhanced amino-acid profiles, particularly higher leucine content, which is essential for muscle-protein synthesis.
Advances in blending, processing, and shelf-life technologies
Ultra-high-temperature (UHT) processing heats dairy blends to 135-150 degrees Celsius for 2-5 seconds, effectively destroying spoilage bacteria while preserving flavor. This process enables an ambient shelf life of six to nine months, eliminating cold-chain costs in tropical climates. In 2025, Fonterra invested USD 150 million in a UHT cream plant in New Zealand, aiming to supply Southeast Asian bakeries that lack refrigerated warehousing. Extended-shelf-life (ESL) technology combines microfiltration to remove bacteria with pasteurization at 72 degrees Celsius, resulting in a refrigerated shelf life of 60 to 90 days. This reduces retail waste and allows for longer distribution windows. Membrane filtration is used to separate milk into protein, lactose, and mineral fractions, which are then recombined in specific ratios to meet application needs, such as high-protein blends for sports nutrition, low-lactose options for Asia-Pacific markets, or high-fat formulations for premium ice cream. Aseptic packaging innovations from companies like Tetra Pak and SIG Combibloc enable dairy blends to be shipped unrefrigerated, facilitating distribution to rural areas with unreliable cold chains. Additionally, microencapsulation of probiotics and omega-3 fatty acids protects these sensitive ingredients during thermal processing, allowing the production of fortified blends that can withstand UHT treatment.
Restraints Impact Analysis*
| Restraint | (~) % Impact on CAGR Forecast | Geographic Relevance | Impact Timeline |
|---|---|---|---|
| Volatile raw milk and dairy ingredient prices raising costs | -1.2% | Global, acute in Europe and Oceania due to weather and feed costs | Short term (≤ 2 years) |
| Growing competition from plant-based and vegan alternatives | -1.0% | North America and Europe, emerging in urban Asia-Pacific | Medium term (2-4 years) |
| Shelf-life limitations in fresh and liquid blend formats | -0.6% | Emerging markets with weak cold chains; South America, Africa, Southeast Asia | Long term (≥ 4 years) |
| High prevalence of lactose intolerance constraining demand | -0.8% | Asia-Pacific core, Africa, with spillover to South America | Long term (≥ 4 years) |
| Source: Mordor Intelligence | |||
Volatile raw milk and dairy ingredient prices raising costs
Raw milk prices experienced notable fluctuations due to weather disruptions, rising feed costs, and herd-size adjustments, which typically lag demand changes by over a year. The butter market exhibited significant volatility, with European spot prices increasing sharply as reduced cream availability prompted processors to prioritize cheese production to achieve higher margins. Blenders without long-term supply contracts faced margin pressures during milk price spikes, as downstream customers resisted mid-contract price adjustments. Smaller cooperatives, lacking access to the hedging tools utilized by multinational processors to manage feed and milk costs, were more exposed to spot-market volatility. Feed costs, which constitute the largest portion of dairy farm expenses, were heavily influenced by corn and soybean markets. These markets, in turn, were affected by energy prices and geopolitical events, creating widespread volatility across the dairy supply chain.
Growing competition from plant-based and vegan alternatives
An increasing number of consumers are reducing or eliminating animal-derived products due to concerns about lactose intolerance, cholesterol intake, animal welfare, and the environmental impact of dairy farming. This trend is particularly prominent among younger demographics in urban markets, where plant-based beverages, creamers, and protein blends made from almond, soy, oat, pea, and coconut are gaining acceptance as functional alternatives to dairy products in beverages, bakery, and foodservice applications. From an industry standpoint, food and beverage manufacturers and foodservice operators are expanding plant-based menu offerings to align with changing dietary preferences, gradually reducing the demand for traditional dairy products. Furthermore, plant-based products often feature "free-from" and vegan labeling, which appeals to health- and sustainability-conscious consumers and significantly influences procurement decisions in institutional and quick-service restaurant (QSR) channels.
*Our forecasts treat driver/restraint impacts as directional, not additive. The impact forecasts reflect baseline growth, mix effects, and variable interactions.
Segment Analysis
By Product Type: Milk Blends Lead While Butter Blends Accelerate
Milk blends accounted for a share of 41.91% in 2025, while butter blends are projected to grow at a rate of 9.81% from 2026 to 2031. This growth is expected to surpass that of milk blends and cream blends, as manufacturers incorporate dairy fats with rapeseed or olive oil to enhance spreadability directly from the refrigerator without the trans-fat concerns associated with hydrogenation. Milk blends dominate the market due to their use as a base for reconstituted beverages, yogurt cultures, and infant formula, where maintaining standardized protein and lactose ratios is essential for regulatory compliance and sensory consistency. Cream blends are primarily used in coffee creamers, whipped toppings, and ice cream bases, where the size of fat globules plays a key role in foam stability and mouthfeel.
Other product types, such as cheese blends and yogurt blends, target cost-sensitive segments by partially substituting dairy solids with starches or vegetable proteins. This approach helps reduce input costs while maintaining consumer acceptance. Cheese blends, which combine natural cheese with emulsifying salts and vegetable oils, are widely used in pizza chains due to their ability to enhance melt and stretch properties, ensuring consistent performance under heat lamps. Similarly, the growing preference for butter blends aligns with consumer demand for convenience, as spreadable formats eliminate the need for softening. Additionally, flavored butter variants support premiumization by commanding higher price points compared to standard butter products.


By Form: Powder Dominance Challenged by Liquid Innovation
Powder formats accounted for 46.71% of the 2025 revenue, while liquid dairy blends are expected to grow at a rate of 9.51% from 2026 to 2031. This growth is supported by ultra-high-temperature and extended-shelf-life technologies, which facilitate ambient distribution and eliminate the need for cold-chain logistics in emerging markets. Ultra-high-temperature processing involves heating the product to a temperature of 135-150 degrees Celsius for a few seconds, effectively sterilizing it and enabling a longer shelf life without refrigeration. Extended-shelf-life processing, on the other hand, combines microfiltration to remove bacteria with pasteurization at 72 degrees Celsius. This process results in a refrigerated shelf life of 60 to 90 days, significantly reducing retail waste and allowing for longer distribution windows. These advancements are driving the demand for liquid dairy blends, particularly in regions where cold-chain infrastructure is limited.
Powder formats continue to dominate in infant formula, sports nutrition, and emergency food aid due to their extended shelf life, low shipping weight, and suitability for ambient storage, particularly in regions with unreliable electricity. Other formats, such as condensed and evaporated milk, cater to niche applications in confectionery and bakery, where high solids content and caramelized flavors are preferred. Growth in liquid formats is primarily observed in foodservice, where ready-to-use products reduce reconstitution labor, and in retail ready-to-drink beverages, where consumers are willing to pay a premium for convenience. Investments in cold-chain infrastructure across Asia-Pacific and Africa are facilitating liquid-blend distribution to urban centers, although rural areas continue to depend on powder formats due to infrastructure limitations.
By Application: Food Sector Strength Versus Infant Formula Surge
Food applications accounted for 60.02% of the projected revenue in 2025. The infant formula segment is anticipated to grow at a rate of 9.22% between 2026 and 2031. This growth is driven by rising birth rates in India and Indonesia, stricter nutrient-fortification regulations in China, and a growing preference for premium products among middle-class parents seeking cognitive and immune health benefits for their children. In India, the infant formula market is expanding due to increasing urbanization and higher female workforce participation, which has reduced breastfeeding durations. This has led to greater demand for follow-on and toddler formulas that incorporate whey protein, DHA, and prebiotics. In China, the GB 10765-2021 standard mandates specific ratios of protein, fat, and micronutrients, requiring manufacturers to use precise blends of demineralized whey, lactose, and other ingredients to meet regulatory compliance. These factors collectively act as significant drivers for the dairy blends market, as manufacturers increasingly rely on dairy-based ingredients like whey protein and lactose to formulate products that meet regulatory standards and consumer preferences for nutritional and functional benefits.
Food applications include bakery products requiring emulsification and moisture retention, confectionery fillings with specific melting profiles, ice cream bases balancing fat and solids for scoopability, and cheese analogs designed to optimize cost structures. The bakery segment remains a significant food sub-segment, as dairy blends enhance dough machinability, extend shelf life through effective moisture management, and provide rich flavor without the cost fluctuations associated with pure butter or cream. Confectionery manufacturers use milk solids combined with cocoa butter substitutes to lower input costs while maintaining the desired snap and gloss in chocolate coatings. Ice cream producers adjust milk-fat and milk-solids-non-fat ratios to manage freezing points and texture, with premium brands favoring higher dairy content and value brands incorporating vegetable fats. Cheese analogs utilize natural cheese, emulsifying salts, and starches to improve melt and stretch, making them a preferred choice for pizza chains and sandwich manufacturers seeking consistent performance.
By Fat Content: Full Fat Leadership Meets Fat-Free Innovation
Full-fat formats accounted for 49.08% of the market in 2025, driven by their superior flavor, mouthfeel, and satiety. Fat-free dairy blends are projected to grow at a rate of 9.34% from 2026 to 2031, fueled by demand from sports-nutrition brands, weight-management programs, and health-conscious consumers who prioritize protein density over caloric intake. Sports-nutrition brands are reformulating protein shakes with fat-free dairy blends to optimize protein-to-calorie ratios, targeting athletes who monitor macronutrient intake and emphasize leucine content for muscle-protein synthesis.
Low-fat blends, defined as products containing less than 3 grams of fat per serving, provide a balance between improved mouthfeel compared to fat-free options and a healthier perception compared to full-fat products. Full-fat blends dominate applications such as ice cream, premium yogurt, and cheese, as the fat globules in these products enhance flavor and contribute to the creamy texture associated with indulgence. Butter and cream blends are categorized as full-fat due to their high fat content, which exceeds 80% for butter and ranges between 30-40% for cream, as this fat content is essential for their functionality. The demand for fat-free products is primarily concentrated in North America and Europe, driven by concerns over obesity and chronic diseases, while Asia-Pacific and South America show a preference for full-fat products, which provide energy density in regions where undernutrition remains a significant issue.
Geography Analysis
Europe accounted for a significant 28.91% market share in 2025, supported by its advanced processing infrastructure and steady demand for high-quality dairy products. Key production hubs in Germany, France, and the Netherlands contribute to the region's market strength. Europe's market maturity is evident in its focus on premiumization, sustainability certifications, and novel-ingredient approvals that enable functional dairy blends. However, the European market encounters several operational challenges, such as strict environmental regulations, occasional disease outbreaks, and farmer concerns related to taxation and subsidy frameworks. These factors impact production capacity and market dynamics within the region.
The Asia-Pacific region is projected to grow at a rate of 9.19% from 2026 to 2031. This expansion is driven by increasing demand for infant formula in China and India, urbanization that supports the adoption of convenient dairy products, and rising incomes that facilitate protein-rich diets. Key factors such as growing disposable incomes, rapid urbanization, and heightened health awareness in major markets like China, India, and Japan further support this growth. The market also benefits from robust government support programs and strategic collaborations within the industry. Furthermore, advancements in lactose-removal technologies address specific dietary needs prevalent in Asian markets, contributing to sustained growth in the region.
North America continues to hold a strong market position, while emerging opportunities are evident in South America and the Middle East and Africa. The Middle East and Africa, in particular, show significant growth potential driven by increasing urbanization and rising dairy consumption. However, these regions face challenges such as infrastructure constraints and complex regulatory frameworks, which can affect market entry and expansion strategies. Despite these challenges, they remain key growth areas for market participants aiming to diversify geographically.


Competitive Landscape
The dairy blends market exhibits moderate fragmentation, with key players such as All American Foods, Royal FrieslandCampina NV, and Cargill maintaining strong market positions. This competitive environment fosters both consolidation among major companies and the emergence of niche specialists. Companies are increasingly utilizing technological advancements to differentiate themselves, with notable investments in membrane filtration technologies, AI-driven process optimization, and sustainable packaging solutions. Industry organizations emphasize the growing role of artificial intelligence in dairy operations, particularly in enhancing efficiency and aligning production with evolving consumer preferences.
Consolidation continues to reshape the competitive landscape, as demonstrated by Fonterra’s merger of its New Zealand and Australian consumer businesses in February 2024 to establish Fonterra Oceania. Such initiatives reflect broader strategies aimed at strengthening market presence, optimizing operations, and achieving economies of scale. Simultaneously, the market is advancing through innovations such as personalized nutrition solutions, hybrid dairy-plant formulations, and application-specific blends tailored for emerging markets. There is also an increasing emphasis on lactose-free and functionally enhanced dairy blends to meet diverse consumer needs.
Competitive dynamics are further influenced by new entrants disrupting traditional distribution channels with sustainability-focused approaches. In response, established players are enhancing innovation partnerships and increasing investments in advanced processing technologies. These strategic measures highlight the industry’s adaptation to shifting consumer demands and underscore the critical role of efficiency, innovation, and sustainability in maintaining a competitive edge in the global dairy blends market.
Dairy Blends Industry Leaders
All American Foods Inc.
Kerry Group plc
Royal FrieslandCampina NV
Cargill Incorporated
Fonterra Co-operative Group Ltd
- *Disclaimer: Major Players sorted in no particular order

Recent Industry Developments
- May 2025: Farm Dairy and PlanetDairy partnered to develop milk blends that combine dairy with plant-based ingredients. The collaboration has produced a new product line that integrates traditional dairy with plant components to create sustainable milk alternatives.
- July 2024: FrieslandCampina, through its subsidiary Frisian Flag Indonesia, opened a new dairy processing plant in Cikarang, West Java. The plant, which represents the company's largest international investment, produces various dairy products including dairy blends to meet increasing domestic demand and support FrieslandCampina's expansion in Southeast Asia. The facility aims to provide affordable, high-quality, and nutritious dairy products for consumers in Indonesia and the region.


Research Methodology Framework and Report Scope
Market Definitions and Key Coverage
Our study views the dairy blends market as the sale of ingredient systems that combine dairy constituents (milk solids, whey proteins, butterfat or cream) with optional non-dairy components to deliver customized functionality for food, beverage, infant nutrition, and clinical nutrition use. According to Mordor Intelligence, the assessment tracks only commercial, factory-produced blends sold in bulk or pre-packed formats, measured in revenue and tonnage at ex-factory prices.
Scope exclusions include pure milk powders, standalone plant-based creamers, and on-premise blending activities that are not counted.
Segmentation Overview
- By Product Type
- Milk Blends
- Cream Blends
- Butter Blends
- Others
- By Form
- Powder
- Liquid
- Others
- By Application
- Food
- Bakery
- Confectionery
- Ice Cream
- Cheese
- Yogurt
- Other Food Applications
- Beverages
- Infant Formula
- Other Applications
- Food
- By Fat Content
- Full Fat
- Low Fat
- Fat Free
- By Geography
- North America
- United States
- Canada
- Mexico
- Rest of North America
- Europe
- Germany
- United Kingdom
- Italy
- France
- Spain
- Netherlands
- Poland
- Belgium
- Sweden
- Rest of Europe
- Asia-Pacific
- China
- India
- Japan
- Australia
- Indonesia
- South Korea
- Thailand
- Singapore
- Rest of Asia-Pacific
- South America
- Brazil
- Argentina
- Colombia
- Chile
- Peru
- Rest of South America
- Middle East and Africa
- South Africa
- Saudi Arabia
- United Arab Emirates
- Nigeria
- Egypt
- Morocco
- Turkey
- Rest of Middle East and Africa
- North America
Detailed Research Methodology and Data Validation
Primary Research
Mordor analysts interviewed dairy technologists, procurement leads at bakery and beverage firms, and ingredient distributors across North America, Europe, and Asia Pacific. The conversations tested secondary datapoints, revealed average selling prices, and clarified regional taste and labeling constraints that desk sources seldom capture.
Desk Research
Our analysts began with publicly available anchors such as FAO milk production dashboards, UN Comtrade trade codes for HS 0404 and HS 1901, USDA and Eurostat dairy price series, and regulatory notices from Codex Alimentarius that define compositional limits. Company 10-Ks, investor decks, and association portals such as the Global Dairy Platform then supplied brand launches, capacity additions, and cost trends that shape the adoption of blends.
Subscription assets, including D&B Hoovers for company revenue splits and Dow Jones Factiva for deal flow, helped us validate corporate exposure and competitive intensity across regions. These sources illustrate but do not exhaust every dataset consulted during desk work.
Market-Sizing & Forecasting
A top-down reconstruction starts with milk solids availability and trade balances, which are then linked to conversion ratios observed in commercial blending plants. Results are cross-checked through selective bottom-up estimates that multiply sampled blend ASPs by shipment volumes reported by key suppliers and channel partners.
Key variables inside our model include milk fat differential versus vegetable fat, infant formula penetration in live births, bakery output indices, and average spreadability claims per new SKU. Multivariate regression projects each driver, while scenario analysis gauges shifts in raw milk price or lactose-free demand. Gaps in granular supplier data are bridged with triangulated ASP corridors gathered during interviews.
Data Validation & Update Cycle
Before release, a second analyst audits variance against historical ratios, industry margins, and customs data. Material deviations trigger re-contact with sources. The model refreshes annually, and an interim sweep is completed whenever milk price shocks, major capacity additions, or labeling rule changes occur.
Why Mordor's Dairy Blends Baseline Earns Stakeholder Trust
Published estimates for this niche often diverge because firms choose different inclusion rules, base years, and price conversions. Our disciplined scope and yearly refresh cadence reduce those disparities for clients shopping for dependable numbers.
Key gap drivers include: a) some publishers bundle pure milk powders and creamers; b) others apply retail or CIF pricing while Mordor uses ex-factory parity; c) several extend forecasts from 2023 without adjusting for 2024 EU fat content legislation that lifted average ASP by nearly six percent.
Benchmark comparison
| Market Size | Anonymized source | Primary gap driver |
|---|---|---|
| USD 3.21 B (2025) | Mordor Intelligence | - |
| USD 2.60 B (2024) | Global Consultancy A | Excludes emerging Asian infant formula channels; uses 2022 ASP profile |
| USD 5.30 B (2025) | Research Publisher B | Adds plant-only creamers and applies retail pricing multipliers |
These contrasts show that Mordor's selective scope, current year pricing checks, and dual validation steps yield a balanced, transparent baseline that decision makers can trace back to clear variables and repeatable logic.


Key Questions Answered in the Report
How big is the dairy blends market in 2026?
The dairy blends market size reached USD 3.51 billion in 2026 and is on course for USD 5.35 billion by 2031.
Which product type is growing fastest?
Butter blends are forecast to post the fastest growth at a 9.81% CAGR between 2026 and 2031, fueled by spreadable innovations.
Why are liquid blends gaining share?
UHT and extended-shelf-life processing enable liquid blends to be transported without refrigeration, driving foodservice and retail demand in emerging markets.
What drives infant-formula demand for dairy blends?
Stricter nutrient mandates in China and rising birth rates in India and Indonesia require precision-blended bases rich in dairy proteins.
Page last updated on:


