Market Overview
| Study Period | 2017 - 2028 |
|---|---|
| Forecast Data Period | 2024 - 2028 |
| Historical Data Period | 2017 - 2022 |
| Market Size (2024) | USD 2.92 Billion |
| Market Size (2028) | USD 3.61 Billion |
| Growth Rate (2024 - 2028) | 5.46% CAGR |
| Market Concentration | Medium |
Major Players*Disclaimer: Major Players sorted in no particular order Image © Mordor Intelligence. Reuse requires attribution under CC BY 4.0. | |

Cyanoacrylate Adhesives Market Analysis by Mordor Intelligence
The Cyanoacrylate Adhesives Market size is estimated at 2.92 billion USD in 2024, and is expected to reach 3.61 billion USD by 2028, growing at a CAGR of 5.46% during the forecast period (2024-2028).
The cyanoacrylate adhesives industry is experiencing significant transformation driven by broader economic and sustainability trends. Manufacturing companies are increasingly focusing on developing eco-friendly cyanoacrylate adhesive solutions with lower volatile organic compound (VOC) emissions to align with stringent environmental regulations. This shift is particularly evident in major economies where sustainability initiatives are gaining prominence. The construction sector, which represents a significant end-user segment, is projected to grow at a CAGR of 3.5% through 2030, with China, India, the United States, and Indonesia collectively accounting for 58.3% of the global construction growth, indicating substantial opportunities for adhesive manufacturers.
Technological innovation is reshaping the industry landscape, particularly in adhesive formulation and application methods. UV-cured technology has emerged as a rapidly growing segment, expected to achieve a volume CAGR of 4.83% through 2028, driven by its superior performance characteristics and environmental benefits. Manufacturers are investing in research and development to enhance product properties such as bonding strength, curing speed, and temperature resistance. These innovations are particularly crucial for high-precision applications in electronics and medical device manufacturing, where reliability and performance are paramount. The role of industrial adhesives, including electronics adhesives and medical adhesives, is becoming increasingly significant in these sectors.
The market is witnessing significant evolution in end-user applications, particularly in emerging sectors. The electronics and household appliances industries are projected to grow at CAGRs of 2.51% and 5.77% respectively, creating new opportunities for specialized adhesive solutions. The electric vehicle segment's explosive growth, with an anticipated CAGR of 17.75%, is driving demand for lightweight bonding solutions that can enhance vehicle efficiency and performance. This trend is compelling adhesive manufacturers to develop products specifically tailored for electric vehicle assembly and battery manufacturing applications, highlighting the importance of automotive adhesives.
Raw material sourcing and supply chain optimization have become critical focus areas for industry participants. Manufacturers are diversifying their supplier networks and investing in local production capabilities to ensure supply chain resilience. The industry is seeing increased collaboration between adhesive manufacturers and end-users to develop customized solutions that meet specific application requirements. Companies are also implementing advanced manufacturing technologies and quality control systems to enhance production efficiency and maintain consistent product quality, which is particularly important for high-performance applications in the aerospace and healthcare sectors. The integration of reactive adhesives and engineering adhesives into these processes underscores the industry's commitment to innovation and quality.
Global Cyanoacrylate Adhesives Market Trends and Insights
Favorable government policies to promote electric vehicles will propel automotive industry
- Since 2021, the global automotive industry has been expected to grow steadily but at a slower pace because of the decline in consumers' preferences for individual ownership of passenger vehicles and their increased preference for shared mobility in transportation. The global automotive industry is expected to experience a growth rate of 2% annually, with an expected value addition of USD 1.5 trillion in total revenue during the forecast period.
- In 2020, due to the impact of the COVID-19 pandemic, vehicle sales declined but recovered rapidly in 2021 because the governments of various countries took measures to support their economies, as automotive markets usually contribute majorly to their GDP. Vehicle sales declined from 90 million units of passenger vehicles in 2019 to 78 million units in 2020.
- The introduction of electric vehicles worldwide has contributed significantly to the overall revenue of the global automotive market because of their cheaper energy costs, environmentally benign nature, and efficient mobility features. Various government policies and standards also work as driving factors to increase EV production. For instance, the EU standards for CO2 emissions increased the demand for electric vehicles in 2021. As per the IEA's Sustainable Scenario, 230 million electric vehicles are required to replace combustion fuel-based vehicles by 2030. In 2021, Tesla, the largest EV manufacturer, recorded a rise of 157% in the number of electric vehicles manufactured. This growing trend of consumers preferring electric vehicles is expected to rise further during the forecast period (2022-2028).


Rising demand for home & office furniture to aid the growth of the industry
- While IKEA is the largest offline retail player in the global furniture market, there has been a rise in e-commerce giants, such as Wayfair, in recent years. The adoption of online furniture shopping by consumers is gaining momentum globally, and its share in the overall furniture market increased from 15% in 2017 to 18% in 2021. This trend is subsequently boosting the demand for furniture due to its convenience and easy installation. The highest sales revenue for furniture was generated in the United States, with USD 229.2 billion, in 2021.
- The global wooden furniture market can be segmented into bedroom, living room, outdoor, and dining furniture. Among these, the living room furniture segment held the highest revenue share, accounting for nearly 40% of the overall furniture market since the increase in the work-from-home culture during the COVID-19 outbreak in 2020. The pandemic led to an increase in demand for living room or home office furniture in 2020-2021, and the segment registered a market value of USD 227.10 billion globally.
- The market is expected to witness steady growth during the forecast period (2022-2028) due to the increasing per capita expenditure on furniture, which rose from USD 72.85 in 2017 to USD 89.30 in 2021 despite the pandemic in 2020, during which it dipped to USD 80.43. This increasing per capita expenditure on furniture could be due to the improving living standards of people.

OTHER KEY INDUSTRY TRENDS COVERED IN THE REPORT
- Rapid growth of civil and military aviation will boost the aircraft production
- Easy availability of resources will support the footwear industry specifically in developing countries
- Growing residential and infrastructural development to thrive the construction sector
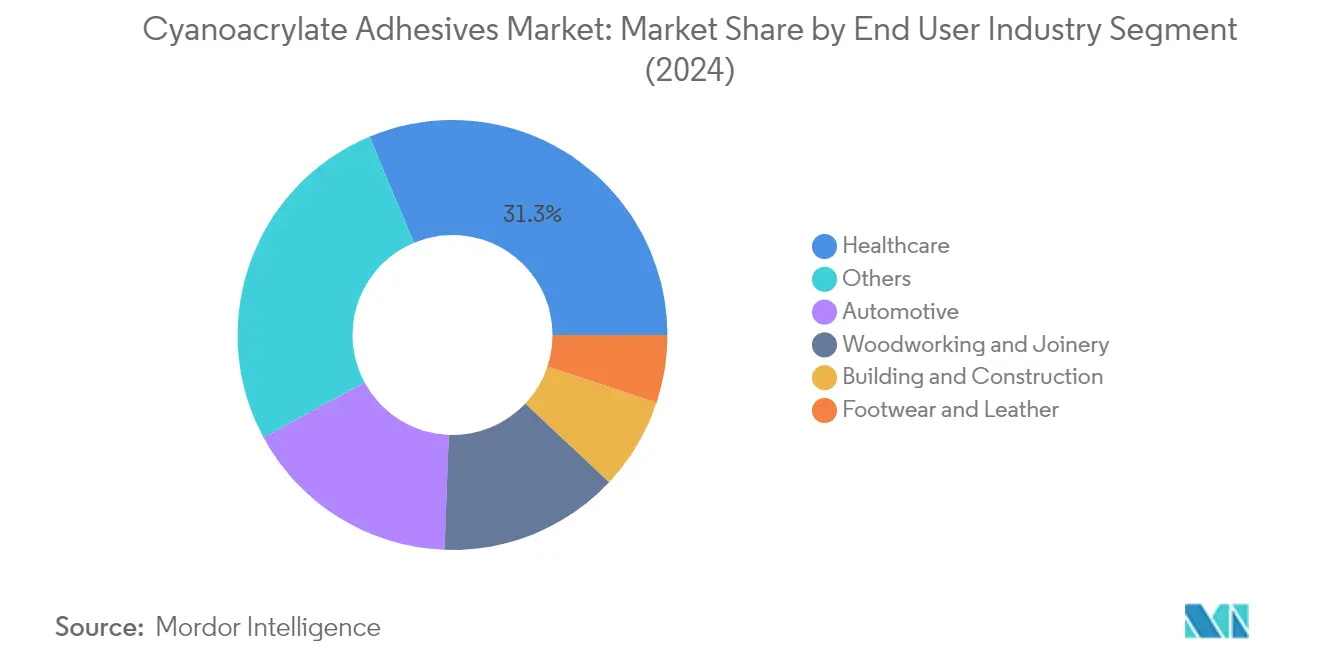
Segment Analysis: End User Industry
Healthcare Segment in Cyanoacrylate Adhesives Market
The healthcare segment dominates the global cyanoacrylate adhesives market, accounting for approximately 31% of the total market value in 2024. This significant market share is primarily driven by the extensive use of medical adhesives in medical device manufacturing, surgical applications, and wound closure systems. The segment's dominance is further strengthened by the increasing adoption of disposable medical devices globally and the growing preference for cyanoacrylate-based medical adhesives over traditional sutures due to their better cosmetic results and reduced recovery time. The healthcare segment particularly benefits from the non-toxic nature of these adhesives and their compatibility with various medical substrates, making them ideal for applications in dental adhesives and medical equipment manufacturing.

Aerospace Segment in Cyanoacrylate Adhesives Market
The aerospace segment is emerging as the fastest-growing application area in the cyanoacrylate adhesives market, projected to grow at approximately 5% CAGR from 2024 to 2029. This robust growth is primarily driven by the increasing adoption of lightweight materials in aircraft manufacturing and the growing demand for high-performance bonding solutions in aerospace applications. The segment's growth is further supported by the rising focus on fuel efficiency and the need for reliable adhesive solutions in aircraft maintenance, repair, and overhaul (MRO) operations. The aerospace industry's shift towards sustainable and environmentally friendly adhesive solutions is also contributing to the increased adoption of cyanoacrylate adhesives.
Remaining Segments in End User Industry
The automotive, building and construction, footwear and leather, and woodworking and joinery segments collectively form a substantial portion of the cyanoacrylate adhesives market. The automotive sector utilizes these automotive adhesives for various applications, including electronic component assembly and interior part bonding. The building and construction segment benefits from the quick-curing properties of cyanoacrylate adhesives in flooring and joinery applications. The footwear and leather industry relies on these adhesives for shoe manufacturing and repair, while the woodworking and joinery segment utilizes them for furniture production and wood bonding applications. Each of these segments contributes uniquely to the market's growth through diverse application requirements and technological advancements.
Segment Analysis: Technology
Reactive Segment in Cyanoacrylate Adhesives Market
The reactive technology segment dominates the global cyanoacrylate adhesives market, holding approximately 80% of the market share in 2024. Reactive cyanoacrylate adhesives are particularly popular due to their unique ability to react with moisture and rapidly polymerize to form strong bonds. These industrial adhesives are typically applied in thin layers to ensure rapid reaction progression and can cure effectively at room temperature with an optimum relative humidity of 40-60%. The segment's dominance is largely attributed to its widespread application across multiple industries, including electronic, marine, DIY, and medical sectors, where these adhesives are valued for their high structural properties and versatility in bonding various substrates like glass, plastic, and metal. The automotive industry particularly favors reactive cyanoacrylate adhesives for applications such as sunroof sealing, body side moldings, wire harnesses, and hand brake covers, owing to their ability to form strong joints with a tensile strength of 30 N/mm2 (4400 psi).
UV Cured Segment in Cyanoacrylate Adhesives Market
The UV cured adhesives segment is emerging as the fastest-growing technology in the cyanoacrylate adhesives market, with an expected growth rate of approximately 5% during 2024-2029. These adhesives offer unique advantages as they are 100% reactive, resulting in zero volatile losses during the curing process, making them environmentally friendly and non-polluting. The activation process is precisely controlled, occurring only when exposed to UV light within the 300-400 nm range. The healthcare industry is driving significant growth in this segment, accounting for nearly 88% of UV-cured cyanoacrylate adhesives consumption. These specialty adhesives are particularly valued in healthcare applications due to their high fixture speed, making them ideal for load-bearing medical equipment such as crutch bottoms, walkers, surgical instruments, and disposable medical devices. The versatility of UV-cured cyanoacrylate adhesives is further enhanced by their wide-ranging viscosity options, typically from 600 to 1,200 cP, allowing for precise application across various medical device manufacturing processes.
Cyanoacrylate Adhesives Market Geography Segment Analysis
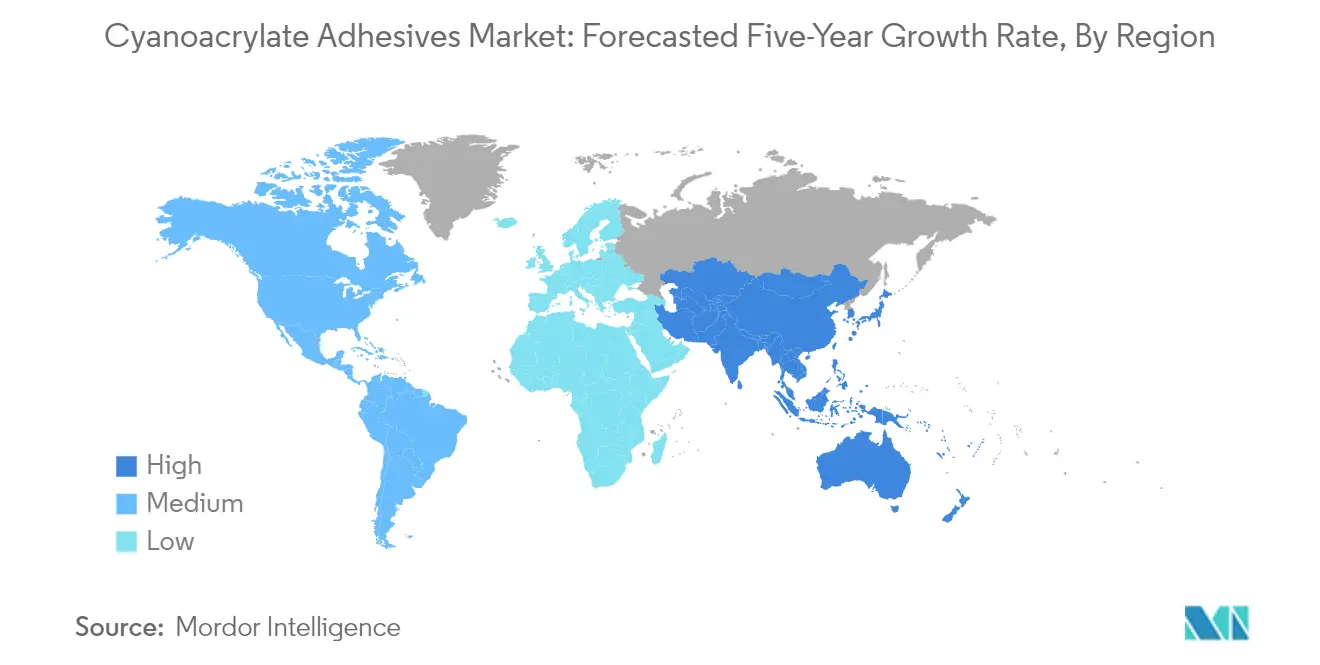
Cyanoacrylate Adhesives Market in Asia-Pacific
The Asia-Pacific region represents the dominant cyanoacrylate adhesives market, driven by robust growth across multiple end-user industries, including automotive, healthcare, electronics, and construction. Key markets like China, Japan, India, and South Korea contribute significantly to regional consumption. The region benefits from extensive manufacturing capabilities, growing industrialization, and increasing adoption of advanced adhesive technologies. Countries like Indonesia, Malaysia, and Thailand are emerging as important markets due to expanding industrial bases and rising domestic consumption. The presence of major global cyanoacrylate adhesive manufacturers and growing local players further strengthens the regional market dynamics.
Cyanoacrylate Adhesives Market in China
China maintains its position as the largest consumer of cyanoacrylate adhesives in the Asia-Pacific region, holding approximately 40% market share in 2024. The country's dominance is supported by its massive automotive and electronics manufacturing sectors. China's robust healthcare industry and growing medical device manufacturing capabilities drive substantial demand for high-quality adhesives. The country's furniture and woodworking sectors also contribute significantly to consumption. Extensive research and development activities, coupled with government initiatives promoting domestic manufacturing, further strengthen China's market position.
Cyanoacrylate Adhesives Market in Indonesia
Indonesia emerges as the fastest-growing market in the Asia-Pacific region, projected to grow at approximately 7% annually from 2024 to 2029. The country's rapid industrial development and increasing foreign investments in manufacturing sectors drive this growth. Indonesia's expanding electronics industry and rising domestic consumption of consumer goods contribute to increased demand. The country's growing healthcare sector and medical device manufacturing capabilities create additional opportunities. Government initiatives promoting industrial development and infrastructure projects further support market expansion.
Cyanoacrylate Adhesives Market in Europe
Europe represents a sophisticated cyanoacrylate adhesives market, characterized by strong technological innovation and stringent quality standards. The region's market is driven by advanced manufacturing sectors, particularly in Germany, France, and the United Kingdom. Countries like Italy, Spain, and Russia contribute significantly through their industrial applications and growing end-user industries. The region's focus on sustainable and environmentally friendly adhesive solutions shapes market development. Strong research and development activities and the presence of major cyanoacrylate manufacturers enhance market competitiveness.
Cyanoacrylate Adhesives Market in Germany
Germany leads the European market, commanding approximately 25% of regional consumption in 2024. The country's leadership position is anchored by its strong automotive and aerospace industries, which drive significant demand for high-performance adhesives. Germany's robust healthcare sector and medical device manufacturing capabilities further boost consumption. The country's emphasis on technological innovation and quality manufacturing processes maintains its market dominance. Extensive research and development activities in adhesive technologies strengthen Germany's market position.
Cyanoacrylate Adhesives Market in United Kingdom
The United Kingdom demonstrates the highest growth potential in Europe, with an expected growth rate of approximately 6% from 2024 to 2029. The country's market expansion is driven by increasing adoption in healthcare and electronics industries. Growing demand from automotive electronics and medical device manufacturing sectors supports market growth. The UK's focus on research and development in adhesive technologies creates new application opportunities. Government initiatives promoting manufacturing sector development contribute to market expansion.
Cyanoacrylate Adhesives Market in Middle East & Africa
The Middle East and Africa region presents a growing cyanoacrylate adhesives market, with diverse applications across industrial sectors. The region's market development is supported by increasing industrialization and infrastructure development activities. Both Saudi Arabia and South Africa serve as key markets, each contributing uniquely to regional consumption patterns.
Cyanoacrylate Adhesives Market in Saudi Arabia
Saudi Arabia leads the Middle East and African market, driven by substantial investments in industrial development and manufacturing capabilities. The country's growing healthcare sector and medical device manufacturing initiatives create significant demand. Infrastructure development projects and increasing automotive sector activities further support market growth. Government initiatives promoting industrial diversification contribute to market expansion.
Cyanoacrylate Adhesives Market in South Africa
South Africa emerges as the fastest-growing market in the region, supported by expanding industrial applications and manufacturing activities. The country's automotive sector development and growing healthcare industry drive market growth. Infrastructure development projects and increasing construction activities boost demand. South Africa's position as a regional manufacturing hub creates additional opportunities for market expansion.
Cyanoacrylate Adhesives Market in North America
North America represents a mature cyanoacrylate adhesives market, characterized by advanced manufacturing capabilities and high-end applications. The United States dominates the regional market as the largest consumer, while Canada and Mexico contribute significantly through their growing industrial bases. The region's strong healthcare sector, particularly in medical device manufacturing, drives substantial demand. Advanced automotive and aerospace industries further boost consumption. The United States leads in both market size and growth rate, supported by extensive research and development activities and the presence of major cyanoacrylate adhesive manufacturers.
Cyanoacrylate Adhesives Market in South America
South America demonstrates growing potential in the global cyanoacrylate adhesives market, with increasing industrial applications and manufacturing activities. Brazil emerges as both the largest and fastest-growing market in the region, driven by its robust automotive and healthcare sectors. Argentina also contributes significantly to regional consumption through its diverse industrial applications. The region's market development is supported by increasing investments in manufacturing capabilities and infrastructure development. Growing adoption in electronics and consumer goods manufacturing further drives market expansion.

Competitive Landscape
Top Companies in Cyanoacrylate Adhesives Market
The global cyanoacrylate adhesive manufacturers market is characterized by continuous product innovation and strategic expansion initiatives by leading manufacturers. Companies are heavily investing in research and development to develop sustainable and high-performance adhesive solutions, particularly focusing on low VOC content and improved bonding capabilities. Operational agility has become crucial as manufacturers aim to strengthen their supply chain networks and distribution partnerships across key regions. Strategic moves predominantly involve acquisitions and partnerships to enhance market presence and technological capabilities, with a notable focus on emerging markets in the Asia-Pacific and Middle East regions. Companies are also expanding their production facilities and establishing new manufacturing units to meet the growing demand from various end-user industries, particularly in the healthcare, automotive, and electronics sectors.
Market Structure Shows Strong Global Leaders
The cyanoacrylate adhesives market exhibits a partially consolidated structure with global chemical conglomerates dominating the landscape. Major players like Henkel, H.B. Fuller, and Arkema Group maintain significant market presence through their extensive product portfolios and global distribution networks. These companies leverage their strong manufacturing capabilities, established brand reputation, and technical expertise to maintain their competitive positions. Regional players and specialists focus on niche applications and local market requirements, particularly in emerging economies where they maintain strong relationships with end-users.
The market has witnessed strategic consolidation through mergers and acquisitions, primarily driven by the need to expand geographical presence and enhance technological capabilities. Large companies are actively acquiring smaller, specialized manufacturers to strengthen their product offerings and gain access to new markets. This trend is particularly evident in developing regions where local knowledge and established distribution networks are crucial for market success. The industry also sees increasing collaboration between adhesive manufacturers and end-user industries to develop customized solutions for specific applications.
Innovation and Sustainability Drive Future Success
For established players to maintain and expand their market share, a focus on sustainable product development and technological innovation has become essential. Companies are investing in eco-friendly formulations and improved bonding technologies to meet evolving customer requirements and regulatory standards. Building strong relationships with key end-user industries through technical support and customized solutions remains crucial. Additionally, developing efficient distribution networks and maintaining price competitiveness while ensuring product quality are vital strategies for market leaders.
New entrants and smaller players can gain ground by focusing on specialized applications and regional markets where they can offer tailored solutions and superior customer service. Success in the market increasingly depends on the ability to adapt to changing end-user requirements, particularly in high-growth sectors like healthcare and electronics. Companies must also consider potential regulatory changes regarding environmental protection and safety standards, which could impact product development and manufacturing processes. The risk of substitution from alternative bonding technologies necessitates continuous innovation and a clear demonstration of product value proposition to maintain market position. The cyanoacrylate manufacturer landscape is evolving with these trends, highlighting the importance of innovation in the adhesive industry.
Cyanoacrylate Adhesives Industry Leaders
3M
Aica Kogyo Co..Ltd.
Arkema Group
H.B. Fuller Company
Henkel AG & Co. KGaA
- *Disclaimer: Major Players sorted in no particular order


Recent Industry Developments
- May 2022: ITW Performance Polymers announced a distribution partnership with PREMA SA in Poland for its Devcon brand.
- February 2022: H.B. Fuller announced the acquisition of Fourny NV to strengthen its Construction Adhesives business in Europe.
- January 2022: H.B. Fuller announced the acquisition of UK-based Apollo Chemicals to expand its foothold in the European market.


Global Cyanoacrylate Adhesives Market Report Scope
Aerospace, Automotive, Building and Construction, Footwear and Leather, Healthcare, Woodworking and Joinery are covered as segments by End User Industry. Reactive, UV Cured Adhesives are covered as segments by Technology. Asia-Pacific, Europe, Middle East & Africa, North America, South America are covered as segments by Region.End User Industry
| Aerospace |
| Automotive |
| Building and Construction |
| Footwear and Leather |
| Healthcare |
| Woodworking and Joinery |
| Other End-user Industries |
Technology
| Reactive |
| UV Cured Adhesives |
Region
| Asia-Pacific | Australia |
| China | |
| India | |
| Indonesia | |
| Japan | |
| Malaysia | |
| Singapore | |
| South Korea | |
| Thailand | |
| Rest of Asia-Pacific | |
| Europe | France |
| Germany | |
| Italy | |
| Russia | |
| Spain | |
| United Kingdom | |
| Rest of Europe | |
| Middle East & Africa | Saudi Arabia |
| South Africa | |
| Rest of Middle East & Africa | |
| North America | Canada |
| Mexico | |
| United States | |
| Rest of North America | |
| South America | Argentina |
| Brazil | |
| Rest of South America |
| End User Industry | Aerospace | |
| Automotive | ||
| Building and Construction | ||
| Footwear and Leather | ||
| Healthcare | ||
| Woodworking and Joinery | ||
| Other End-user Industries | ||
| Technology | Reactive | |
| UV Cured Adhesives | ||
| Region | Asia-Pacific | Australia |
| China | ||
| India | ||
| Indonesia | ||
| Japan | ||
| Malaysia | ||
| Singapore | ||
| South Korea | ||
| Thailand | ||
| Rest of Asia-Pacific | ||
| Europe | France | |
| Germany | ||
| Italy | ||
| Russia | ||
| Spain | ||
| United Kingdom | ||
| Rest of Europe | ||
| Middle East & Africa | Saudi Arabia | |
| South Africa | ||
| Rest of Middle East & Africa | ||
| North America | Canada | |
| Mexico | ||
| United States | ||
| Rest of North America | ||
| South America | Argentina | |
| Brazil | ||
| Rest of South America | ||


Market Definition
- End-user Industry - Building & Construction, Automotive, Aerospace, Woodworking & Joinery, Footwear & Leather, Healthcare, and Others are the end-user industries considered under the cyanoacrylate adhesives market.
- Product - All cyanoacrylate adhesive products are considered in the market studied
- Resin - Under the scope of the study, cyanoacrylates based on Alkoxy Ethyl, Ethyl Ester, Methyl Ester, and Others are considered
- Technology - For the purpose of this study, Reactive and UV Cured adhesive technologies are taken into consideration.
| Keyword | Definition |
|---|---|
| Hot-melt Adhesive | Hot melt adhesives are generally 100% solid formulations, based on thermoplastic polymers. They are solid at room temperature and are activated upon heating above their softening point, at which stage they are liquid, and hence, can be processed. |
| Reactive Adhesive | A reactive adhesive is made up of monomers that react in the adhesive curing process and do not evaporate from the film during use. Instead, these volatile components become chemically incorporated into the adhesive. |
| Solvent-borne Adhesive | Solvent-borne adhesives are mixtures of solvents and thermoplastic, or slightly cross-linked polymers, such as polychloroprene, polyurethane, acrylic, silicone, and natural and synthetic rubbers (elastomers). |
| Water-borne Adhesive | Water-borne adhesives use water as a carrier or diluting medium to disperse a resin. They are set by allowing the water to evaporate or be absorbed by the substrate. These adhesives are compounded with water as a diluent, rather than a volatile organic solvent. |
| UV Cured Adhesive | UV curing adhesives induce curing and create a permanent bond without heating by using ultraviolet (UV) light or other radiation sources. An aggregation of monomers and oligomers is cured or polymerized by ultraviolet (UV) or visible light in a UV adhesive. Because UV is a radiating energy source, UV adhesives are often referred to as radiation curing or rad-cure adhesives. |
| Heat-resistant Adhesive | Heat-resistant Adhesives refer to those that do not break down under high temperatures. One aspect of a complicated system of circumstances is the adhesive's capacity to withstand disintegration brought on by high temperatures. As the temperature rises, adhesives may liquefy. They can withstand stresses resulting from differing coefficients of expansion and contraction, which might be an additional advantage. |
| Reshoring | Reshoring is the practice of moving commodity production and manufacturing back to the nation where the business was founded. Onshoring, inshoring, and back shoring are further terms used. Offshoring, the practice of producing items abroad to lower labor and manufacturing costs, is the opposite of this. |
| Oleochemicals | Oleochemicals are compounds produced from biological oils or fats. They resemble petrochemicals, which are substances made from petroleum. The oleochemical business is built on the hydrolysis of oils or fats. |
| Nonporous Materials | Nonporous materials are substances that do not permit the passage of liquid or air. Nonporous materials are those that are not porous, such as glass, plastic, metal, and varnished wood. Since no air can get through, less airflow is required to raise these materials, negating the requirement for high airflow. |
| EU-Vietnam Free Trade Agreement | A trade agreement and an investment protection agreement were concluded between the European Union and Vietnam on June 30, 2019. |
| VOC content | Compounds with limited solubility in water and high vapor pressure are known as Volatile Organic Compounds (VOCs). Many VOCs are human-made chemicals that are used and produced in the manufacture of paints, pharmaceuticals, and refrigerants. |
| Emulsion Polymerization | Emulsion polymerization is a method of producing polymers or connected groups of smaller chemical chains known as monomers, in a water solution. The method is often used to make water-based paints, adhesives, and varnishes, in which the water stays with the polymer and is marketed as a liquid product. |
| 2025 National Packaging Targets | In 2018, the Australian Environment Ministry set the following 2025 National Packaging Targets: 100% of the packaging must be reusable, recyclable, or compostable by 2025, 70% of plastic packaging must be recycled or composted by 2025, 50% of average recycled content must be included in packaging by 2025, and problematic and unnecessary single-use plastic packaging must be phased out by 2025. |
| Russian Government’s Import Substitution Policy | The Western sanctions suspended the distribution of several high-tech items to Russia, including those required by the raw material export sectors and the military-industrial complex. In response, the government launched an "import substitution" scheme, appointing a special commission to oversee its implementation in early 2015. |
| Paper Substrate | Paper substrates are paper sheets, reels, or boards with a base weight of up to 400 g/m2 that has not been converted, printed or otherwise altered. |
| Insulation Material | A material that inhibits or blocks heat, sound, or electrical transmission is known as Insulation Material. The variety of insulation materials includes thick fibers like fiberglass, rock and slag wool, cellulose, and natural fibers as well as stiff foam boards and sleek foils. |
| Thermal Shock | A temperature change known as thermal shock generates stress in a material. It commonly results in material breakdown and is especially prevalent in brittle materials like ceramics. When there is a quick temperature change, either from hot to cold or vice versa, this process occurs abruptly. It occurs more frequently in materials with poor heat conductivity and insufficient structural integrity. |


Research Methodology
Mordor Intelligence follows a four-step methodology in all our reports.
- Step-1: Identify Key Variables: The quantifiable key variables (industry and extraneous) pertaining to the specific product segment and country are selected from a group of relevant variables & factors based on desk research & literature review; along with primary expert inputs. These variables are further confirmed through regression modeling (wherever required).
- Step-2: Build a Market Model: In order to build a robust forecasting methodology, the variables and factors identified in Step-1 are tested against available historical market numbers. Through an iterative process, the variables required for market forecast are set and the model is built on the basis of these variables.
- Step-3: Validate and Finalize: In this important step, all market numbers, variables and analyst calls are validated through an extensive network of primary research experts from the market studied. The respondents are selected across levels and functions to generate a holistic picture of the market studied.
- Step-4: Research Outputs: Syndicated Reports, Custom Consulting Assignments, Databases & Subscription Platforms


