
Connected TV Advertising Market Size and Share
Market Overview
| Study Period | 2020 - 2031 |
|---|---|
| Market Size (2026) | USD 51.89 Billion |
| Market Size (2031) | USD 84.91 Billion |
| Growth Rate (2026 - 2031) | 10.35 % |
| Fastest Growing Market | Asia-Pacific |
| Largest Market | North America |
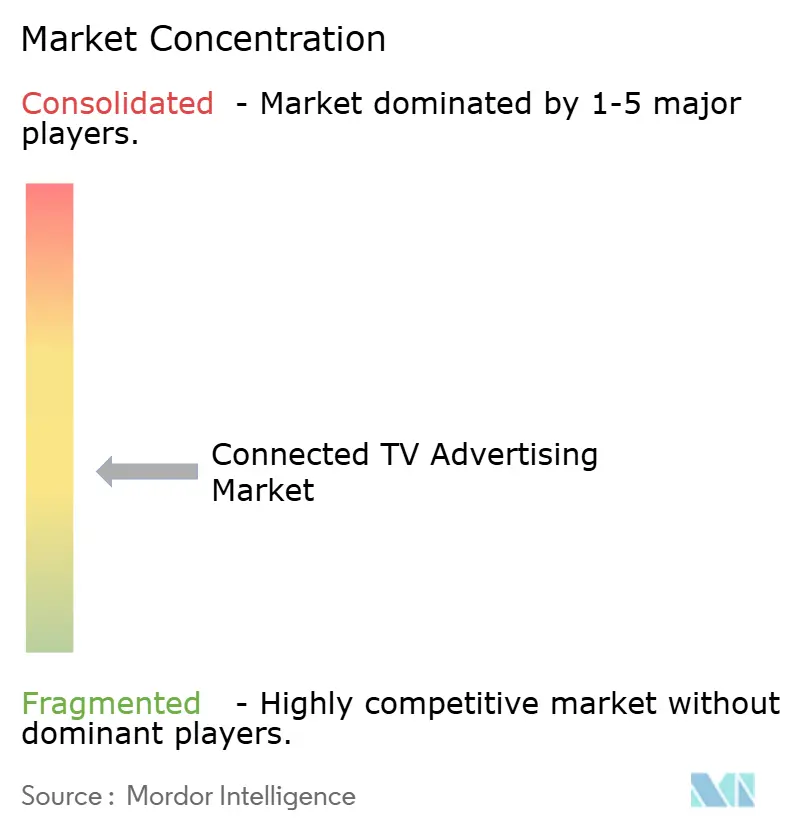
| Market Concentration | Medium |
Major Players *Disclaimer: Major Players sorted in no particular order Image © Mordor Intelligence. Reuse requires attribution under CC BY 4.0. | |
Connected TV Advertising Market Analysis by Mordor Intelligence
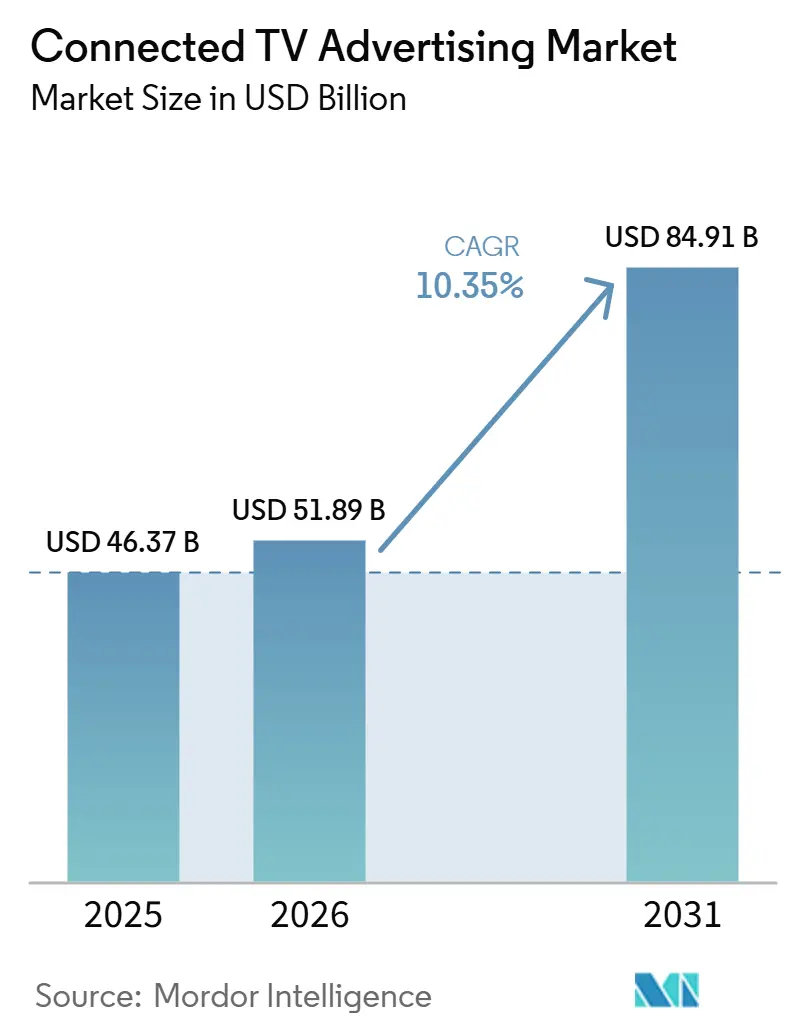
The connected TV advertising market size was valued at USD 46.37 billion in 2025 and is projected to reach USD 84.91 billion by 2031, at a CAGR of 10.35% during 2026-2031. Growth is being supported by a steady movement of viewing time toward streaming services, which is pulling brand budgets into digital television environments with better targeting and clearer campaign control. The rise of ad-supported streaming services and FAST channels is widening available inventory and giving advertisers more ways to balance premium reach with cost efficiency. Programmatic buying is also becoming more central to campaign execution, which is raising the importance of device-level data, operating system access, and direct control over sell-side infrastructure. Competitive positioning is increasingly shaped by platform ownership, data access, and the ability to package premium content with measurable ad delivery across large household audiences. As a result, the connected TV advertising market is moving beyond simple channel growth and into a phase where infrastructure, monetization design, and advertiser trust will determine who captures the largest share of value.
Key Report Takeaways
- By ad placement, mid-roll ads led with 45.49% revenue share in 2025, while pre-roll ads are projected to expand at a 10.81% CAGR through 2031.
- By ad format, video ads accounted for 78.83% of revenue in 2025, while interactive ads are expected to record the fastest growth at an 11.12% CAGR through 2031.
- By device type, smart TVs held 59.65% of revenue in 2025, while streaming media players are forecast to grow at a 10.45% CAGR through 2031.
- By end user, media and entertainment held 29.34% of revenue in 2025, while retail and e-commerce is projected to expand at an 11.25% CAGR through 2031.
- By geography, North America held 38.42% of the connected TV advertising market in 2025, while Asia-Pacific is expected to grow at a 10.64% CAGR through 2031.
Note: Market size and forecast figures in this report are generated using Mordor Intelligence’s proprietary estimation framework, updated with the latest available data and insights as of January 2026.
Global Connected TV Advertising Market Trends and Insights
Drivers Impact Analysis*
| Driver | (~) % Impact on CAGR Forecast | Geographic Relevance | Impact Timeline |
|---|---|---|---|
| Streaming Audience Migration from Linear Television | +2.8% | Global, concentrated impact in North America and Europe | Short term (≤ 2 years) |
| Expansion Of Ad-Supported Streaming and FAST Inventory | +2.3% | North America, expanding to Europe and Asia-Pacific | Short term (≤ 2 years) |
| Programmatic Buying and Automated Yield Optimization | +1.9% | Global, with North America and Europe leading adoption | Medium term (2-4 years) |
| Live Sports and Premium Event Monetization | +1.1% | Global, with North America and Europe most advanced and Asia-Pacific emerging | Medium term (2-4 years) |
| Retail Media and Commerce-Linked CTV Activation | +0.8% | North America, with early gains in Europe and Asia-Pacific | Medium term (2-4 years) |
| Privacy-Safe First-Party Data and Contextual Targeting | +0.5% | Global, with stronger regulatory relevance in the EU and California | Long term (≥ 4 years) |
| Source: Mordor Intelligence | |||
Streaming Audience Migration from Linear Television
Audience movement away from linear television remains the most basic force behind the connected TV advertising market. Viewers are spending more time in streaming environments, and that is changing where advertisers look for household reach and repeated exposure. This shift matters because connected TV combines the living room screen with digital delivery, which makes campaign control stronger than in traditional television buying. The result is a market where brand budgets are following audience behavior rather than waiting for old viewing patterns to return. That audience migration also strengthens the long-term case for the connected TV advertising market because inventory growth and buyer demand are moving in the same direction.
Expansion of Ad-Supported Streaming and FAST Inventory
The expansion of ad-supported services and FAST channels is increasing the amount of sellable inventory across the connected TV advertising market. Gracenote reported that active FAST channels in key markets reached more than 1,610 as of March 2025, and the total nearly doubled from mid-2023, with channel count rising 21% during 2025.[1]Gracenote, “2025 FAST Report,” Gracenote, gracenote.com That growth gives advertisers more access to broad-reach viewing environments that sit outside traditional subscription video models. It also gives publishers more room to test new ad loads, packaging models, and audience groupings without depending on a single type of streaming service. Wurl stated that FAST ad revenues are projected to exceed USD 12 billion by 2027, which shows why the connected TV advertising market continues to attract more demand from buyers looking for scalable video inventory.
Programmatic Buying and Automated Yield Optimization
Programmatic execution is becoming a core operating layer for the connected TV advertising market rather than an optional buying method. Premion reported that 50% of CTV and OTT advertising is expected to be purchased programmatically in 2026, while 34.6% of CTV ad dollars are now moving through real-time bidding channels, up from 9.5% in 2019.[2]Premion, “New Survey, More Than 70% of CTV Advertisers Will Increase Spending by an Average of 17% in 2026,” Premion, premion.com This change helps buyers move faster, compare supply more easily, and connect campaigns to larger pools of authenticated inventory. It also rewards publishers and platform owners that can support premium private deals, cleaner audience signals, and more stable delivery standards. The Trade Desk’s February 2026 Ventura Ecosystem launch showed that infrastructure partnerships are now part of the competitive logic of the connected TV advertising market, especially where device operating systems and streaming platforms want more control over monetization flows.
Live Sports and Premium Event Monetization
Live sports and other premium event programming are becoming more important to the connected TV advertising market because they deliver large audiences in real time and support premium pricing. These formats are especially valuable because they combine appointment viewing with strong brand safety and low skip behavior. The commercial focus is shifting from simple rights ownership to the ability to package live inventory in ways that work across programmatic and direct channels. Gracenote and PubMatic said in June 2026 that their partnership would allow programmatic CTV inventory to be discovered and transacted using episode-level and live sports metadata in real time, which shows how premium live content is becoming easier to monetize at scale.[3]Gracenote and PubMatic, “Gracenote and PubMatic Bring Curated Live Sports and Content-Level Deals to Programmatic CTV,” PR Newswire, prnewswire.com As more premium events are sold with better data and clearer content signals, the connected TV advertising market is likely to see stronger buyer interest in high-value video placements.
Restraints Impact Analysis*
| Restraint | (~) % Impact on CAGR Forecast | Geographic Relevance | Impact Timeline |
|---|---|---|---|
| Measurement Fragmentation Across Walled Gardens | -1.3% | Global, most acute in North America and Europe | Short term (≤ 2 years) |
| Limited Show-Level Transparency and Content Visibility | -0.8% | Global, most commercially acute in North America and Europe | Short term (≤ 2 years) |
| Fraud Risk and Misrepresented Inventory | -0.5% | Global, with higher invalid traffic pressure in Asia-Pacific, Europe, Middle East and Africa | Medium term (2-4 years) |
| Premium Live Inventory Cost and Yield Protection Pressure | -0.3% | Global, concentrated in North America and Europe where sports rights costs are highest | Medium term (2-4 years) |
| Source: Mordor Intelligence | |||
Measurement Fragmentation Across Walled Gardens
Measurement fragmentation remains one of the clearest limits on faster spending growth in the connected TV advertising market. Buyers still face different reporting methods, identity frameworks, and attribution rules across major streaming platforms, which makes cross-platform comparison difficult. This matters because budget migration depends on a clear link between campaign spend and business outcomes, especially when brands are moving money from long-established television plans. IAB responded to this problem in 2025 with guidance that called for standardized Conversion API adoption for connected TV, which shows that the market still needs common measurement practices to improve advertiser confidence. Until those standards are used more widely, the connected TV advertising market will continue to face friction when large brand budgets are reviewed against more measurable digital channels.
Limited Show-Level Transparency and Content Visibility
Limited show-level transparency also slows spending decisions in the connected TV advertising market because advertisers often know the audience they want without seeing enough detail on the exact program context. That gap weakens planning confidence for buyers who want to match brand messages with relevant content environments rather than rely only on audience segments. It also reduces the ability of publishers to prove the added value of premium programming in automated auctions. The June 2026 Gracenote and PubMatic partnership directly addressed this problem by linking inventory packaging to content-level metadata and live sports attributes in programmatic transactions. If show-level visibility improves, the connected TV advertising market should be better placed to attract larger contextual and brand-led campaign commitments.
*Our forecasts treat driver/restraint impacts as directional, not additive. The impact forecasts reflect baseline growth, mix effects, and variable interactions.
Segment Analysis
By Ad Placement: Mid-Roll Anchors Revenue While Pre-Roll Builds Momentum
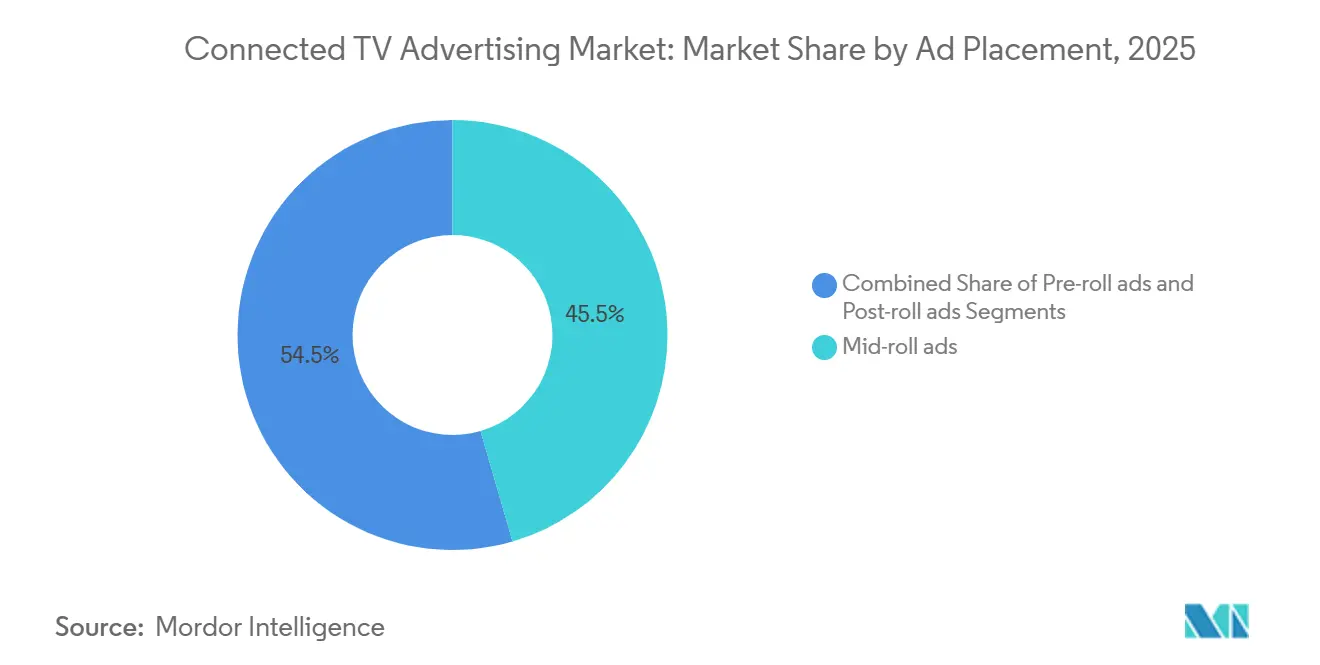
Mid-roll ads held 45.49% of the connected TV advertising market size in 2025, which kept this format in the leading revenue position. The segment benefits from being placed inside the viewing session rather than at the start or the end, which makes it more central to monetization for premium streaming services. In the connected TV advertising market, mid-roll inventory also fits well with longer-form content where platforms can manage ad load without changing the basic viewing experience. That makes it useful for both premium subscription services with ad tiers and FAST services that depend more heavily on advertising revenue. The segment’s current lead suggests that platforms still prefer formats that can be inserted naturally into established content breaks.
Pre-roll ads are projected to grow at a 10.81% CAGR through 2031, which shows that buyers still value formats that are simple to deploy and easy to scale across varied content types. Pre-roll placement works well for advertisers entering the connected TV advertising market from digital video and display campaigns because it aligns with familiar buying logic and broad reach goals. Post-roll ads remain part of the placement mix, though they are more often used to extend message exposure than to carry the core burden of campaign delivery. The IAB Tech Lab’s CTV Ad Portfolio, published in December 2025, also widened the placement discussion by standardizing 6 new formats for programmatic trade, including pause ads, menu ads, screensaver ads, in-scene ads, squeezebacks, and overlays. That standardization gives the connected TV advertising market more ways to package attention beyond the traditional pre-roll, mid-roll, and post-roll structure.



By Ad Format: Video Dominates Inventory While Interactive Ads Reshape Performance Expectations
Video ads accounted for 78.83% of the connected TV advertising market size in 2025, which shows that the format still defines how advertisers use the television screen in streaming environments. Full-screen video remains the most direct way to deliver reach, recall, and brand messaging on connected television devices. Its lead also reflects the fact that most premium streaming inventory is built around video delivery rather than static or companion formats. In the connected TV advertising industry, this keeps video at the center of pricing, inventory planning, and campaign design. The segment’s position is unlikely to weaken quickly because video continues to match both advertiser expectations and platform economics.
Interactive ads are forecast to expand at an 11.12% CAGR through 2031, which signals that performance-led use cases are becoming more important across the connected TV advertising market. The move toward interactivity reflects demand for formats that can connect viewing with shopping, search, or response actions in a more direct way. Display ads still matter in the connected TV advertising market, especially on home screens and pause surfaces where platforms can create new inventory outside standard video pods. The IAB Tech Lab’s 2025 portfolio supports this shift by making more nontraditional CTV formats easier to transact programmatically across demand and supply platforms. As these formats become easier to buy and measure, the connected TV advertising industry is likely to support a broader mix of branding and conversion-led campaigns on the same screen.
By Device Type: Smart TVs Extend Their Lead While Streaming Media Players Accelerate
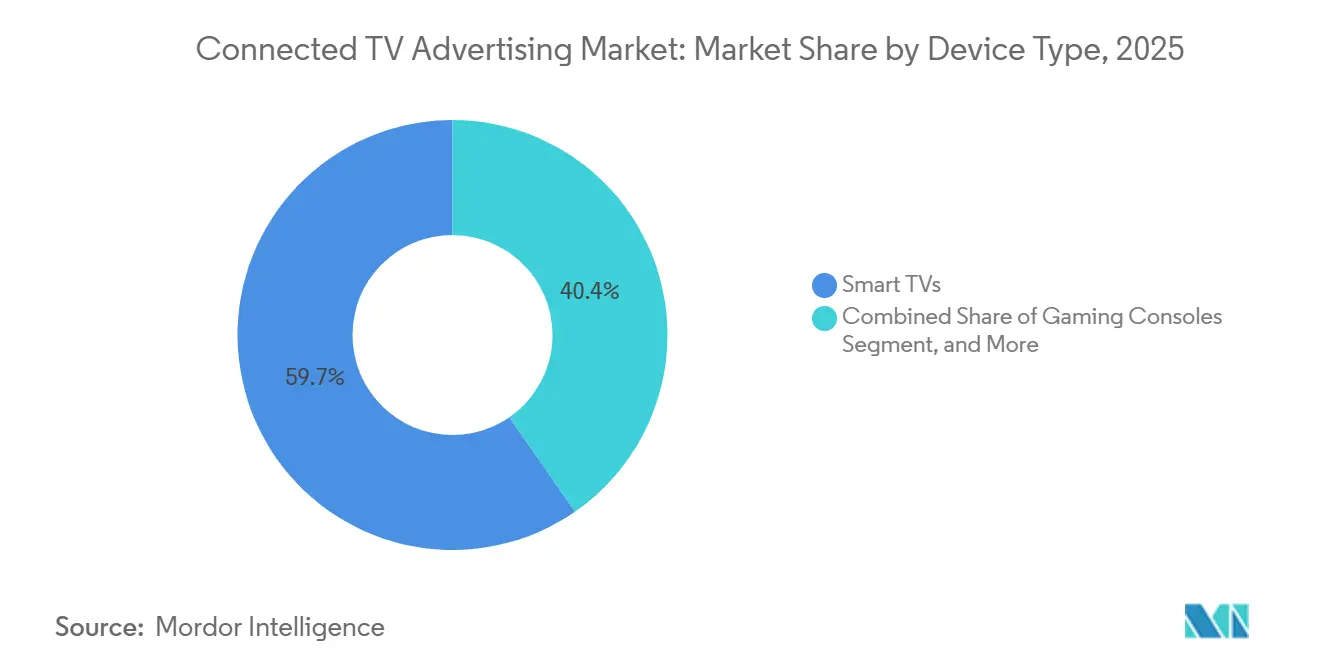
Smart TVs represented 59.65% of the connected TV advertising market size in 2025, which confirmed their role as the primary access point for streaming content in the home. Their lead comes from direct integration between the television, the operating system, and the content environment where ads are served. This gives smart TV owners a stronger position in data collection, inventory control, and home screen monetization. In the connected TV advertising market, that combination makes smart TVs more than just hardware because they shape how viewers discover content and how advertisers reach households. Gaming consoles remain a secondary device category, but they still offer value where advertisers want younger and highly engaged audiences.
Streaming media players are projected to grow at a 10.45% CAGR through 2031, which points to continued demand for dedicated streaming operating systems and device ecosystems. Roku’s scale and its role in household-level distribution remain important signals for the connected TV advertising market, especially after Fox announced its plan to acquire Roku in June 2026. Device-level platform control is becoming more valuable because it affects ad serving, data access, and the route through which demand partners can activate campaigns. The Ventura Ecosystem also showed that operating system owners and streaming infrastructure partners are trying to build stronger monetization frameworks around device reach. This means the connected TV advertising market is increasingly influenced by which companies control the screen entry point rather than only the content being watched.
By End User: Entertainment Holds Ground While Retail Commerce Redraws the Competitive Map
Media and entertainment held 29.34% of the connected TV advertising market share in 2025, which kept it as the largest end-user segment. This position reflects a natural fit between entertainment brands and streaming-first audiences that already spend significant time in connected viewing environments. These advertisers also tend to understand release timing, audience targeting, and promotional pacing more deeply than many other categories because they operate inside the same media system. In the connected TV advertising market, that allows entertainment companies to use the channel for launch support, audience extension, and cross-platform promotion. The segment therefore retains a durable role even as newer advertiser groups increase their spending.
Retail and e-commerce is forecast to grow at an 11.25% CAGR through 2031, which makes it the fastest-growing end-user segment in the connected TV advertising market. The shift is tied to a broader move toward shoppable media, retail data activation, and campaigns that link awareness with direct response. This is changing the way the connected TV advertising industry is used because brands no longer treat the television screen only as an upper-funnel branding tool. Automotive, healthcare, financial services, and travel also remain active in the connected TV advertising market because they can target households at moments that align with major purchase decisions. As retail-led activation grows, the connected TV advertising market is likely to carry a more balanced mix of brand-building and conversion-oriented campaign goals.
Geography Analysis
North America held 38.42% of the connected TV advertising market size in 2025, which kept the region in the leading position. The region benefits from mature programmatic systems, broad streaming inventory, and high household use of connected television devices. It also remains the most developed market for packaging premium content with data-led audience buying. In the connected TV advertising market, this gives North America a strong advantage in monetization depth and transaction efficiency. Fox’s announced acquisition of Roku in June 2026 showed how valuable platform control has become in this region because it combines content, operating system reach, and ad infrastructure in one proposed structure.
Asia-Pacific is forecast to grow at a 10.64% CAGR through 2031, making it the fastest-growing region in the connected TV advertising market. Growth is being supported by rising smart TV adoption, broader broadband availability, and a less entrenched linear television structure in several countries. Japan stands out within the connected TV advertising market because CyberAgent reported that the country’s CTV video advertising market grew 127% year over year in 2025 to JPY 129.5 billion, (USD 869 million). The region is not moving at the same speed in every country, but the direction is clear and the base of connected viewing households is widening. That makes Asia-Pacific an important growth engine for the connected TV advertising market over the forecast period.
Europe is becoming more important to the connected TV advertising market as digital video gains a larger place in regional advertising budgets. IAB Europe reported that European digital ad spend reached EUR 131.1 billion (USD 147.8 billion), and video accounted for more than half of all display investment in 2025. This matters because connected television is part of the wider video expansion taking place across the region. Data use and consent rules also remain important in Europe, which gives first-party data management and clean-room partnerships a larger strategic role. In the Middle East, IAB MENA reported that CTV advertising grew 31% in 2025, ahead of overall digital market growth of 17.8%, which shows that connected viewing is gaining weight beyond the largest established regions. Africa remains a longer-term opportunity for the connected TV advertising market as broadband coverage improves and streaming adoption becomes more widespread across younger populations.
Competitive Landscape
The connected TV advertising market is becoming more concentrated around platform control while remaining fragmented across many mid-tier supply paths. Companies that own operating systems, large-scale streaming environments, or direct demand links are in a stronger position than firms that only aggregate inventory. That is because household data, ad serving control, and premium content access now work together as one commercial advantage. In the connected TV advertising market, the strongest players are the ones that can combine reach, measurement, and transaction efficiency in the same system. This is pushing the market toward a structure where infrastructure matters as much as media ownership.
Fox’s planned acquisition of Roku was one of the clearest strategic moves in the connected TV advertising market during 2026 because it aimed to join content assets with device reach and advertising technology. The Trade Desk’s Ventura Ecosystem represented a different move because it focused on open collaboration among operating systems and streaming platforms rather than ownership through acquisition. Magnite also expanded its position in the connected TV advertising market by launching Magnite Orchestration in June 2026 to connect buyer agents with its premium inventory and supply-side intelligence. These moves show that the market is no longer competing only on inventory volume. It is also competing on workflow control, automation, and the ability to make premium supply easier to buy.
Independent supply-side firms are responding by building more specialized tools inside the connected TV advertising market. PubMatic’s June 2026 launch of Creator Marketplace showed one path, which was to connect premium creator-led CTV inventory with programmatic demand in a more organized way. IAB Tech Lab’s CTV Ad Portfolio also supports competition by reducing friction around newer ad formats and helping more publishers bring those formats into automated trade. The connected TV advertising market still has room for many participants, but the advantage is shifting toward firms that offer cleaner data, more transparent supply, and easier execution for buyers. That combination should keep the top layer of the connected TV advertising market relatively concentrated even while the rest of the ecosystem stays broad and competitive.
Connected TV Advertising Industry Leaders
The Trade Desk, Inc.
Google LLC
Amazon.com, Inc.
Roku, Inc.
Magnite, Inc.
- *Disclaimer: Major Players sorted in no particular order

Recent Industry Developments
- June 2026: Fox Corporation and Roku announced a definitive agreement for Fox to acquire Roku for USD 160 per share in a cash and stock transaction valued at approximately USD 22 billion. The deal, expected to close in the first half of 2027 pending regulatory and shareholder approval, combines Fox's live sports and FAST content portfolio, including Tubi, with Roku's CTV operating system reaching 100 million global households and its demand-side platform infrastructure, creating the third-largest organization in US television by share of viewing.
- June 2026: Magnite launched Magnite Orchestration, June 11, 2026, a coordination layer enabling buyers to connect their AI buyer agents to Magnite's sell-side agent and access the company's premium inventory pool, supply-side intelligence, and campaign automation. Early testing partners included dentsu and DIRECTV Advertising, positioning Magnite as an agentic advertising infrastructure provider at a moment when AI-driven campaign management is becoming a competitive differentiator.
- June 2026: Gracenote, Nielsen's content intelligence business, and PubMatic announced a strategic partnership, June 17, 2026, enabling programmatic CTV inventory to be discovered, evaluated, and transacted based on episode-level content metadata and live sports programming attributes. The integration allows advertisers to associate bid opportunities with specific Gracenote content IDs at auction in real time, directly addressing the show-level transparency gap that inhibits contextual CTV targeting at scale.
- June 2026: PubMatic launched its Creator Marketplace, June 18, 2026, the first programmatic CTV auction connecting independent creator media companies' premium CTV inventory with programmatic demand, with MeatEater, a leading outdoor lifestyle media brand, as the inaugural partner, expanding access to niche, highly engaged audiences outside the major streaming platform inventory pools.


Global Connected TV Advertising Market Report Scope
The Global Connected TV (CTV) Advertising Market refers to the worldwide ecosystem of advertising activities conducted through internet-connected television devices, including smart TVs, streaming media players, gaming consoles, and connected set-top boxes, that enable the delivery of digital video advertisements to viewers accessing streamed content.
The Connected TV Advertising Market Report is Segmented by Ad Placement (Pre-roll, Mid-roll, and Post-roll), Ad Format (Video Ads, Display Ads, Interactive Ads, and Other Ad Formats (Audio Ads etc)), Device Type (Smart TVs, Gaming Consoles, and Other Device Types), End User (Media and Entertainment, Retail and E-Commerce, Automotive, Healthcare and Pharmaceuticals, Financial Services, Travel and Hospitality, and Other End Users), and Geography (North America, South America, Europe, Asia-Pacific, Middle East, and Africa). The Market Forecasts are Provided in Terms of Value (USD).
| Pre-roll ads |
| Mid-roll ads |
| Post-roll ads |
| Video Ads |
| Display Ads |
| Interactive Ads |
| Other Ad Formats (Audio Ads etc) |
| Smart TVs |
| Gaming Consoles |
| Other Device Types |
| Media and Entertainment |
| Retail and E-Commerce |
| Automotive |
| Healthcare and Pharmaceuticals |
| Financial Services |
| Travel and Hospitality |
| Other End Users |
| North America | United States |
| Canada | |
| Mexico | |
| South America | Brazil |
| Argentina | |
| Chile | |
| Rest of South America | |
| Europe | Germany |
| United Kingdom | |
| France | |
| Italy | |
| Spain | |
| Rest of Europe | |
| Asia-Pacific | China |
| Japan | |
| India | |
| South Korea | |
| Australia | |
| Rest of Asia-Pacific | |
| Middle East | Saudi Arabia |
| United Arab Emirates | |
| Qatar | |
| Rest of Middle East | |
| Africa | South Africa |
| Egypt | |
| Nigeria | |
| Rest of Africa |
| Ad Placement | Pre-roll ads | |
| Mid-roll ads | ||
| Post-roll ads | ||
| By Ad Format | Video Ads | |
| Display Ads | ||
| Interactive Ads | ||
| Other Ad Formats (Audio Ads etc) | ||
| By Device Type | Smart TVs | |
| Gaming Consoles | ||
| Other Device Types | ||
| By End User | Media and Entertainment | |
| Retail and E-Commerce | ||
| Automotive | ||
| Healthcare and Pharmaceuticals | ||
| Financial Services | ||
| Travel and Hospitality | ||
| Other End Users | ||
| By Geography | North America | United States |
| Canada | ||
| Mexico | ||
| South America | Brazil | |
| Argentina | ||
| Chile | ||
| Rest of South America | ||
| Europe | Germany | |
| United Kingdom | ||
| France | ||
| Italy | ||
| Spain | ||
| Rest of Europe | ||
| Asia-Pacific | China | |
| Japan | ||
| India | ||
| South Korea | ||
| Australia | ||
| Rest of Asia-Pacific | ||
| Middle East | Saudi Arabia | |
| United Arab Emirates | ||
| Qatar | ||
| Rest of Middle East | ||
| Africa | South Africa | |
| Egypt | ||
| Nigeria | ||
| Rest of Africa | ||


Key Questions Answered in the Report
What is the current size of the connected TV advertising market?
The connected TV advertising market size was USD 46.37 billion in 2025 and is projected to reach USD 84.91 billion by 2031 at a 10.35% CAGR during 2026-2031.
Which region leads connected TV advertising revenue?
North America led with 38.42% of global revenue in 2025, supported by mature programmatic infrastructure, strong streaming inventory, and high connected TV usage.
Which region is growing fastest in connected TV advertising?
Asia-Pacific is the fastest-growing region, with a projected 10.64% CAGR through 2031, supported by rising smart TV use and expanding streaming access.
Which ad format is most important on connected TV?
Video remains the leading format, accounting for 78.83% of revenue in 2025, because it matches the full-screen viewing environment and remains central to premium streaming monetization.
What is driving retail and e-commerce growth on connected TV?
Retail and e-commerce is the fastest-growing end-user segment at an 11.25% CAGR through 2031 because advertisers are using connected TV more often for shoppable and conversion-linked campaigns.
Why does measurement remain a challenge for connected TV advertising?
Buyers still face inconsistent reporting and attribution across large streaming platforms, which slows budget shifts from traditional television into connected TV despite growing audience reach.
Page last updated on:





