
Commercial Aircraft In-Seat Power System Market Size and Share
Market Overview
| Study Period | 2019 - 2031 |
|---|---|
| Market Size (2026) | USD 172.73 Million |
| Market Size (2031) | USD 219.40 Million |
| Growth Rate (2026 - 2031) | 4.90 % |
| Fastest Growing Market | Asia Pacific |
| Largest Market | North America |
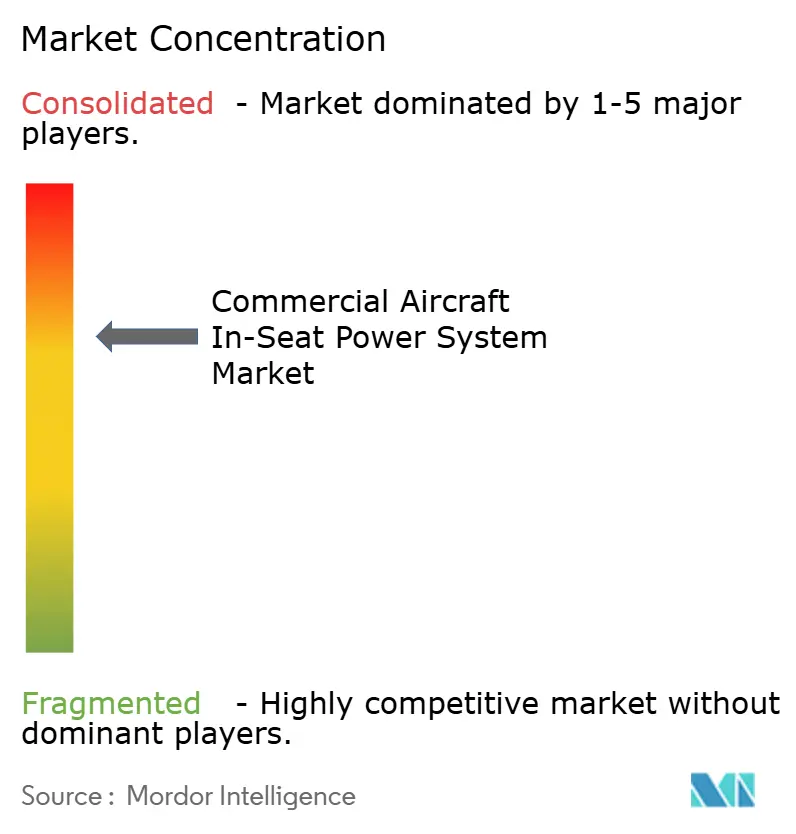
| Market Concentration | Medium |
Major Players *Disclaimer: Major Players sorted in no particular order Image © Mordor Intelligence. Reuse requires attribution under CC BY 4.0. | |
Commercial Aircraft In-Seat Power System Market Analysis by Mordor Intelligence
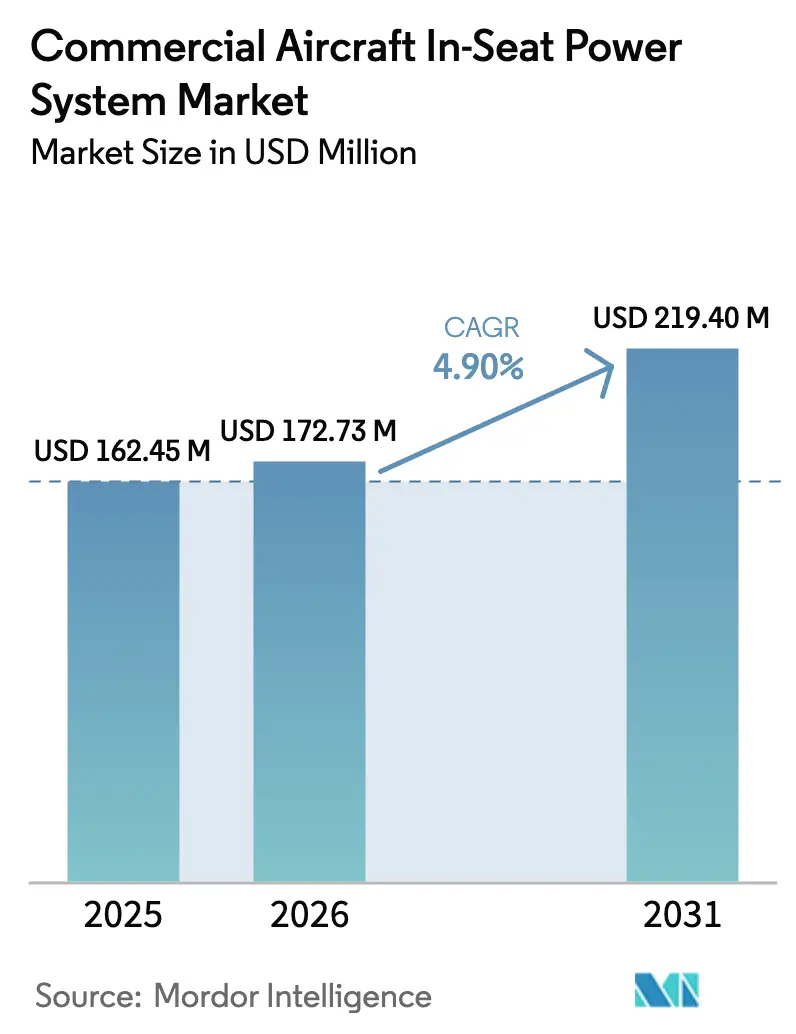
The commercial aircraft in-seat power system market size is expected to grow from USD 164.78 million in 2025 to USD 172.73 million in 2026 and is forecasted to reach USD 219.40 million by 2031 at a 4.90% CAGR over 2026-2031. Growth rests on three intertwined shifts: passengers now carry multiple high-draw devices that require 60-100 W USB-C delivery, airlines treat seat-level electricity as baseline infrastructure rather than a premium perk, and regulators push toward universal USB-C standards to simplify compliance. Narrowbody programs dominate deliveries, yet retrofit demand across aging widebody fleets is climbing as carriers bundle new power outlets with IFE and seat refreshes. Weight-saving power converters and single-pair Ethernet wiring temper fuel-burn penalties, while OEMs race to integrate higher-voltage architectures that support future 240 W USB-PD profiles. Competitive intensity is moderate, led by Astronics, Panasonic Avionics, Collins Aerospace, Safran, and Thales, each betting on lighter, more efficient converters and, in some cases, wireless charging.
Key Report Takeaways
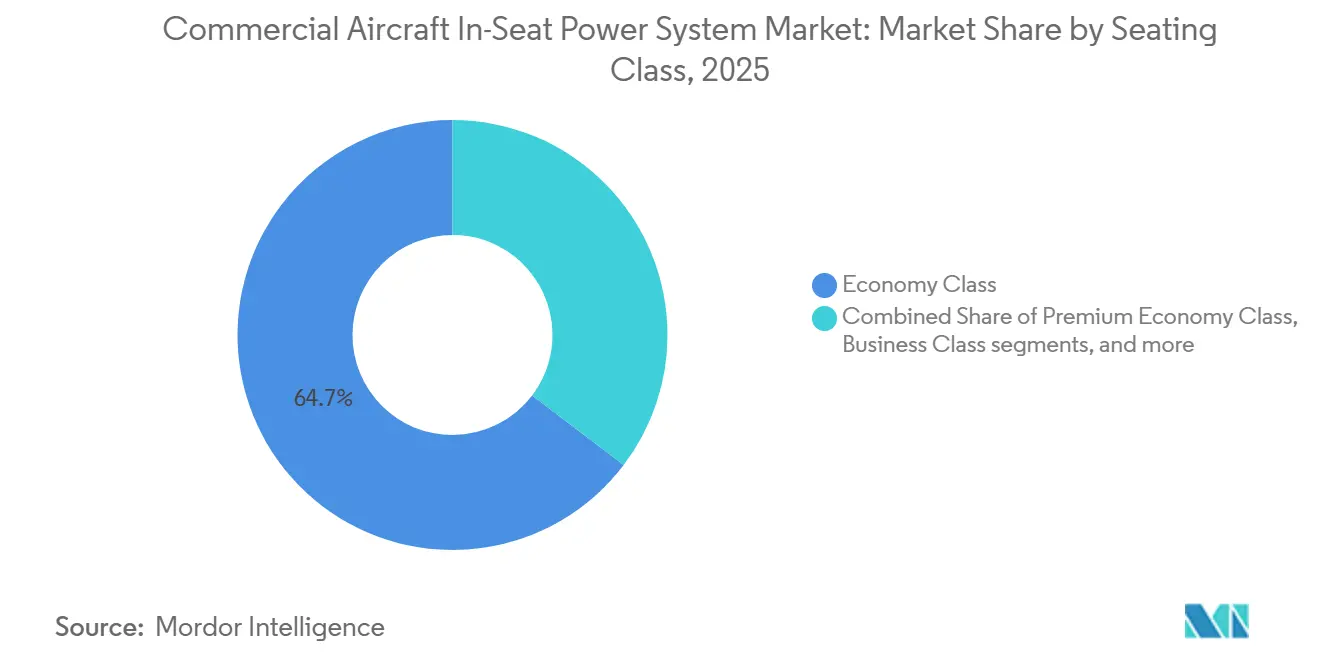
- By seating class, economy commanded 64.66% of the commercial aircraft in-seat power system market share in 2025, whereas premium economy is forecast to grow at a 5.12% CAGR through 2031.
- By aircraft type, narrowbodies held 56.45% share of the commercial aircraft in-seat power system market size in 2025, while regional jets are forecast to grow at a 5.24% CAGR through 2031.
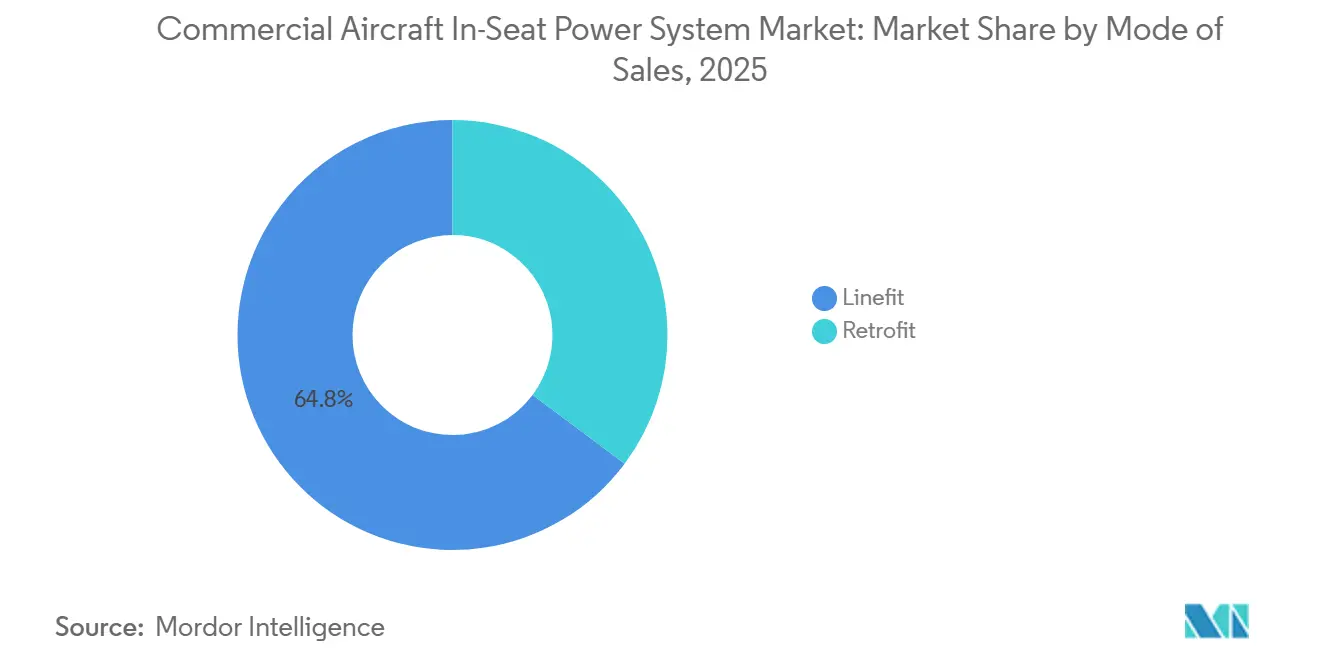
- By fit, linefit accounted for 64.78% of the commercial aircraft in-seat power system market share in 2025; the retrofit segment is projected to grow at a 5.47% CAGR through 2031.
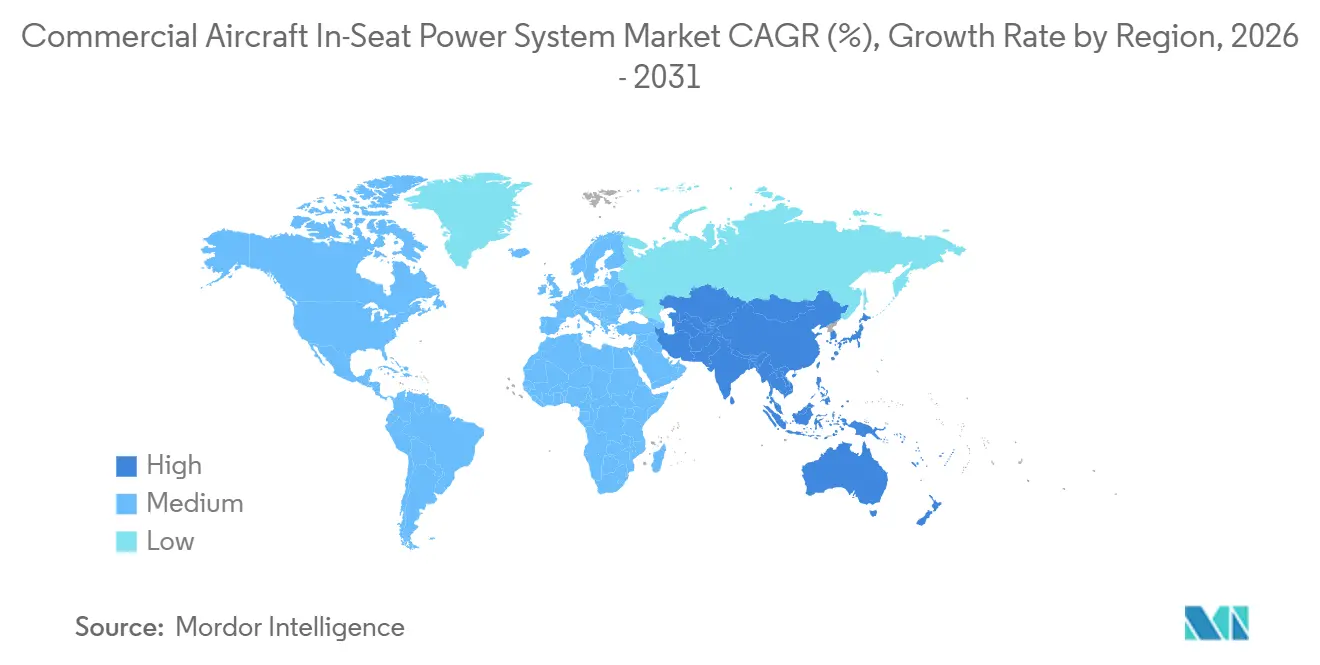
- By geography, North America led regional revenue with a 33.85% share in 2025, whereas the Asia-Pacific region is projected to grow at a 5.32% CAGR through 2031.
Note: Market size and forecast figures in this report are generated using Mordor Intelligence’s proprietary estimation framework, updated with the latest available data and insights as of January 2026.
Market Trends and Insights
Drivers Impact Analysis of Commercial Aircraft In-Seat Power System Market*
| Driver | (~) % Impact on CAGR Forecast | Geographic Relevance | Impact Timeline |
|---|---|---|---|
| Rising passenger demand for personal electronic device charging and onboard connectivity | +1.2% | Global, strongest in North America, Europe, Middle East | Short term (≤ 2 years) |
| Fleet modernization and retrofit programs are accelerating in-seat power outlet installations | +1.0% | North America, Asia-Pacific spill-over to Europe, Middle East | Medium term (2–4 years) |
| Lightweight and high-efficiency power conversion technologies are reducing system weight and heat generation | +0.8% | Global, early adoption in Europe and North America | Medium term (2–4 years) |
| Emerging FAA and EASA requirements are driving adoption of USB-C power delivery outlets | +0.7% | North America, Europe, regulatory influence on Asia-Pacific, Middle East | Short term (≤ 2 years) |
| Transition toward higher-voltage aircraft architectures is enabling higher seat-level power availability | +0.6% | Global OEM line-fit on A320neo, B737 MAX, A350, B787 | Long term (≥ 4 years) |
| Growth in long-haul operations and premium cabin density is increasing per-seat power requirements | +0.9% | Middle East, Asia-Pacific, North American long-haul hubs | Medium term (2–4 years) |
| Source: Mordor Intelligence | |||


Rising Passenger Demand for Personal Electronic Device Charging and Onboard Connectivity
Passengers board with an average of 2.3 devices, up from 1.8 in 2020, and expect fast-charging USB-C outlets that deliver at least 60 W. Emirates responded by outfitting 111 aircraft with 67 W USB-C ports in every seat, while also introducing wireless charging in Business Class.[1]Emirates, “Emirates Unveils New Premium Economy,” emirates.com Panasonic’s Astrova platform, chosen by Air Canada for 80 aircraft, supplies 100 W USB-C, underscoring how electricity has become a competitive differentiator. The EU’s Common Charger directive, mandating USB-C for laptops by 2026, accelerates airline adoption to pre-empt passenger dissatisfaction.[2]European Commission, “Common Charger Directive Q&A,” europa.eu
Fleet Modernization and Retrofit Programs Accelerating In-Seat Power Installations
Singapore Airlines’ refit of 41 A350-900s bundles outlets, IFE, and seats to amortize cabin downtime. Korean Air’s USD 216 million overhaul of 11 B777-300ERs adds 40 Premium Economy seats and 60 W USB-C per passenger. Airbus expects over 390 A350s to reach 8 years of service by 2028, creating a sustained aftermarket pipeline for power conversions. Astronics already logs a 300-aircraft backlog for EmPower retrofits, evidencing robust demand.
Lightweight and High-Efficiency Power Conversion Technologies Reducing System Weight and Heat Generation
Astronics’ EmPower UltraLite G2 cuts converter weight by up to 40% and posts 93% efficiency, while TE Connectivity’s mini-Ethernet harness trims 50 kg from a widebody and saves USD 3,185 in annual fuel burn. Thales’ 350 W Pulse dynamically balances row-level draw, trimming redundant copper wiring. Higher-voltage 270 V DC architectures on the A350 and B787 permit thinner conductors, further easing fuel penalties.
Emerging FAA and EASA Requirements Driving Adoption of USB-C Power Delivery Outlets
FAA circular 20-158A and EASA CM-ES-001 impose stringent EMI and fault-protection thresholds, effectively steering airlines toward new-generation converters that integrate USB-C. Advisory Circular 25-27 tightens wiring separation rules, prompting suppliers to deliver shielded, lighter looms that accommodate 100 W USB-PD without requiring recertification headaches. Such frameworks, coupled with the EU’s Common Charger directive, solidify USB-C as the de facto standard for cabin outlets.
Restraints Impact Analysis of Commercial Aircraft In-Seat Power System Market*
| Restraint | (~) % Impact on CAGR Forecast | Geographic Relevance | Impact Timeline |
|---|---|---|---|
| High retrofit costs and associated aircraft downtime are limiting adoption | -0.9% | Global, most acute for low-cost and regional operators | Short term (≤ 2 years) |
| Weight and space constraints are affecting fuel efficiency and cabin integration | -0.6% | Global, heightened in narrowbody and regional jet fleets | Medium term (2–4 years) |
| Stringent electromagnetic interference and safety certification requirements are extending approval timelines | -0.5% | North America, Europe influence on Asia-Pacific and Middle East | Medium term (2–4 years) |
| Rapidly evolving USB power delivery and wireless charging standards are delaying airline investment decisions | -0.4% | Global, premium-cabin concentration in North America, Europe, Middle East | Short term (≤ 2 years) |
| Source: Mordor Intelligence | |||
High Retrofit Costs and Associated Aircraft Downtime Limiting Adoption
Singapore Airlines spends USD 20 million per A350 to refresh cabins, while Korean Air’s B777 packages approach USD 19.6 million per tail, figures that discourage smaller operators from similar projects.[3]Singapore Airlines, “S$1.1 Billion Cabin Enhancements,” singaporeair.com Each airframe can sit grounded for weeks, eroding revenue. Despite projected growth in MRO spending, cabin enhancements are often deprioritized during economic downturns due to their discretionary nature.[4]Oliver Wyman, “Global Fleet & MRO Forecast 2024-34,” oliverwyman.com This highlights the financial and operational challenges associated with such projects in the aviation industry.
Weight and Space Constraints Affecting Fuel Efficiency and Cabin Integration
Narrowbody layouts typically feature a seat pitch of 30-32 inches, leaving little space for outlet housings and cooling ducts. Regional jets magnify this issue with 31-in pitch and tighter fuselages. Despite Astronics’ 40% lighter modules and Thales’ dynamic 350 W routing, airlines weigh every kilogram against lifetime fuel costs.
*Our forecasts treat driver/restraint impacts as directional, not additive. The impact forecasts reflect baseline growth, mix effects, and variable interactions.
Commercial Aircraft In-Seat Power System Market Segment Analysis
By Seating Class:
Premium Economy Drives Fastest GrowthPremium economy is forecasted to log a 5.12% CAGR, the fastest among cabins, as carriers monetize mid-tier passengers prepared to pay for 38-40 inches of pitch and laptop-grade power. Korean Air’s B777 retrofits feature 60 W USB-C ports in the new cabin, mirroring Cathay Pacific’s plan to rejuvenate its B777-300ERs. The economy segment retains a 64.66% commercial aircraft in-seat power system market share because it dominates the seat count; yet, even Emirates now installs 67 W USB-C at every economy seat. Business and first class remain power-hungry, often stipulating 100 W per passenger plus amenity lighting, evidenced by Singapore Airlines’ forthcoming A350 First suites.
Airlines view premium economy as a margin lever that justifies a power spec closer to business class. Panasonic’s Astrova helps Air Canada provide 100 W to Premium customers, supporting large-screen productivity on trans-Atlantic flights. Astronics’ Qi-certified wireless pad, meanwhile, offers a cable-free perk that airlines selectively roll into premium rows.


By Aircraft Type:
Regional Jets Post Strongest CAGRRegional jets are set for a 5.24% CAGR as operators retrofit Embraer E-Jets and CRJ families. Air Canada’s inclusion of A220-300s in its 80-aircraft order for Astrova shows that power is no longer a long-haul luxury. Delta has already equipped its A220 fleet with dual AC and USB outlets. Narrowbodies account for 56.45% of the commercial aircraft in-seat power system market size, primarily due to the prolific A320neo and B737 MAX lines, both of which are now delivered with linefit USB-C options.
Widebodies demand the highest watts per seat for 10-hour sectors. Emirates’ 111-aircraft program exemplifies 67 W USB-C across A380 and B777 cabins. Airbus forecasts that more than 390 A350s will reach the 8-year mark by 2028, unlocking widebody retrofits that incorporate IFE and power outlet upgrades.
By Fit:
Retrofit Gains on Aging FleetsRetrofit conversions are on track for a 5.47% CAGR, outpacing OEM linefit growth as airlines extend fleet lives amid new build delivery bottlenecks. Singapore Airlines’ USD 815 million, 41-aircraft program and Qantas’ A330 refits typify carriers bundling power work with seat overhauls during heavy checks. Astronics’ 300-aircraft backlog underscores this pivot, and Oliver Wyman sees cabin mods claiming a larger slice of the MRO pool by 2034.
Linefit still owns 64.78% of 2025 revenue, powered by steady A320neo, B737 MAX, and A350 handovers. Panasonic’s Riyadh Air launch deal locks Modular Interactive into the carrier’s first deliveries, while Astronics’ Qi unit sits on Airbus and Boeing option catalogs. Yet linefits’ share is slowly eroding as carriers refurbish rather than replace airframes constrained by supply chain delays.
Geography Analysis
North America Commercial Aircraft In-Seat Power System Market
North America accounted for 33.85% of the commercial aircraft in-seat power system market in 2025, as FAA directives and high disposable income among travelers have made power a baseline amenity. Delta’s FlytEDGE deployment, paired with dual-outlet A220 cabins, sets a regional standard, and Astronics’ New York base positions it to supply retrofit programs quickly. FAA circular 20-158A has also become the global reference document, fostering domestic certification momentum that translates into rapid market uptake.
APAC Commercial Aircraft In-Seat Power System Market
Asia-Pacific posts the fastest 5.32% CAGR as Emirates, Singapore Airlines, Korean Air, Cathay Pacific, Qantas, and Air India line up retrofit and OEM programs. Emirates alone will overhaul 111 widebodies, while Singapore Airlines spends USD 815 million to future-proof its A350 fleet. Regulatory nudges stem from China’s CAAC guidelines on device charging and Hong Kong’s power-bank ban, both of which encourage airlines to offer certified in-seat outlets.
Europe, Middle East and South America Commercial Aircraft In-Seat Power System Market
Europe remains pivotal as EASA harmonizes with FAA wiring and EMI rules, and the Common Charger directive de facto forces USB-C adoption. British Airways has already fitted A320neos with dual-standard outlets, and Lufthansa is exploring 100 W USB-C for its A350 cabins. Middle East carriers feature prominently through Emirates’ benchmark program, while South America lags due to economic headwinds but shows signs of improvement as LATAM evaluates Power-C retrofits for its B767-300ERs.

Regulatory Landscape
Commercial aircraft in-seat power supply systems are governed by type certification and installation rules that focus on electrical safety, EMI control, and wiring integrity. In the United States, FAA policy and guidance for in-seat power supply systems (including the long-standing Federal Register policy statement on certification of in-seat power supply systems and FAA processes for Technical Standard Order (TSO) articles, supported by FAA Order 8100.18) frame the approval pathways, while installation and safety assessment expectations track aircraft-level airworthiness practices for electrical systems and EWIS.
Globally, suppliers typically qualify equipment to RTCA/DO-160 environmental and EMI test procedures and demonstrate compliance to large-aircraft electrical and EWIS requirements under EASA CS-25 (including safety assessment provisions such as CS-25.1309 and EWIS-focused requirements). This compliance stack shows up in design choices such as integrated fault protection, robust disconnection and circuit protection schemes, and shielded wiring approaches that can reduce recertification friction when airlines upgrade from legacy USB-A and lower-power outlets to USB-C power delivery architectures.
Value Chain Analysis
The value chain begins with standards and certification inputs (RTCA/DO-160 qualification and FAA/EASA airworthiness compliance), then moves into component suppliers such as connectors, harnessing, power conversion electronics, and thermal materials. Tier suppliers use these inputs to engineer certified in-seat power outlets, converters, and load management modules.
Integration happens either as linefit content through aircraft OEM and cabin catalog pathways or as retrofit kits via seat manufacturers, IFE integrators, and airline/MRO heavy-check events that bundle seats, IFE, and power to limit downtime. Downstream, airlines and lessors shape specifications around USB-C wattage, weight, and maintainability, while cabin integrators handle certification paperwork, installation instructions, and spares support. Competitive differentiation increasingly hinges on lighter wiring looms and higher-efficiency converters to mitigate fuel-burn penalties, alongside integrated power management that can allocate available electrical capacity across rows and cabin zones rather than relying on isolated per-seat hardware.
Competitive Landscape
Astronics Corporation, Panasonic Avionics Corporation, KID-Systeme GmbH, Mid-Continent Instrument Co., Inc., and Burrana Pty Ltd. dominate the supply chain, capturing the majority of large OEM and retrofit contracts. Astronics has shipped 650 EmPower kits, touting 40% lighter G2 converters and 93% efficiency. Panasonic’s Astrova secured Air Canada’s 80-aircraft deal, integrating 100 W USB-C and 4K OLED IFE. Thales’ Pulse, winner of the 2022 Crystal Cabin Award, dynamically routes 350 W across rows and underpins Delta’s FlytEDGE refresh.
Collins Aerospace’s 2024 paper on inductive seat power signals a long-term wireless bet, while Safran delivers the Business Class wireless pads in Emirates’ 111-aircraft retrofit. Smaller firms target niches: Mid-Continent Instrument offers 60 W flight-deck USB-C, and True Blue Power focuses on pilot EFB charging.
White-space opportunity clusters around regional jets and lower-budget carriers that have yet to adopt USB-C. Suppliers offering plug-and-play kits with minimal wiring intrusion are likely to benefit as Embraer and Bombardier fleets mature. Competitive pressure thus centers on lighter, higher-efficiency converters and modular wiring looms that can be easily installed during scheduled heavy checks without protracted downtime.
Commercial Aircraft In-Seat Power System Industry Leaders
Astronics Corporation
KID-Systeme GmbH
Panasonic Avionics Corporation
Mid-Continent Instrument Co., Inc.
Burrana Pty Ltd.
- *Disclaimer: Major Players sorted in no particular order
Commercial Aircraft In-Seat Power System Market Companies Covered in this Report
- Astronics Corporation
- Burrana Pty Ltd.
- KID-Systeme GmbH
- Imagik Corp.
- IFPL Group Limited
- Inflight Canada Inc.
- Mid-Continent Instrument Co., Inc.
- AstrodyneTDI (TRANSISTOR DEVICES INCORPORATED)
- Thales Group
- Panasonic Avionics Corporation (Panasonic Holdings Corporation)
- RTX Corporation
- Diehl Aviation

Market Opportunities and Future Outlook
One of the most actionable opportunity areas is the shift from fixed per-seat power ratings to cabin-wide, intelligent power management that increases usable availability without overprovisioning aircraft electrical capacity. In April 2026, IFPL Group introduced Transform (wireless in-seat power architecture with real-time load management), and Burrana announced its RISE Power platform featuring cabin-wide dynamic power management, both aimed at airline pain points tied to uneven usage and first-come, first-served constraints in legacy layouts.
A second whitespace centers on higher-power USB-C delivery integrated with seat-end electronics and standardized interfaces that can support faster linefit adoption and more repeatable retrofits. Thales unveiled FlytEDGE Aura in April 2026 with up to 120 W fast charging via dual USB-C ports, which reinforces the direction toward laptop-grade charging in more cabin zones. This aligns with ARINC 628 (seat interfaces, including updates supporting modern USB implementations) and the EU Common Charger timeline (USB-C expectations by 2026 for consumer devices), while lightweight converter and harness innovations remain central to retrofit economics where downtime and added mass are the limiting factors.
Recent Industry Developments in Commercial Aircraft In-Seat Power System Market
- April 2026: Astronics launched the EmPower 1327-27 Dual USB-Type-C in-seat power outlet, delivering up to 60 W combined power for passenger devices. The release supports airline upgrade paths from legacy USB-A and lower-power outlets while fitting common seat integration and retrofit use cases. It also intensifies competitive pressure around weight, thermal performance, and certification-ready USB-C implementations.
- April 2026: Astronics introduced an EmPower Qi2 wireless charging module designed to provide up to 25 W output for aircraft cabins. Wireless charging adds a premium-cabin differentiator and reduces reliance on cables while keeping charging integrated at the seat level. The module expands the product mix toward hybrid cabins that combine USB-C power delivery with inductive charging.
- January 2024: KID-Systeme announced that its GeniusPOWER Core was listed in the Airbus BFE Catalogue as a potential future product for A320 family aircraft, including USB-C 60 W capability. Placement in an OEM catalogue improves linefit visibility and shortens the path from evaluation to fleetwide specification. It also indicates that higher-power USB-C is being treated as standardizable cabin content on high-volume narrowbody programs.


Commercial Aircraft In-Seat Power System Market Report Scope and Research Methodology
Market Definition and Coverage
This market covers the revenue generated from in-seat power systems installed on commercial aircraft, where power is delivered at the passenger seat through outlets or ports. Value is tracked across linefit and retrofit activity.
Scope exclusions: Military aircraft installations and non-seat passenger power solutions (such as galley-only power or cockpit power equipment) are not counted in this sizing.
Segments Covered in This Report
- By Seating Class
- Economy Class
- Premium Economy Class
- Business Class
- First Class
- By Aircraft Type
- Narrowbody Aircraft
- Widebody Aircraft
- Regional Jets
- By Fit
- Linefit
- Retrofit
- By Geography
- North America
- United States
- Canada
- Mexico
- Europe
- United Kingdom
- France
- Germany
- Italy
- Spain
- Rest of Europe
- Asia-Pacific
- China
- India
- Japan
- South Korea
- Australia
- Rest of Asia-Pacific
- South America
- Brazil
- Rest of South America
- Middle East and Africa
- Middle East
- United Arab Emirates
- Saudi Arabia
- Rest of Middle East
- Africa
- South Africa
- Rest of Africa
- Middle East
- North America
Data Sources, Market Sizing, and Validation
Desk Research
Desk work starts with building the demand context and the aircraft delivery base that drives new installations. We use public aviation datasets and policy references such as ICAO traffic statistics, FAA publications, EASA guidance, and IATA market and operational summaries to understand fleet growth, utilization, and cabin upgrade cycles.
To convert that context into usable model inputs, we also review OEM and airline annual reports, investor decks, and reputable aerospace press for signals on retrofit programs and cabin refresh timing. Patent databases are used to track direction of charging formats and safety features, and an import-export shipment-level database is referenced selectively to sanity-check component flow patterns where labeling is clear. These desk sources are illustrative rather than exhaustive, and many other public references were used during data collection, cross-checks, and clarification.
Primary Interviews and Surveys
Primary conversations are used to confirm what share of delivered aircraft typically ships with seat power as standard, and how often older aircraft are upgraded during cabin retrofits. Interview input also clarifies pricing movement, typical shipset content, and regional differences, based on discussions with airline and MRO stakeholders, cabin integration specialists, and supply-side subject matter experts across APAC, EMEA, and the Americas.
Distribution of primary research fieldwork respondents
| Company type | Respondent position | Region |
|---|---|---|
| Top tier: 35% | CXOs: 15% | APAC: 46% |
| Mid tier: 46% | Functional/Unit leaders: 27% | EMEA: 31% |
| Smaller Players: 19% | Managers: 58% | Americas: 23% |
Market-Sizing & Forecasting
Sizing is built using a top-down approach where aircraft deliveries, active fleet size, and cabin modification cycles are converted into a realistic installation pool by region and aircraft category. That pool is then translated into value using observed price bands. Results are corroborated with selective bottom-up approximations, including sampled shipset value checks and channel feedback on typical outlet mix, which helps adjust totals when the first pass looks too optimistic.
Key inputs used in the model include commercial aircraft deliveries and order backlog direction, retrofit penetration by aircraft age and cabin refresh frequency, average seats per aircraft by category, the share of seats provisioned with USB versus AC outlets, and typical system ASP movement by charging type and certification needs. Where a bottom-up check is missing for a smaller region or aircraft class, the gap is handled by applying validated penetration and price assumptions from the closest comparable fleet profile, followed by a second review.
For the forecast, scenario analysis is used so the model can reflect different airline spending cycles. Assumptions are anchored through interview consensus on fleet utilization, supply constraints, and retrofit timing. The forecast is kept traceable, so each year can be explained through changes in deliveries, retrofit counts, seat loads, and pricing rather than a single growth rate.
Data Validation & Update Cycle
Validation is done by comparing outputs against independent aviation signals such as delivery trends, fleet utilization direction, and airline cabin investment commentary, which helps catch results that move out of line with real-world activity. When a region shows a sharp swing, the drivers are re-checked, and follow-up calls are triggered to confirm whether penetration, pricing, or retrofit timing caused the shift.
Before sign-off, the model goes through multi-step analyst reviews, where assumptions are challenged and recalculated with alternative inputs to test stability. The report is refreshed annually, and interim updates are completed when material events occur. A final fresh pass is performed right before delivery so clients receive the latest updated view.
Mordor Intelligence's Seat Power System Commercial Aircraft Market Size Compared Against Other Published Estimates
Published market values for in-seat power systems often differ because each publisher counts the demand pool in its own way, and then applies different pricing logic and upgrade timing. The spread usually comes from what is counted as an in-scope shipset, how retrofit activity is treated, and which year is used as the anchor when currency and inflation are moving.
The main gap comes from whether estimates fold in adjacent cabin electrical content beyond the seat-level power unit, and how aggressively retrofit penetration is assumed in older fleets, especially in narrowbody cabins. By separating linefit and retrofit volumes and then validating seat provisioning rates against airline cabin programs, Mordor Intelligence treats the market as seat power shipsets tied to real install events, rather than a broader cabin electrics proxy.
Benchmark comparison
| Source | Market Size | Gaps in Research Methodology |
|---|---|---|
| Mordor Intelligence | USD 164.78 M (2025) | |
| Global Listing Publisher A | USD 152.55 M (2025) | Uses a narrower product framing focused on USB and AC ports, and applies a more conservative retrofit uptake over the period, which compresses the 2025 value. |
| Industry Publisher B | USD 192.10 M (2024) | Starts from a larger 2024 anchor and appears to include a wider technology set (including wireless charging) with broader cabin upgrade assumptions, which lifts the current-year figure. |
Across the three figures, the difference is mainly explained by what is counted inside the shipset, how retrofit timing is modeled, and which base year anchors the price level. Our approach stays balanced by tying demand to aircraft deliveries and verified retrofit events, then applying transparent seat-load and pricing assumptions that can be rechecked year to year.


Key Questions Answered in the Report
What is the projected value of the commercial aircraft in-seat power system market in 2031?
The commercial aircraft in-seat power system market size is forecasted to reach USD 219.40 million by 2031.
Which cabin class is expected to grow the fastest in power-outlet installations?
Premium economy is poised for the quickest expansion with a 5.12% CAGR through 2031.
Why are airlines favoring USB-C over legacy USB-A outlets?
USB-C supports higher power delivery up to 100 W and complies with emerging FAA, EASA, and EU mandates.
Which region will see the highest growth rate for seat-level power systems?
Asia-Pacific will lead with a projected 5.32% CAGR between 2026 and 2031.
How are retrofit costs impacting adoption among smaller carriers?
Widebody cabin upgrades can top USD 20 million per aircraft, prompting budget-constrained airlines to defer or limit installations.
What technological advance could disrupt wired seat power in the future?
Wireless inductive charging, undergoing R&D at Collins Aerospace, may eventually remove the need for seat wiring.
Page last updated on:


 Your data is secure and never sold or shared.


