Market Overview
| Study Period | 2019 - 2030 |
|---|---|
| Forecast Data Period | 2025 - 2030 |
| Historical Data Period | 2019 - 2023 |
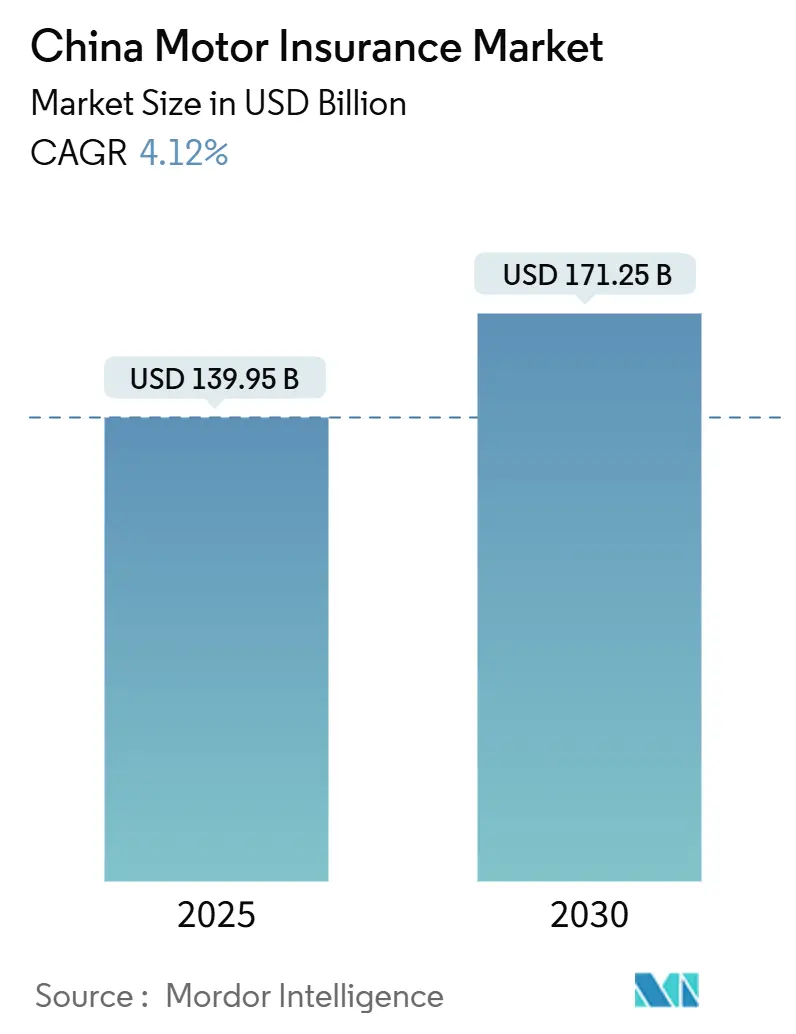
| Market Size (2025) | USD 139.95 Billion |
| Market Size (2030) | USD 171.25 Billion |
| Growth Rate (2025 - 2030) | 4.12% CAGR |
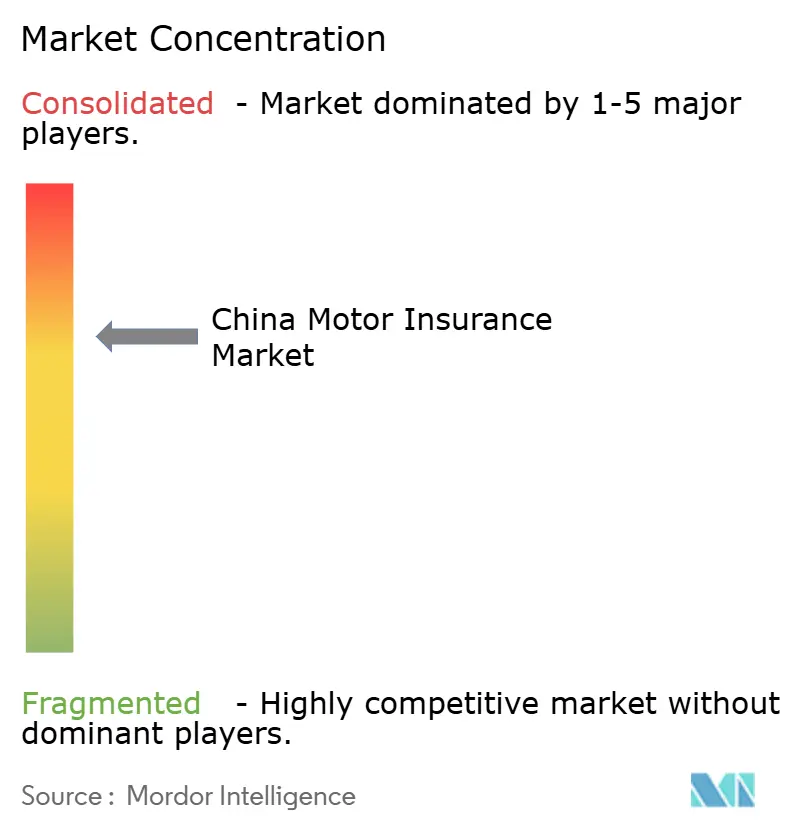
| Market Concentration | Medium |
Major Players *Disclaimer: Major Players sorted in no particular order Image © Mordor Intelligence. Reuse requires attribution under CC BY 4.0. | |
China Motor Insurance Market Analysis by Mordor Intelligence
The China motor insurance market size was USD 139.95 billion in 2025 and is projected to reach USD 171.25 billion by 2030, representing a steady 4.12% CAGR. China's motor insurance market is witnessing modest topline growth, yet its internal dynamics are rapidly evolving. Premiums are expanding, driven by the surge in new energy vehicles, a segment growing at an impressive annual rate of 12.5%. This growth rate significantly outpaces the overall market, with new energy vehicles now representing 11.5% of total premiums. The rise of digital distribution is reshaping the cost structure. Platforms that sell directly to consumers, online aggregators, and embedded sales channels are gaining traction, diminishing the traditional cost edge once enjoyed by agents. Regional trends are diverging, while East China continues to lead in premium volume, it's showing signs of saturation. In contrast, Northwest China is emerging as a robust growth area, boasting a 10.1% annual growth rate, bolstered by infrastructure projects and rural subsidies. After the pricing reforms in 2020, competition has intensified. By 2024, the top three insurers, PICC, Ping An, and China Pacific, secured a dominant share of underwriting profits, highlighting widening performance gaps.
Key Report Takeaways
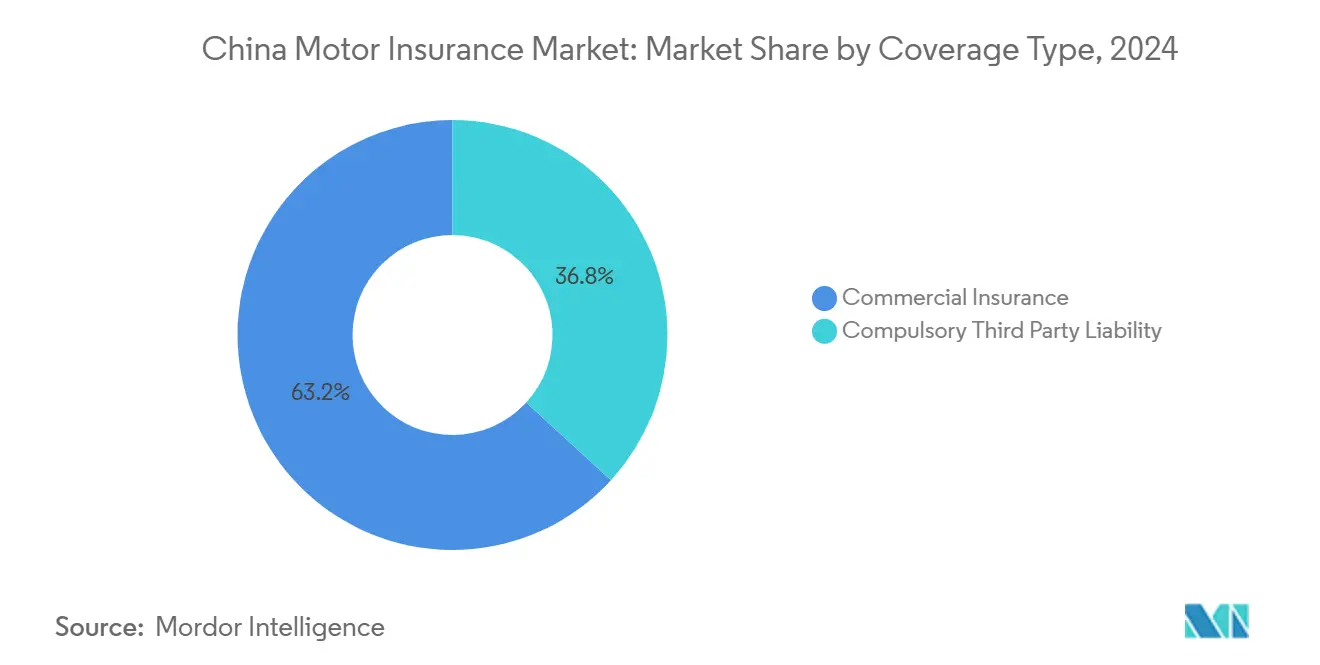
- By Coverage type, commercial motor insurance led with 63.2% of the China motor insurance market share in 2024, while CTPL is projected to expand at an 11.82% CAGR through 2030.
- By Vehicle type, NEVs commanded an 11.5% share of the China motor insurance market size in 2025 and are advancing at a 12.51% CAGR during 2025-2030.
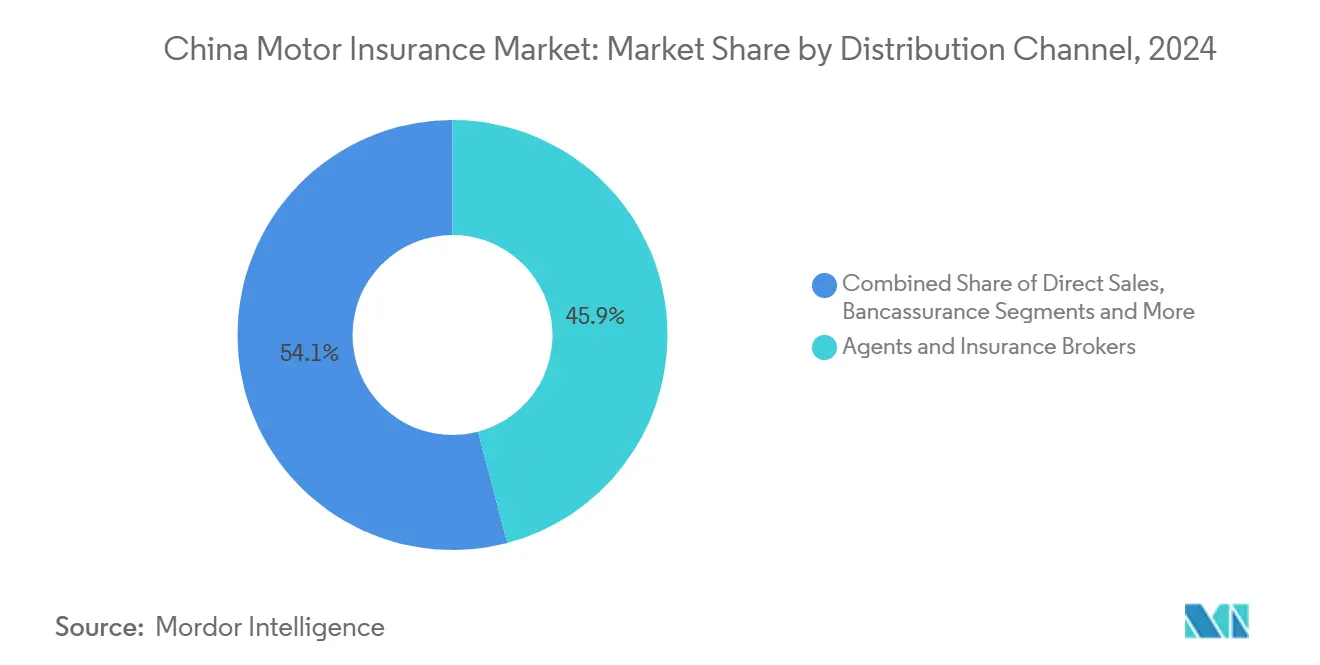
- By Distribution channel, agents and brokers held 45.9% of written premiums in 2024, whereas online aggregators and embedded models recorded the fastest growth at 14.22% CAGR.
- By Geography, East China contributed 28.2% revenue in 2024; Northwest China is set to grow the fastest at 10.11% CAGR through 2030.
China Motor Insurance Market Trends and Insights
Drivers Impact Analysis*
| Driver | (~)% Impact on CAGR Forecast | Geographic Relevance | Impact Timeline |
|---|---|---|---|
| Explosive growth of NEVs raising high-value premium pool | +1.8% | National; concentrated in East and South-Central China | Medium term (2–4 years) |
| Deregulation of online motor policies boosting D2C adoption | +0.9% | National; early adoption in East China | Short term (≤ 2 years) |
| Telematics-based UBI programs catalyzed by connected-vehicle guidelines | +0.7% | East, South-Central, and North China | Medium term (2–4 years) |
| Tier-3 & 4 city car-parc expansion via rural subsidy program | +1.2% | Northwest, Southwest, and Northeast China | Medium term (2–4 years) |
| Commercial fleet digitalization from e-commerce logistics demand | +0.6% | National; focused on logistics hubs | Short term (≤ 2 years) |
| Source: Mordor Intelligence | |||
Explosive Growth of New-Energy Vehicles (NEVs) Raising High-Value Premium Pool
China's motor insurance landscape is transforming, driven by the rapid adoption of new-energy vehicles (NEVs). In 2023, 8.1 million NEVs were sold, representing nearly 60% of global EV registrations[1]AM Best, “China's New Energy Vehicle Growth Transforms the Country's Motor Insurance Market,” news.ambest.com. By 2024, NEVs constituted over half of all new-car registrations in China. Due to expensive battery repairs and specialized components, NEVs attract premiums of CNY 4,003, significantly outpacing the CNY 2,209 for traditional cars. This trend is inflating the insured risk pool's overall value, leading to heightened average claims. Insurers, facing pressure to revamp pricing models with scant historical loss data, note that NEV-related policies have loss ratios of 10–20% points above those of conventional vehicles[2]International Energy Agency, “Trends in Electric Cars – Global EV Outlook 2024,” iea.org. Insurers that harness advanced, data-driven underwriting capabilities stand to capitalize on this structural shift, reaping sustained premium growth
Deregulation of Online Motor Policies Boosting Direct-to-Consumer Adoption
In 2020, China reformed its regulations, lifting mandatory tariff constraints. This change empowered insurers to adopt flexible pricing and directly market policies via digital platforms[3]Swiss Re, “China's motor insurance reforms: a global view,” swissre.com. As a result, digital-native players such as ZhongAn have emerged, crafting tailored micro-policies for niche customer segments. They've also managed to reduce distribution expense ratios from approximately 25% to nearly 10%. These cost savings enable more competitive pricing, driving faster consumer acceptance of direct-to-consumer (D2C) platforms. Yet, as price competition intensifies, margins are being squeezed, leading to consolidation among smaller, less efficient players.
Telematics-Based UBI Programs Catalyzed by Connected-Vehicle Guidelines
In China, telematics-driven usage-based insurance (UBI) is on the rise, buoyed by new connected-vehicle regulations that clarify data ownership and user consent. As a dominant player in the region, China is poised to play a pivotal role in the Asia-Pacific UBI market, projected to expand at a robust 24% CAGR through 2032. Major insurers, including PICC, are at the forefront, launching initiatives like "Lubao" in collaboration with Tencent. These programs leverage aftermarket devices to monitor driving habits, offering discounts of up to 30% to safe drivers. Despite the promise of tailored pricing and enhanced risk management, hurdles like data standardization and regulatory adherence are slowing the momentum of widespread adoption.
Tier-3 & 4 City Car-Parc Expansion via Rural Vehicle Subsidy Program
In Tier-3 and Tier-4 cities, vehicle ownership is witnessing a rapid surge, boasting annual growth rates of 15–20%. This growth significantly outpaces the 3–5% increase observed in Tier-1 markets. Driving this momentum are government subsidies, offering up to CNY 10,000 off new vehicle purchases. These incentives are bolstering the insured car parc in areas that were previously underpenetrated. As vehicle ownership in these regions nears that of urban centers, insurers find themselves tapping into previously unexplored premium pools, facing minimal competition from established players. Yet, challenges loom; average premiums are smaller, the repair infrastructure remains underdeveloped, and fraud risks are heightened. To navigate these hurdles and ensure profitability, insurers must pivot, crafting cost-efficient products and embracing digital-first claims solutions.
Restraints Impact Analysis*
| Restraints | (~)% Impact on CAGR Forecast | Geographic Relevance | Impact Timeline |
|---|---|---|---|
| Underwriting losses on EV portfolios due to battery repair costs | −0.8% | National; highest in East China | Short term (≤ 2 years) |
| Intensifying price competition post de-tariffication | −1.1% | National | Medium term (2–4 years) |
| Modal shift to public transit in mega-cities shrinking private pool | −0.5% | Beijing, Shanghai, other megacities | Long term (≥ 4 years) |
| Surge in fraudulent claims rings exploiting digital channels | −0.7% | National | Short term (≤ 2 years) |
| Source: Mordor Intelligence | |||
Underwriting Losses on EV Portfolios Due to Battery Repair Costs
The high cost of battery replacement, often exceeding CNY 100,000, drives average claim severities for NEVs 30-40% higher than those for gasoline vehicles, resulting in structurally elevated loss ratios in the near term. This profitability pressure is particularly challenging for smaller insurers, many of whom respond by adding NEV surcharges or excluding certain coverages altogether. In contrast, larger insurers attempt to offset these risks by negotiating repair discounts with automakers and investing in specialized claims adjuster training. Nonetheless, the overall strain on underwriting margins is limiting the pace of profitable NEV policy expansion.
Intensifying Price Competition Post De-tariffication
In 2024, after tariff controls were lifted, average motor insurance premiums saw a decline of 15-20%, with certain policies now available for under CNY 2,000. During renewal periods, heightened competitive pressures lead to widespread discounting, which in turn significantly narrows underwriting margins. This aggressive pricing strategy has caught the attention of regulators, who are monitoring solvency indicators. Authorities have hinted at possible interventions, such as imposing capital requirements or pricing guidelines, should these unsustainable pricing tactics persist.
*Our forecasts treat driver/restraint impacts as directional, not additive. The impact forecasts reflect baseline growth, mix effects, and variable interactions.
Segment Analysis
By Coverage Type: CTPL Gains Momentum Despite Commercial Dominance
Commercial motor insurance generated 63.2% of gross written premiums in 2024, yet compulsory third-party liability is on course to grow faster at 11.82% CAGR through 2030. The China motor insurance market size for CTPL alone is projected to rise alongside stricter enforcement in lower-tier jurisdictions and higher bodily-injury limits. In parallel, product innovation blends CTPL with modular commercial add-ons, giving cost-sensitive motorists flexibility without sacrificing essential protection.
Price liberalization widens the spread between players’ CTPL loss ratios, incentivizing data-savvy firms to refine risk segmentation. Digital platforms excel at cross-selling commercial endorsements to CTPL buyers by using behavioral analytics that suggest accident-forgiveness or roadside-assistance riders at checkout. Over time, a higher share of policies is likely to move into mid-priced hybrid bundles, cementing CTPL’s role as a gateway product within the broader China motor insurance market.


By Vehicle Type: NEVs Redefine Risk Profiles and Premiums
Passenger cars retained 68% of premiums in 2024, yet NEV penetration is the transformational theme. NEV premiums rose sixfold in five years, lifting their slice of the China motor insurance market size to 11.5% in 2025. Subsidies, tax relief, and expanding charging grids propel the segment. Players craft battery-specific depreciation schedules and offer replacement-vehicle allowances to reflect longer repair cycles.
Commercial trucks and buses contribute a smaller share but exhibit volatile claims severity due to long mileage exposure. Electrified buses made up nearly 70% of global sales in 2024, forcing underwriters to reassess aggregate catastrophe risks such as depot fires. Two-wheeler and micro-mobility covers, often arranged through super-apps, appeal to gig-economy couriers seeking on-demand protection and are expected to post double-digit growth as urban congestion policies tighten.
By Distribution Channel: Digital Platforms Challenge Traditional Dominance
Agents and brokers still originated 46% of premiums in 2024, leveraging personal networks for renewal retention. Yet online aggregators and embedded channels expand at 14.2% CAGR, steadily capturing share in the China motor insurance market. NEV makers such as NIO and BYD embed insurance at the point of sale, exploiting proprietary telematics data that improves risk selection.
Direct writer portals and bancassurance arms also scale, aided by unified data lakes that reduce acquisition costs and enable instant pricing. By 2030, embedded products alone could distribute USD 237.0 billion in premiums, significantly re-balancing channel economics. Traditional intermediaries respond by bundling value-added post-accident services and partnering with digital marketplaces to retain relevance within the evolving China motor insurance market.
Geography Analysis
East China contributed 28% of premiums in 2024, reflecting dense vehicle ownership, high disposable income, and advanced repair ecosystems. NEVs form more than 40% of new registrations in Shanghai, sharpening the need for specialized products and claims expertise. Competitive intensity is highest here, and most pilot deployments of AI-based claims triage occur in this region before nationwide roll-outs.
Northwest China, starting from a lower base, registers a 10.1% CAGR through 2030 as the rural subsidy initiative boosts first-time vehicle ownership. Expanding road networks and cross-border e-commerce corridors drive commercial-fleet uptake. However, lower average premiums per policy and sparse repair facilities inflate operating costs, prompting insurers to rely on mobile loss-adjuster units and cloud-based inspection apps.
South-Central China balances mature metros such as Guangzhou with growth corridors in nearby prefectures. Manufacturing clusters generate demand for cargo and fleet coverage, while the consumer market mirrors national averages in penetration. Northeast industrial zones rely on heavy-duty truck covers connected to the coal and steel supply chain, whereas Southwest tourism economies see rising demand for short-term rental and micro-mobility insurance products. North China megacities pursue congestion curbs, nudging insurers toward public-transport liability, ride-hailing, and shared-mobility segments to compensate for contracting private-car pools. These divergent patterns underline the necessity of region-specific underwriting and distribution tactics across the China motor insurance market.
Competitive Landscape
The top three players PICC Property & Casualty Co., Ltd, Ping An Property & Casualty Insurance Co, and China Pacific Property Insurance Co. (CPIC P/C) hold the majority of written premiums, translating into pronounced scale advantages and enabling them to capture significant share of the sector underwriting profit in 2024. They deploy proprietary AI engines for quote scoring, fraud flagging, and automated damage assessment; Ping An’s image-based tool shortens claims resolution from hours to minutes. Mid-tier players pursue defensive alliances, jointly funding data exchanges that enrich actuarial models while sharing infrastructure costs. The Market is concentrated in a competitively dynamic environment.
Disruption now emerges from outside traditional insurance circles. NEV manufacturers launch captive underwriters that bundle financing, after-sales service, and coverage. NIO’s brokerage arm illustrates the model, wielding granular telematics to segment risk and price competitively. Technology conglomerates such as Xiaomi enter the field with app-native offers that integrate driving-behavior analytics throughout their device ecosystem, further pressuring incumbents on customer experience.
Strategic differentiation increasingly hinges on data. Players able to ingest OEM telematics, mobile usage traces, and repair-shop sensor feeds can calibrate premiums with higher precision, unlocking profit in a low-rate environment. White-space niches lie in micro-mobility, cross-border motor cover, and embedded fleet risk services, each currently underserved relative to growth potential. Over the forecast horizon, regulatory openness to new capital and ongoing reforms around solvency may facilitate selective challenger breakthroughs, though entrenched leaders remain advantaged by operating scale, brand trust, and captive customer bases in the China motor insurance market.
China Motor Insurance Industry Leaders
PICC Property & Casualty Co., Ltd.
Ping An Property & Casualty Insurance Co.
China Pacific Property Insurance Co.
China United Property Insurance Co.
AXA Tianping Property & Casualty
- *Disclaimer: Major Players sorted in no particular order

Recent Industry Developments
- May 2025: Xiaomi introduced “Smart Driving Insurance,” leveraging its connected-device ecosystem and AI engines to tailor prices to individual driving patterns.
- March 2025: China Taiping Insurance Holdings posted a 2.8% motor-line revenue rise for 2024 and highlighted leadership in cross-border vehicle cover within the Greater Bay Area.
- January 2025: AM Best reported NEV premiums have risen sixfold in five years, flagging profit headwinds tied to elevated loss ratios.
- June 2024: Cheche Group partnered with NIO Insurance Broker to streamline digital insurance delivery for NEV buyers.


China Motor Insurance Market Report Scope
By Coverage Type
| Compulsory Third-party Liability (CTPL) |
| Commercial Motor Insurance |
By Vehicle Type
| Passenger Vehicles |
| Commercial Vehicles |
| Electric and Hybrid Vehicles (NEVs) |
| Heavy Trucks & Buses |
| Two-Wheelers & Micro-Mobility |
By Distribution Channel
| Direct Sales (Captive & Digital) |
| Agents and Insurance Brokers |
| Bancassurance / Auto-Finance Captives |
| Online Aggregators & Embedded Platforms |
| Others |
By Region
| East China (Shanghai, Jiangsu, Zhejiang, Anhui) |
| South-Central China (Guangdong, Fujian, Hainan, Guangxi, Hunan, Hubei) |
| North China (Beijing, Tianjin, Hebei, Shanxi, Inner Mongolia) |
| Northeast China (Liaoning, Jilin, Heilongjiang) |
| Southwest China (Sichuan, Chongqing, Guizhou, Yunnan, Tibet) |
| Northwest China (Shaanxi, Gansu, Qinghai, Ningxia, Xinjiang) |
| By Coverage Type | Compulsory Third-party Liability (CTPL) |
| Commercial Motor Insurance | |
| By Vehicle Type | Passenger Vehicles |
| Commercial Vehicles | |
| Electric and Hybrid Vehicles (NEVs) | |
| Heavy Trucks & Buses | |
| Two-Wheelers & Micro-Mobility | |
| By Distribution Channel | Direct Sales (Captive & Digital) |
| Agents and Insurance Brokers | |
| Bancassurance / Auto-Finance Captives | |
| Online Aggregators & Embedded Platforms | |
| Others | |
| By Region | East China (Shanghai, Jiangsu, Zhejiang, Anhui) |
| South-Central China (Guangdong, Fujian, Hainan, Guangxi, Hunan, Hubei) | |
| North China (Beijing, Tianjin, Hebei, Shanxi, Inner Mongolia) | |
| Northeast China (Liaoning, Jilin, Heilongjiang) | |
| Southwest China (Sichuan, Chongqing, Guizhou, Yunnan, Tibet) | |
| Northwest China (Shaanxi, Gansu, Qinghai, Ningxia, Xinjiang) |


Key Questions Answered in the Report
What is the projected size of the China motor insurance market by 2030?
The market is forecast to reach USD 171.25 billion by 2030, growing at a 4.1% CAGR.
Why are NEV premiums higher than traditional vehicle premiums
NEVs carry costlier battery systems and specialised repair requirements, lifting average premiums to CNY 4,003 versus CNY 2,209 for combustion vehicles.
How has price deregulation affected competition?
Since 2020, deregulation has sparked intense pricing rivalry, pushing average premiums down 15–20% and consolidating underwriting profits among the top three carriers.
Which distribution channels are growing the fastest?
Online aggregators and embedded insurance platforms expand at 14.2% CAGR, outpacing agents and brokers.
Page last updated on:


