
Market Overview
| Study Period | 2020 - 2031 |
|---|---|
| Forecast Data Period | 2026 - 2031 |
| Base Year Market Size (2025) | USD 10.77 Billion |
| Market Size (2026) | USD 11.37 Billion |
| Market Size (2031) | USD 14.94 Billion |
| Growth Rate (2026 - 2031) | 5.61 % |
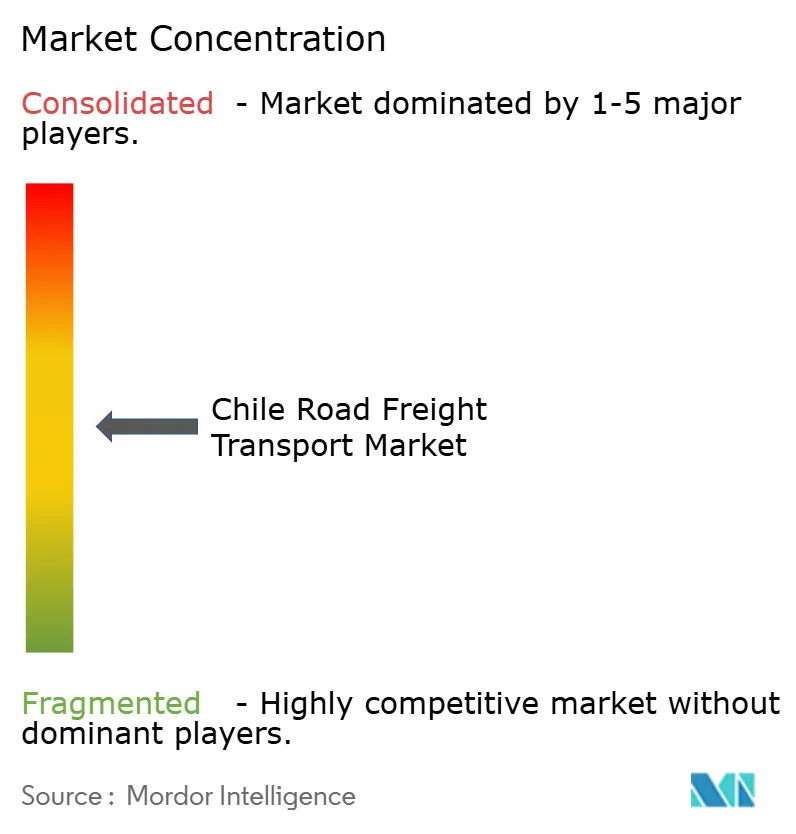
| Market Concentration | Medium |
Major Players *Disclaimer: Major Players sorted in no particular order Image © Mordor Intelligence. Reuse requires attribution under CC BY 4.0. | |
Chile Road Freight Transport Market Analysis by Mordor Intelligence
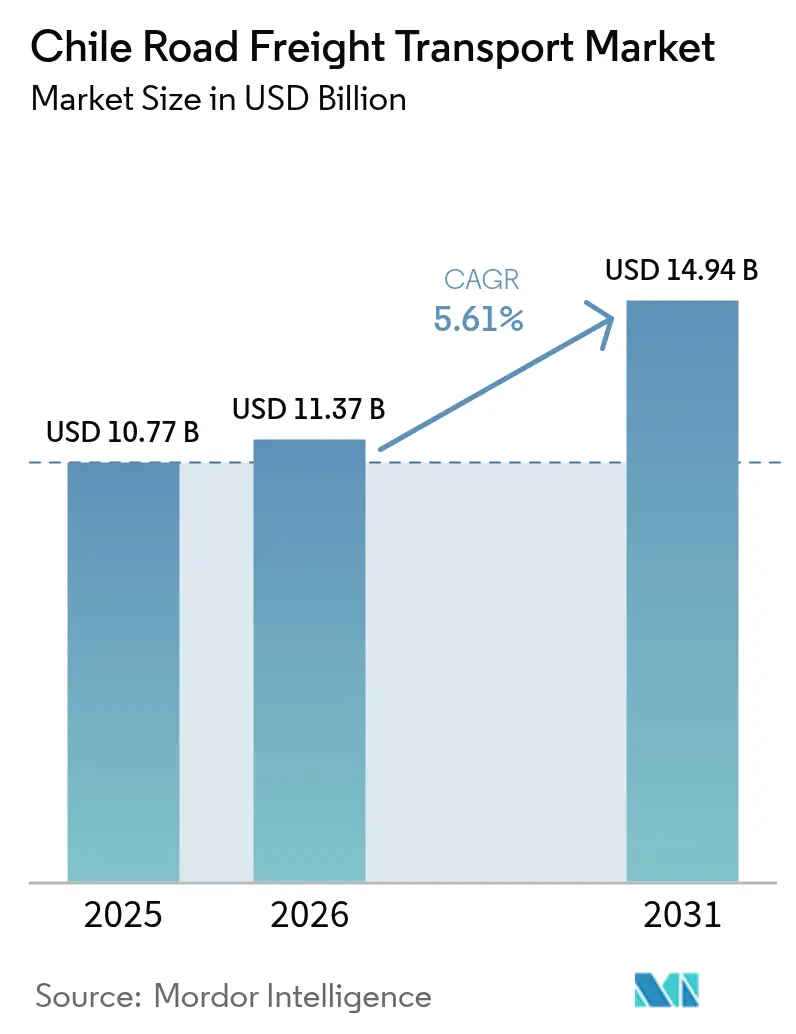
Chile Road Freight Transport Market size in 2026 is estimated at USD 11.37 billion, growing from 2025 value of USD 10.77 billion with 2031 projections showing USD 14.94 billion, growing at 5.61% CAGR over 2026-2031.
The country’s 4,300-kilometer north–south spine, favorable Pacific-facing trade orientation, and mining-led export base collectively underpin steady demand for truck services. Nearshoring of automotive parts from neighboring Argentina and Brazil, rising e-commerce penetration, and public works such as the Ruta 5 North upgrade reinforce growth prospects, while toll inflation, driver shortages, and climate-related disruptions create operating headwinds. Multimodal corridor projects that connect Chilean ports with the Atlantic side of South America promise new long-haul volumes and stronger asset utilization for carriers. Technology adoption from digital freight matching to AI-enabled route planning continues to improve load factors and lower empty-mile ratios, especially for smaller fleets that dominate the fragmented competitive landscape.
Key Report Takeaways
- By end-user industry, manufacturing led with 41.12% share of the Chile road freight transport market in 2025; wholesale and retail trade is projected to accelerate at a 5.85% CAGR through 2031.
- By destination, domestic moves accounted for 62.35% of the Chile road freight transport market size in 2025, while international freight is advancing at a 5.98% CAGR on the back of the bioceanic corridor plan.
- By truckload specification, FTL commanded 78.55% of Chile road freight transport market share in 2025, whereas LTL is the fastest-growing format at 5.74% CAGR through 2031.
- By containerization, non-containerized freight held 85.35% of Chile road freight transport market size in 2025; containerized traffic is poised for 5.27% CAGR as manufacturing and high-value perishables expand.
- By distance band, long-haul trips represented 73.25% of overall moves in 2025, with short-haul urban deliveries projected to climb 5.41% annually to 2031.
- By goods configuration, solid goods commanded 72.28% share in 2025, but fluid goods mainly chemicals used in lithium processing—are growing 5.64% each year.
- By temperature control, non-refrigerated loads dominated with 94.52% share in 2025; temperature-controlled cargo is gaining 5.70% annually as fruit exports and grocery home-delivery develop.
Note: Market size and forecast figures in this report are generated using Mordor Intelligence’s proprietary estimation framework, updated with the latest available data and insights as of 2026.
Chile Road Freight Transport Market Trends and Insights
Drivers Impact Analysis*
| Driver | (~) % Impact on CAGR Forecast | Geographic Relevance | Impact Timeline |
|---|---|---|---|
| Rapid expansion of Chilean e-commerce sector | +1.2% | National (Santiago, Valparaíso, Concepción first) | Medium term (2-4 years) |
| Growing demand from lithium-mining supply chains in the north | +0.8% | Antofagasta, Tarapacá | Long term (≥ 4 years) |
| Government highway concession upgrades (Ruta 5 & bioceanic corridor) | +1.0% | Nationwide, cross-border | Long term (≥ 4 years) |
| Nearshoring of automotive parts manufacturing | +0.7% | Central Chile & cross-border corridors | Medium term (2-4 years) |
| Digital freight-matching platforms | +0.5% | Urban logistics hubs | Short term (≤ 2 years) |
| OEM investment in Euro VI/alt-fuel fleets | +0.6% | National (early uptake in Santiago) | Medium term (2-4 years) |
| Source: Mordor Intelligence | |||
Rapid Expansion of Chilean E-commerce Sector
Online retail continues to reshape freight flows, with food-and-beverage web sales leaping 133% between 2020 and 2024 and maintaining double-digit growth into 2025. Smaller, more frequent consignments favor LTL and last-mile operators, especially in Santiago where 34% of large food outlets are located. Digital payment localization drives order conversion and boosts shipment counts as 94% of Latin American consumers demand friction-free checkout. Retailers answer with omnichannel logistics investment, creating a larger addressable base for tech-savvy carriers that can orchestrate hub-and-spoke urban deliveries over distances often surpassing 500 kilometers between major Chilean cities[1]“Presidente de la República encabezó presentación del Plan de Acción del Corredor Bioceánico Vial,” Ministerio de Obras Públicas, mop.gob.cl.
Growing Demand from Lithium-Mining Supply Chains in the North
The National Lithium Strategy seeks an additional 300,000 LCE by 2030 via public-private partnerships such as the Codelco-SQM alliance. Bulk sulfuric acid, mineral reagents, heavy machinery, and outbound lithium carbonate must travel 1,400 kilometers from the Atacama to central ports, requiring specialized ADR-compliant tankers and robust fleet maintenance regimes to withstand desert extremes. Cochilco highlights 49 mining projects worth USD 65.71 billion slated for 2023-2032, ensuring sustained freight volumes for both construction inputs and outbound concentrates[2]“Global truck driver shortage to double by 2028,” International Road Transport Union, iru.org.
Government Highway Concession Upgrades (Ruta 5 & Bioceanic Corridor)
The USD 10 billion, 2,400-kilometer bioceanic plan unveiled in April 2025 links Pacific terminals with Brazil, Argentina, and Paraguay and could trim Atlantic-Pacific transit times by 67%. Complementary investments—such as the USD 1.27 billion Route 5 North widening and Santiago-Valparaíso’s USD 3.8 billion rail concession—raise corridor capacity, standardize electronic tolling, and open intermodal options that de-bottleneck main arteries. Improved infrastructure supports just-in-time export supply chains and may catalyze emerging green-hydrogen equipment flows tied to Chile’s renewable ambitions.
Nearshoring of Automotive Parts Manufacturing from Argentina/Brazil
More suppliers reroute production to Chile’s tariff-light environment under 65 trade accords, seeking to reduce geopolitical risk and shorten lead times. The bioceanic roadway slashes Asia-bound transit for automotive components by roughly 17 days, aiding just-in-time models that depend on schedule-reliable cross-border trucking. Parts warehouses around Santiago and Los Andes increasingly contract secure, temperature-stable FTL units capable of customs-integrated tracking as value density of shipments rises[3]“Walmart will test a green-hydrogen fuel-cell truck in Chile,” IEEE Spectrum, ieee.org.
Restraints Impact Analysis*
| Restraint | (~) % Impact on CAGR Forecast | Geographic Relevance | Impact Timeline |
|---|---|---|---|
| Driver shortage and aging workforce | -0.8% | National, acute in remote north | Long term (≥ 4 years) |
| Road-toll inflation outpacing freight rates | -0.6% | Route 5 and Santiago network | Short term (≤ 2 years) |
| Cabotage restrictions on cross-border back-hauls | -0.4% | Borders with Argentina, Peru, Bolivia | Medium term (2-4 years) |
| Climate-induced landslides on mountain corridors | -0.5% | Andean passes | Long term (≥ 4 years) |
| Source: Mordor Intelligence | |||
Driver Shortage and Aging Workforce
The International Road Transport Union warns global unfilled driver posts could double by 2028, and Chile mirrors this trend with dwindling interest among younger workers and female participation still below 6%. The 2024 labor reform that cuts the workweek to 40 hours strains scheduling flexibility and raises overtime costs, especially for lithium-route carriers working multi-day cycles. Mining operators finance shared rest facilities and training programs, yet industry surveys still flag a 34,000-head talent gap.
Road-Toll Inflation Outpacing Freight Rates
Annual CPI + 3.5% indexation pushes Route 5 South tolls to CLP 3,000–3,700 for cars and roughly double for trucks, eroding margins on Santiago–Puerto Montt lanes of more than 1,400 kilometers. Mandatory TAG transponders eliminate cash flexibility, and weekend surcharges of up to 20% further raise cost volatility. Freight brokers struggle to pass increases downstream in a price-competitive environment, squeezing owner-operators who dominate 80% of the fleet.
*Our forecasts treat driver/restraint impacts as directional, not additive. The impact forecasts reflect baseline growth, mix effects, and variable interactions.
Segment Analysis
By End-User Industry: Manufacturing Anchors Diversification
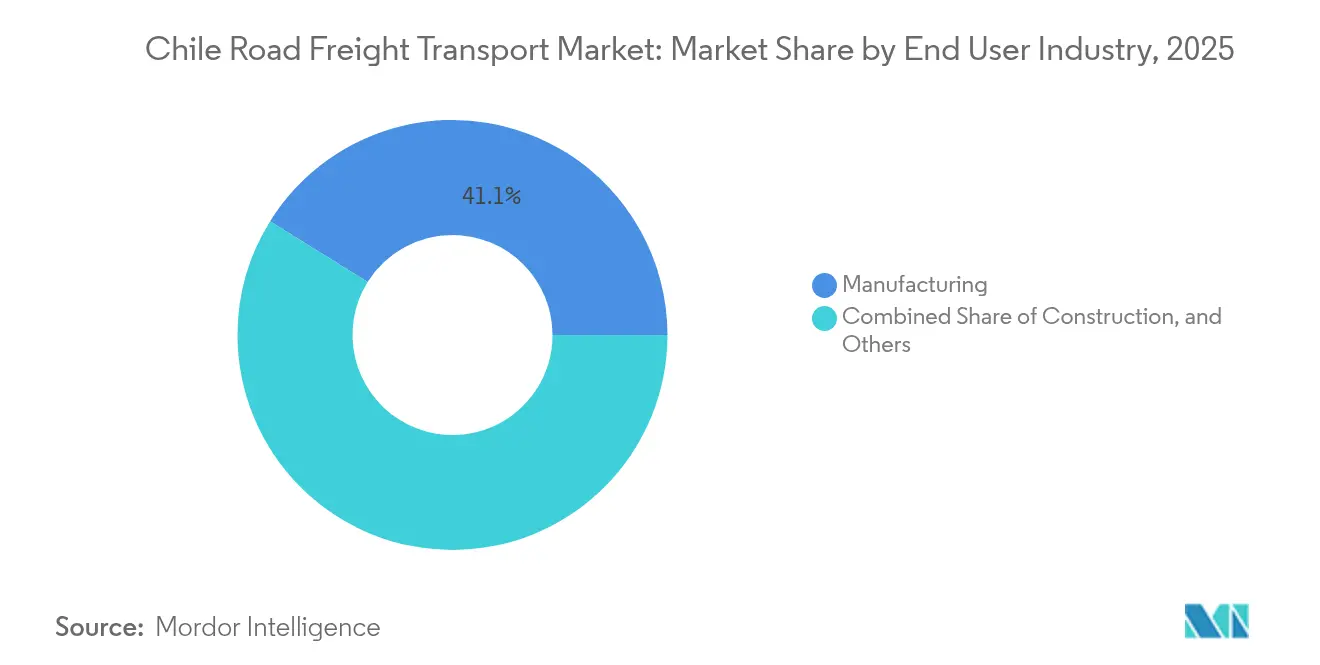
Manufacturing commanded 41.12% of the Chile road freight transport market share in 2025, thanks to sustained inflows of automotive parts and electronics under nearshoring deals. This dominance translates into stable FTL call-offs for just-in-time lines, while LTL opportunities arise from tier-2 suppliers delivering sub-assemblies. The Chile road freight transport market size attributable to wholesale and retail trade is smaller today but expands the fastest, mirroring the 5.85% CAGR projection driven by omnichannel grocery and Walmart’s USD 1.3 billion warehouse spree.
Mining, oil, and quarrying freight remains a backbone segment, buoyed by 49 active projects with a USD 65.71 billion capex pipeline and the National Lithium Strategy’s target of 300,000 LCE additional output. Agriculture adds significant seasonal elasticity; a single cherry harvest can boost container demand by 75%, forcing carriers to reposition reefers from central-southern orchards to San Antonio port under tight dwell-time windows. Construction volumes ebb and flow with infrastructure outlays—Ruta 5 upgrades alone inject more than seven million tons of aggregates and steel into the network through 2027.



By Destination: International Corridor Momentum Builds
Domestic lanes held 62.35% of the Chile road freight transport market in 2025, reflecting dense north–south trade along Ruta 5 between Santiago, Valparaíso, and Concepción. Yet international volumes now record a 5.98% CAGR through 2031 as bioceanic projects near completion and landlocked Paraguay taps Pacific gateways to Asia. Cross-border hauls typically involve soybean, beef, and auto parts flowing west and containerized consumer goods heading east.
Cabotage limits hamper back-haul yields, but harmonized customs procedures under the corridor plan and expanded use of electronic consignment notes shorten border dwell times by up to 30 minutes per truck. Currency risk remains: peso volatility against the Brazilian real can swing cross-border trucking rates by 4-5 percentage points within a quarter, prompting carriers to hedge via USD-denominated contracts.
By Truckload Specification: FTL Dominates, LTL Innovates
FTL represented 78.55% of the Chile road freight transport market size in 2025, supplying bulk copper, lithium, and agriculture. Mining consignors contract fixed-route FTL to mitigate hazardous-goods compliance complexity, which supports higher asset turns but leaves limited back-haul cargo. LTL expands at 5.74% CAGR as online retail proliferates, making multi-stop milk-runs viable in cities where e-delivery density exceeds 250 orders per square kilometer.
Digital brokers slice administrative time by combining rate benchmarking, e-bill-of-lading issuance, and automated proof-of-delivery flows, lowering entry barriers for small fleets. Higher touch-point LTL also drives demand for telematics, refrigerated micro-depots, and AI-based consolidation.
By Containerization: Bulk Reigns, Boxes Gain
Non-containerized bulk cargo holds 85.35% share because of Chile’s resources orientation. Copper concentrate moving from inland concentrators to Antofagasta port alone consumes thousands of tipper-truck runs daily. Even so, containerized loads now notch a 5.27% CAGR as manufactured goods, seafood, and fruit exports rise. The Chile road freight transport market size tied to reefer boxes grows in tandem with cherry and table-grape seasons that each require more than 3,500 controlled-atmosphere TEU per peak month.
DP World’s MoorMaster automated mooring in San Antonio cuts vessel turnaround by 30 minutes, smoothing truck gate scheduling and elevating box velocity. Manufacturers also favor containers for automotive components to mitigate theft and weather damage over long desert transits.
By Distance: Long-Haul Still Commands Volume
Long-haul trips account for 73.25% of 2025 tonnage as cities and mines lie hundreds of kilometers apart. Future bioceanic corridors could extend average trip length beyond 1,800 kilometers door-to-door when linking Paraguay or Brazil to Pacific hubs. These distances make diesel cost swings and toll escalators highly consequential—Route 5 tolls alone can reach USD 250 per tractor-trailer round trip.
Short-haul traffic gains pace in urban clusters, driven by same-day delivery promises that fuel micro-fulfillment centers within 20 kilometers of end consumers. Pilot programs with electric rigid trucks in Santiago aim to cut operating cost per kilometer by 35% once battery pack prices fall below USD 90 per kWh.
By Goods Configuration: Solids Dominate, Fluids Expand
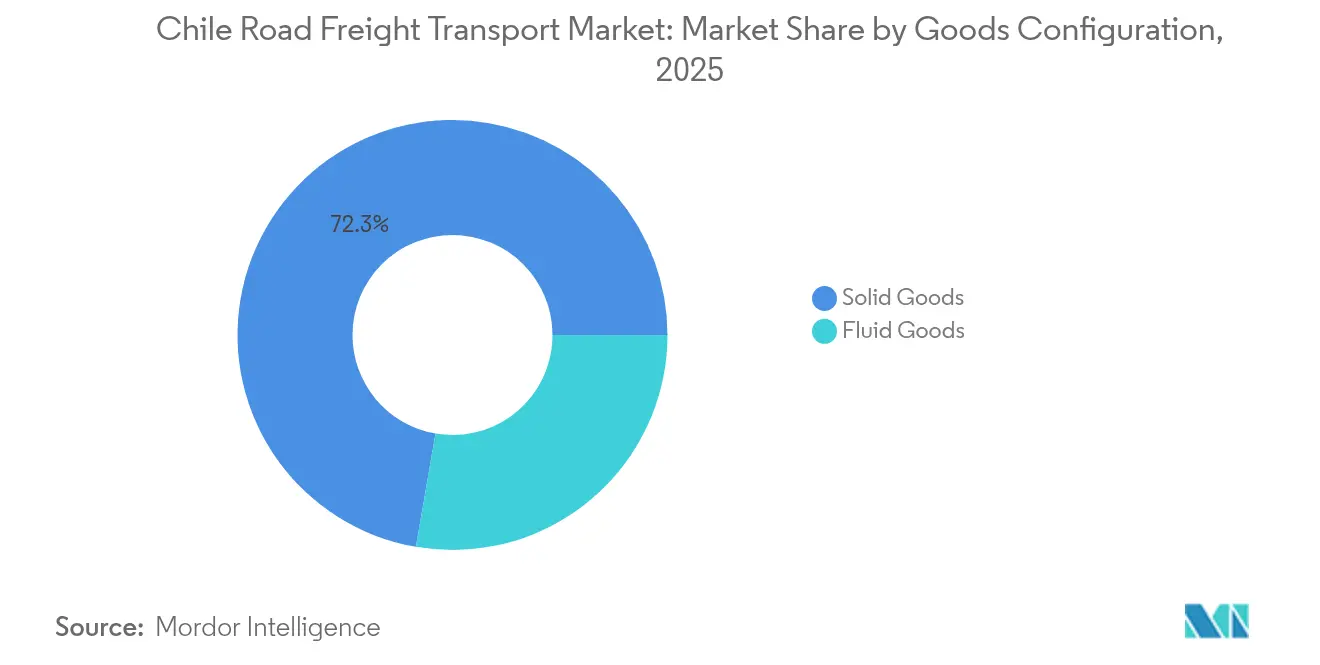
Solid goods controlled 72.28% of 2025 freight value, led by copper cathodes, iron ore, and sawn timber. Growing lithium processing lifts demand for fluid chemicals—sulfuric acid haulage rose 11% year-on-year to 2025 as well as specialized ISO tank containers capable of desert heat operation. The Chile road freight transport market share attributed to fluids remains modest but posts a 5.64% CAGR, underpinned by future hydrogen-related liquids once commercial projects materialize in Biobío.
Hazardous-goods regulations heighten compliance costs for fluid carriers, yet also shelter margins; insurers now require telematics with geofencing alarms for all acid transport above 25 MT—a specification that 60% of fleets still lack.
By Temperature Control: Ambient Dominates but Cold Chain Accelerates
Ambient freight held 94.52% share in 2025. However, the rise of high-value fruit and expanding grocery e-commerce push the cold-chain segment toward a 5.70% CAGR. Reefer fleet capacity remains tight, especially during December–January cherry harvests when demand can double weekly. Carriers invest in solar-assisted reefer units to shave diesel genset consumption, lowering per-trip fuel cost by up to 12%.
Green hydrogen pilots could eventually power refrigerated trailers, aligning with shippers’ Scope 3 emission pledges and reinforcing Chile’s image as a low-carbon logistics hub.
Geography Analysis
Santiago’s metropolitan area anchors domestic distribution thanks to its one-third share of national population and its concentration of major DCs. The Ruta 5 North and South corridors connect the capital to ports and agrarian zones, while a USD 1.27 billion widening project boosts resilience against El Niño-driven storms. Northern hubs such as Antofagasta serve the lithium triangle, with specialized ADR fleets running sulfuric acid south-north and returning with concentrates; distances exceed 1,400 kilometers. Southern regions, notably Biobío and Los Lagos, rely on long-haul flatbeds for timber and salmon feed, yet also host emerging green-hydrogen clusters.
Internationally, the April 2025 bioceanic roadmap formalizes a 2,400-kilometer corridor that replaces multi-week Cape Horn detours, stimulating truck traffic to Argentine and Paraguayan grain belts and shaving door-to-port lead times by roughly 11 days. Customs digitization and weight harmonization agreements cut border queues, though cabotage rules still prevent foreign tractors from loading domestic legs. Pacific-Atlantic rates compress as asset turns improve—one Antofagasta-Campo Grande-Antofagasta loop now completes in 6 days rather than 10.
Chile’s 65+ trade deals make it a re-export platform; trans-shipment imports of Asian consumer electronics head to Bolivia and Peru via the Arica corridor, stimulating growth for regional forwarders. Toll heterogeneity and FX volatility across borders keep pricing opaque, promoting interest in end-to-end USD contracts and dynamic fuel surcharges.
Regulatory Landscape
Chile road freight transport regulation is led by the Ministerio de Transportes y Telecomunicaciones (MTT) and its Subsecretaria de Transportes, covering road-safety compliance, operational documentation, and international land transport permitting. In January 2026, the MTT issued a standardized "Documentacion en Ruta" guide to harmonize in-route compliance for domestic and cross-border trucking, aligning enforcement expectations at checkpoints and border posts.
The regulatory direction is also shifting toward digital traceability and logistics-system governance. In March 2026, the MTT approved the Politica Nacional Logistica Portuaria (via Resolucion Exenta N. 1099), setting port system modernization and port-city integration priorities that affect road access, gate processes, and hinterland connectivity for trucking. Separately, tax-led e-document rules influence transport documentation timelines, with Servicio de Impuestos Internos (SII) postponing new technical requirements for electronic invoices and dispatch guides to 1 November 2026 (Resolucion Exenta N. 52/2026), giving carriers and shippers additional time to align fleet-side processes and TMS integrations.
Value Chain Analysis
The value chain starts with freight generation from mining, manufacturing, agriculture, and wholesale and retail trade, then moves to shipper/3PL procurement, freight forwarding and brokerage (including digital matching platforms), and execution by a highly fragmented base of owner-operators and fleets. Operations are supported by fuel supply, vehicle OEMs and dealers, maintenance networks, tire and parts suppliers, insurance, and telematics/TMS providers, with ports and inland terminals serving as key nodes for containerized and export-linked flows.
Public-sector coordination and infrastructure programs influence network capacity and cost pass-through across the chain. The Plan de Logistica Colaborativa (PLC) 2024-2025, coordinated through Conecta Logistica with public entities such as the MTT and CORFO, targets bottlenecks at hubs including San Antonio, Talcahuano-San Vicente, and the Puerto Terrestre Los Andes, linking operational improvements to road drayage performance. On the input-cost side, INE reported an 11.3% month-on-month jump in the Indice de Costos del Transporte (ICT) in April 2026, driven by a 45.7% increase in diesel, reinforcing fuel as a dominant cost lever for carriers and a central input into surcharge mechanisms. At the asset and corridor layer, the MOP roadworks budget for 2026 (1.95 trillion pesos) and the DGC concession pipeline (2026-2030) point to sustained road-network interventions that affect transit times, toll exposure, and route reliability for long-haul trucking.
Competitive Landscape
The market remains fragmented. Global giants intensify consolidation after DSV closed its EUR 14.3 billion (USD 15.78 billion) takeover of DB Schenker in April 2025, creating a 160,000-employee behemoth with Chilean coverage through inherited Schenker depots. Regional mid-caps respond by deepening vertical niches: some target temperature-controlled horticulture, others specialize in dangerous-goods mining runs.
Digital disruptors such as EnviaMe and Cargainteligente scale by licensing SaaS routing modules to owner-operators, winning market share in e-commerce segments. Legacy fleets modernize with Euro VI powertrains—Volvo delivered Latin America’s first heavy-duty EVs to a Santiago carrier in late 2024—to comply with upcoming emission norms and appeal to ESG-focused shippers. Investment circles note rising M&A chatter among mid-tier operators looking to gain negotiating power against toll-road concessions and fuel suppliers.
Strategic bets on intermodal integration emerge: three carriers bid for a 15-year service contract related to the USD 3.8 billion Santiago–Valparaíso rail concession, aiming to bundle road drayage with block-train operations once the line opens in 2030. Meanwhile, Walmart Chile’s hydrogen-fuel-cell pilot demonstrates shippers’ willingness to co-invest in alternative-energy fleets to hedge against diesel price volatility. Carriers lacking capital for these transitions risk margin erosion and eventual buyouts.
Chile Road Freight Transport Industry Leaders
Andes Logistics de Chile S.A.
Agunsa (Agencias Universales S.A.)
Transportes Casablanca
Transportes Nazar
Sotraser
- *Disclaimer: Major Players sorted in no particular order

Market Opportunities and Future Outlook
Digitization and compliance-led data flows create room for carriers and intermediaries that can integrate documentation, visibility, and cross-border processes. The MTT’s January 2026 "Documentacion en Ruta" standardization and the SII timeline to 1 November 2026 for updated e-invoice and electronic dispatch guide requirements define a window for fleets, brokers, and TMS providers to roll out compliant e-document workflows and reduce avoidable stoppages at checkpoints and borders.
Energy transition infrastructure is moving beyond pilots into corridor build-outs, supporting opportunities for operators with suitable assets and depot partnerships. In May 2026, Enel, ISA Vias, and Copelec inaugurated the first phase of a high-power electric highway for heavy cargo trucks on Ruta 5 Sur between Santiago and Chillan, providing a basis for electrification along a core freight spine for regional distribution and intercity lanes. At the system level, the MTT’s National Logistics Policy (presented in January 2026) and the PLC’s 5th edition (February 2026) focus public-private delivery on terminal efficiency at San Antonio, Talcahuano-San Vicente, and Arica, which supports service opportunities around port drayage planning, appointmenting, and container velocity. Data products such as Conecta Logisticass first Logistics Radar (June 2026) also support performance benchmarking and targeted service offerings, including cold-chain planning during peak export seasons and specialized hazardous and mining logistics on northern corridors.
Recent Industry Developments
- June 2026: Terminal Portuario Valparaiso (TPV), controlled by AGUNSA, signed a modification agreement with the Port of Valparaiso to extend the concession of Terminal 2 until December 2029, with approval by the Tribunal de Defensa de la Libre Competencia (TDLC). The extension improves planning certainty for port-hinterland trucking flows and supports longer-cycle investments in yard and gate processes that affect drayage productivity.
- April 2026: AGUNSA initiated integrated mining logistics operations for Capstone Copper at the Mantos Blancos and Mantoverde operations after securing the contract, covering warehousing and general cargo transportation across Santiago, Copiapo, and Antofagasta. The multi-region scope reinforces mining logistics as a demand anchor for road freight services and increases competitive pressure on providers specializing in project, general cargo, and mine-supply distribution.
- April 2025: DSV completed its acquisition of DB Schenker, expanding its footprint through inherited Schenker operations in Chile. The deal increased the scale of integrated logistics offerings available to shippers and intensified consolidation dynamics for road freight providers competing on nationwide coverage and contract logistics bundling.


Research Methodology Framework and Report Scope
Market Definition and Coverage
We define the market as the value of paid services for moving goods by road within Chile, including domestic hauling and cross-border trucking performed by road freight operators.
Scope exclusions: We exclude passenger road transport, courier and parcel-only services, and pure warehousing or freight forwarding fees that are not billed as road haulage.
Segmentation Overview
- By Destination
- Domestic
- International
- By End-User Industry
- Manufacturing
- Oil, Gas, Mining and Quarrying
- Agriculture, Fishing and Forestry
- Construction
- Wholesale and Retail Trade
- Other End-Users
- By Truckload Specification
- Full Truckload (FTL)
- Less-than-Truckload (LTL)
- By Containerization
- Containerised
- Non-Containerised
- By Distance
- Long Haul
- Short Haul
- By Goods Configuration
- Fluid Goods
- Solid Goods
- By Temperature Control
- Non-Temperature Controlled
- Temperature Controlled
Data Sources, Market Sizing, and Validation
Desk Research
Desk work starts by building a practical demand and operations picture for road trucking in Chile, then checking it against public statistics that are consistent over time. Sources we typically use include the National Statistics Institute (INE) for transport and economic indicators, the Central Bank of Chile for macro series and price indices, Chile Customs trade statistics for import and export volumes, the Ministry of Public Works (MOP) for road network and concession updates, and the Ministry of Transport and Telecommunications (MTT) for road transport rules and safety signals.
We also review operator disclosures such as annual reports, investor presentations, and fleet and service announcements, plus port and corridor updates from association and concessionaire websites and reputable press. When needed, paid subscriptions for company financials and news help with revenue cross-checks and event timelines, and a shipment-level import and export database can support direction checks on trade-linked lanes. The desk research sources listed here are not exhaustive, and other references were used for data collection, validation, and clarification.
Primary Interviews and Surveys
Primary work is used to stress-test the desk assumptions that can change the total size, especially pricing, utilization, and how often services are subcontracted. We speak with fleet owners, operations managers, dispatch heads, and shipper-side logistics teams across key demand pockets such as mining-linked corridors, retail distribution routes, and agricultural seasons, then reconcile differences before finalizing the model.
Distribution of primary research fieldwork respondents
| Company type | Respondent position |
|---|---|
| Top tier: 38% | CXOs: 12% |
| Mid tier: 41% | Functional/Unit leaders: 31% |
| Smaller Players: 21% | Managers: 57% |
Market-Sizing & Forecasting
Our core sizing logic uses a top-down reconstruction that starts from Chile freight activity and trade-linked flows, then translates that into road freight service value using road share assumptions and typical price levels. To keep it grounded, we corroborate totals through selective bottom-up checks, such as rolling up sampled operator revenues and comparing implied revenue per truck against realistic utilization.
Practical inputs that shape the model include the domestic versus international trucking mix, full-truckload versus less-than-truckload split, the share of containerized and temperature-controlled moves, and average length of haul across long-haul and short-haul work. Pricing is treated carefully because fuel dynamics, toll costs, and labor constraints can shift realized rates even when volumes are steady. For forecasting, we primarily use scenario analysis with variables such as industrial output tied to mining and construction, trade volumes, and inflation-adjusted rate movement, then align the forward path with what industry respondents consider achievable capacity and utilization.
Data Validation & Update Cycle
Model outputs are checked against independent signals, and the largest variances are traced back to one or two assumptions, which are then revisited with fresh calls when needed. We also run consistency tests across related metrics, such as whether implied revenue growth matches realistic changes in volumes, rates, and fleet use, and then review the work in steps before sign-off.
The report is refreshed on an annual cycle, with interim updates triggered when material events occur, such as major regulatory changes, sharp cost swings, or infrastructure disruptions that can change corridor economics. Before delivery, analysts do a final pass to ensure the latest public releases and validated interview learnings are reflected in the numbers.
Mordor Intelligence's Chile Road Freight Transport Market Size Compared With Other Published Estimates
Published market sizes for Chile road freight transport can look far apart because the service boundary and the year being quoted are not always the same, and pricing assumptions are handled differently. We also see differences when some sources blend adjacent logistics activities into trucking, or when the figure is presented in current dollars without clarifying the inflation timing.
Trade volumes, corridor activity signals, and operator-side rate confirmations are the checks that keep Mordor Intelligence aligned with a road-haulage-only value pool for Chile, rather than a broader logistics spend number. When other estimates emphasize a longer forecast window or apply conservative utilization and rate growth, the near-term market value can come out lower even if the direction of growth is similar.
Benchmark comparison
| Source | Market Size | Gaps in Research Methodology |
|---|---|---|
| Mordor Intelligence | USD 10.77 B (2025) | |
| Global Research Publisher A | USD 8.90 B (2026) | Uses a different reference year and a longer forecast window, and its near-term value appears to reflect more conservative utilization and rate progression for trucking services. |
| Industry Data Portal B | USD 11.37 B (2026) | Reports the next-year value and commonly summarizes the headline forecast figures, without detailing how domestic and cross-border scope, containerization, and temperature-controlled premiums are treated in the total. |
Looking across the three figures, most of the spread is explained by the year chosen and the exact boundary around road haulage versus wider logistics activities. By keeping the inputs traceable to freight activity, service mix, and rate reality checks, the final number stays repeatable and easier to defend when users update assumptions later.


Key Questions Answered in the Report
How large is the Chile road freight transport market in 2026?
The Chile road freight transport market size is valued at USD 11.37 billion in 2026.
What is the projected growth rate for Chilean trucking services through 2031?
The market is expected to expand at a 5.61% CAGR, reaching USD 14.94 billion by 2031.
Which end-user sector moves the most road freight in Chile?
Manufacturing leads with 41.12% of total market share in 2025, driven by automotive parts nearshoring.
Which destination segment is growing fastest for Chilean carriers?
International freight traffic shows the highest momentum with a 5.98% CAGR through 2031, supported by the bioceanic corridor initiative.
How significant is e-commerce for trucking demand in Chile?
Rapid e-commerce expansion adds 1.2 percentage points to forecast market CAGR, fueling LTL and last-mile volumes.
What challenges do Chilean road freight operators face?
Key hurdles include driver shortages, rising tolls, cabotage limits on back-hauls, and climate-driven disruptions on mountain routes.
Page last updated on:


 Your data is secure and never sold or shared.


