Market Overview
| Study Period | 2021 - 2031 |
|---|---|
| Forecast Data Period | 2026 - 2031 |
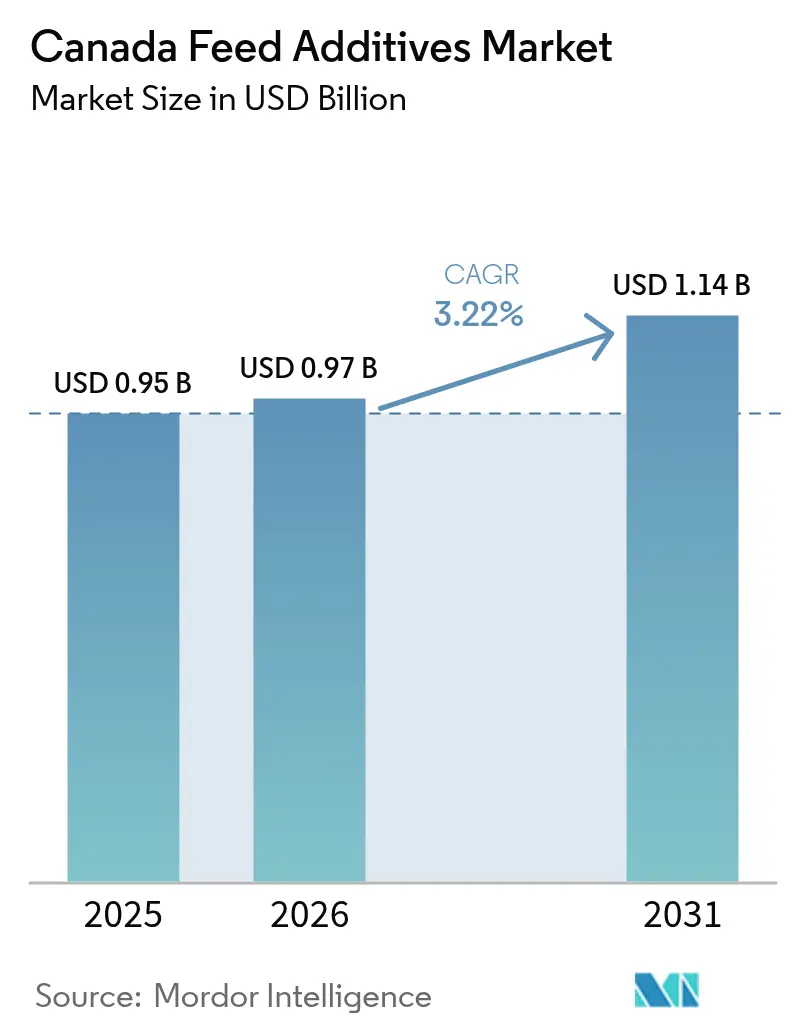
| Base Year Market Size (2025) | USD 0.95 Billion |
| Market Size (2026) | USD 0.97 Billion |
| Market Size (2031) | USD 1.14 Billion |
| Growth Rate (2026 - 2031) | 3.22% CAGR |
| Market Concentration | Medium |
Major Players *Disclaimer: Major Players sorted in no particular order Image © Mordor Intelligence. Reuse requires attribution under CC BY 4.0. | |
Canada Feed Additives Market Analysis by Mordor Intelligence
The Canada feed additives market size is projected to be USD 0.95 billion in 2025, USD 0.97 billion in 2026, and reach USD 1.14 billion by 2031, growing at a CAGR of 3.22% through 2031. This growth is underpinned by the Canadian Food Inspection Agency (CFIA) Feeds Regulations 2024, which streamlines approvals for innovative inputs while keeping strict safety guardrails[1]Source: Canadian Food Inspection Agency, “Feeds Regulations 2024,” inspection.canada.ca. Amino acids, enzymes, and probiotics are increasingly used in swine and poultry production to improve feed efficiency, reduce nitrogen excretion, and support better animal health. Acidifiers are gaining ground as preferred tools for pathogen control that do not rely on antibiotics. At the same time, digital precision‑feeding and micro‑dosing platforms are enabling data‑driven additive use, helping producers cut waste and achieve measurable environmental benefits. Consolidation among suppliers is reshaping the industry, with large joint ventures creating stronger purchasing power and expanding access to advanced specialty products. These shifts highlight how innovation and collaboration are driving progress in modern animal nutrition.
Key Report Takeaways
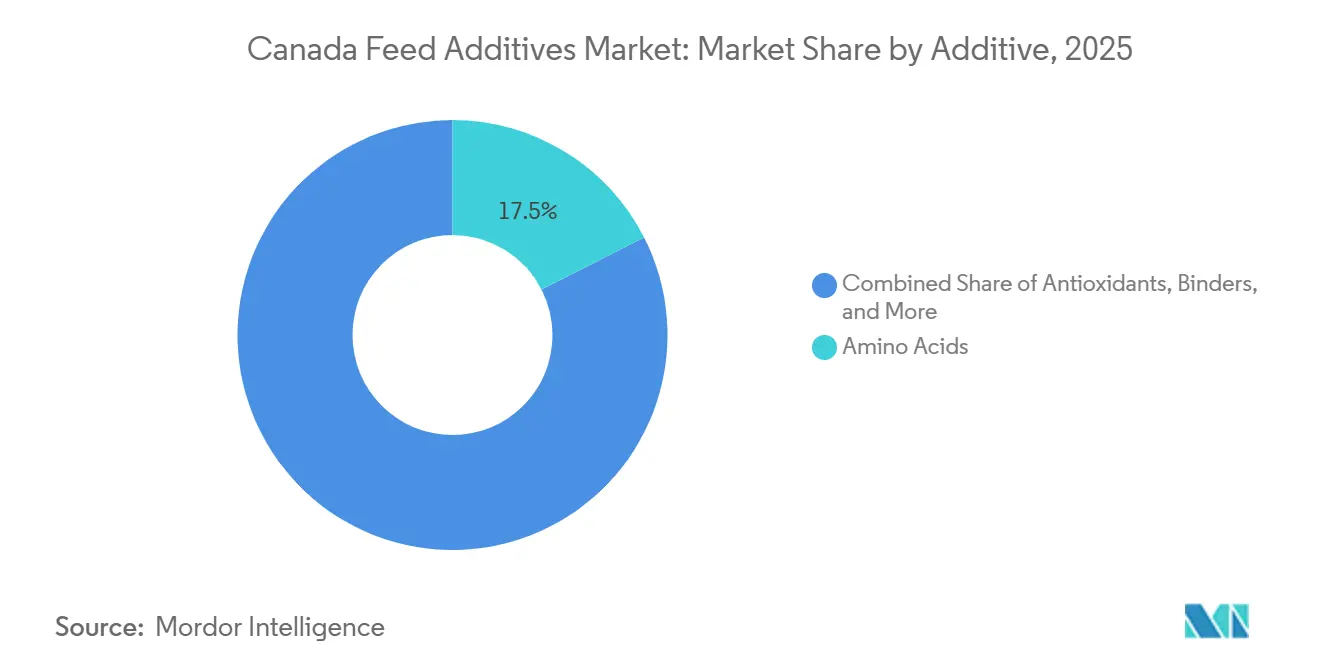
- By additive, amino acids led with 17.5% of Canada feed additives market share in 2025, while acidifiers are projected to expand at a 5.1% CAGR through 2031.
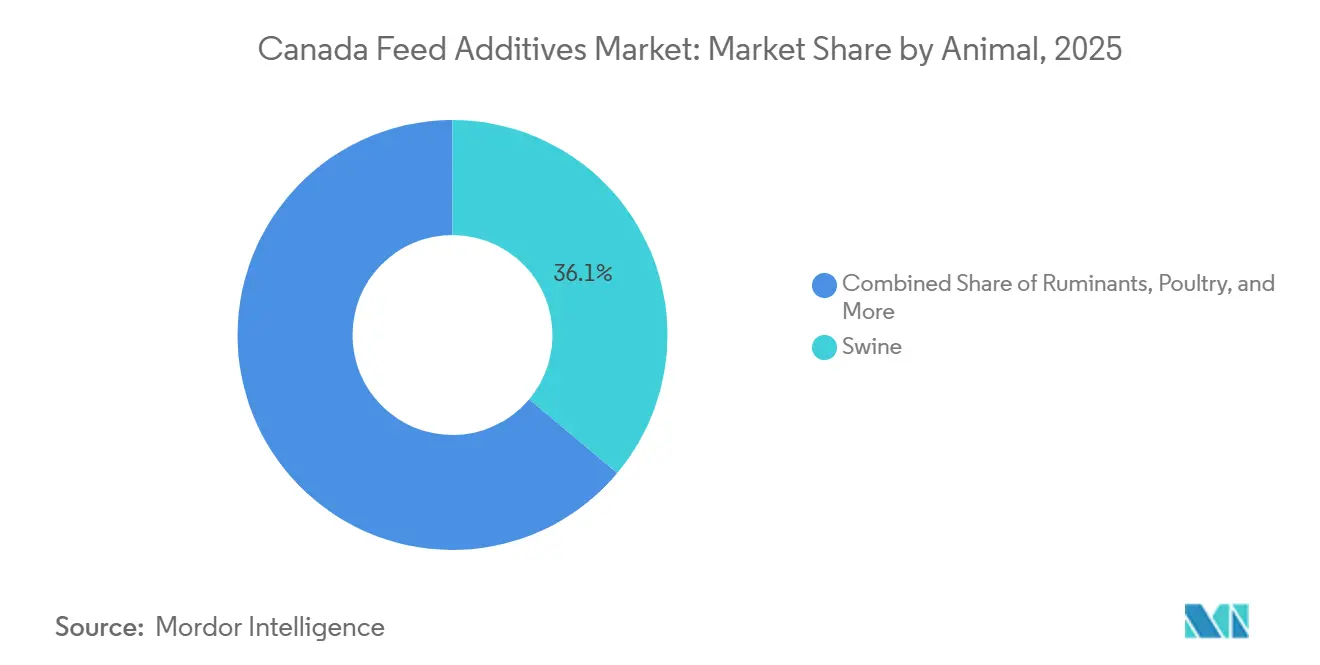
- By animal, swine accounted for 36.1% of the Canada feed additives market size in 2025, whereas poultry is poised for the fastest growth at 4.7% CAGR to 2031.
- Elanco Animal Health Inc., Evonik Industries AG, IFF (Danisco Animal Nutrition), DSM-Firmenich, and Archer Daniels Midland Co. are the major players in the Canada feed additives market.
Note: Market size and forecast figures in this report are generated using Mordor Intelligence’s proprietary estimation framework, updated with the latest available data and insights as of 2026.
Canada Feed Additives Market Trends and Insights
Drivers Impact Analysis*
| Driver | (~) % Impact on CAGR Forecast | Geographic Relevance | Impact Timeline |
|---|---|---|---|
| Rising demand for functional proteins in animal diets | +0.6% | Ontario and Quebec | Medium term (2–4 years) |
| Ban on antibiotic growth promoters boosting alternative additives | +0.8% | Nationwide | Short term (≤ 2 years) |
| Expansion of aquaculture in Atlantic | +0.4% | Atlantic Canada | Medium term (2–4 years) |
| Adoption of precision-feeding digital platforms by large integrators | +0.5% | Ontario, Quebec, Alberta, Manitoba | Long term (≥ 4 years) |
| Valorization of brewery grains into yeast-rich additives | +0.3% | Ontario and British Columbia | Long term (≥ 4 years) |
| AI-enabled micro-dosing improving additive | +0.4% | Dairy‑intensive regions | Long term (≥ 4 years) |
| Source: Mordor Intelligence | |||
Rising Demand for Functional Proteins in Animal Diets
Feed manufacturers are increasingly turning to high‑protein canola meal and other domestic oilseed coproducts to reduce reliance on imported soybean meal[2]Source: Animal Nutrition Association of Canada, “ANAC Warns of US Tariff Impacts on Feed Ingredients,” anac.ca. Advances in plant breeding have improved protein levels, making these meals more attractive for livestock diets. Synthetic amino acids are also being used to replace portions of traditional protein sources, helping lower nitrogen excretion and improve sustainability. In regions with strict nutrient‑management plans, these shifts are particularly valuable as they align with environmental regulations. Aquaculture producers are testing canola protein to supplement trout and salmon diets, diversifying away from fishmeal. Enzymes and yeast derivatives further enhance digestibility, reinforcing demand and supporting steady growth in the Canada feed additives market.
Ban on Antibiotic Growth Promoters Boosting Alternative Additives
The restriction on antibiotic growth promoters is accelerating the adoption of alternative feed additives. Acidifier blends are gaining traction as effective tools for pathogen control, while probiotics featuring beneficial bacterial strains are helping producers maintain animal health during the transition. Regulatory pilots are providing clarity on approval requirements, shortening product development cycles, and encouraging innovation. For producers, failure to adopt alternatives risks higher mortality and reduced feed efficiency, underscoring the need for substitution. Companies are responding with new microbial solutions that bridge the gap between conventional preservatives and veterinary medicines. This structural change is creating a strong tailwind for the Canada feed additives market, embedding alternatives as a core part of modern livestock nutrition.
Expansion of Aquaculture in Atlantic
Aquaculture in Atlantic Canada is expanding rapidly, with salmon farming positioned as a key growth sector. Functional feeds fortified with omega‑3 fatty acids are central to improving fish health and survival rates during disease challenges[3]Source: Government of New Brunswick, “Aquaculture Statistics,” gnb.ca. Algal oils are emerging as sustainable alternatives to fish oil, offering comparable nutritional benefits without concerns over contaminants. Producers are increasingly building health plans around nutritional interventions rather than relying solely on chemical treatments, anchoring demand for specialty additives. This shift reflects a broader move toward preventive strategies in aquaculture, where nutrition plays a critical role in productivity. As the sector grows, feed additives tailored to fish health will become a cornerstone of the Canada feed additives market.
Adoption of Precision-Feeding Digital Platforms by Large Integrators
Digital technologies are transforming feed management, with precision‑feeding platforms enabling real‑time ration adjustments. Machine‑learning models paired with sensors allow producers to optimize feed use, reduce waste, and improve environmental outcomes such as lower emissions. Large integrators are investing in these systems, which quickly pay off when scaled across thousands of animals. By embedding decision support tools into feeding operations, companies create a data‑driven advantage that strengthens purchasing power and increases uptake of specialty additives. Vendors are also bundling digital services with product discounts, reinforcing long‑term supply contracts. This integration of technology and nutrition is reshaping efficiency and sustainability, positioning precision‑feeding as a major driver of growth in the Canada feed additives market.
Restraints Impact Analysis*
| Restraint | (~) % Impact on CAGR Forecast | Geographic Relevance | Impact Timeline |
|---|---|---|---|
| Price volatility of key amino acid imports | −0.5% | Nationwide | Short term (≤ 2 years) |
| Supply-chain disruptions in vitamin premixes | −0.3% | Ontario and Quebec | Short term (≤ 2 years) |
| Low adoption among small ruminant farmers | −0.2% | Prairie provinces and rural Quebec | Medium term (2–4 years) |
| Tightening organic-label rules limiting synthetic antioxidants | −0.3% | Organic dairies and poultry farms | Medium term (2–4 years) |
| Source: Mordor Intelligence | |||
Price Volatility of Key Amino Acid Imports
Lysine and methionine prices experienced significant volatility in 2024, amid tightening energy markets and reduced output from Asian producers, which constrained supply. Amino acids such as lysine are particularly susceptible to wide fluctuations, driven by global oversupply conditions and variability in international freight rates. Canadian feed mills, often holding limited inventory, face margin compression when prices spike. Smaller buyers without access to hedging tools remain particularly exposed, making cost management difficult. This volatility drags on the Canada feed additives market, as mills struggle to balance affordability with consistent supply. The unpredictability of input costs underscores the importance of diversified sourcing and risk‑management strategies. Price swings continue to challenge stability, influencing purchasing decisions and slowing broader adoption of specialty feed additives across the sector.
Supply-Chain Disruptions in Vitamin Premixes
Global supply disruptions in vitamin premixes have extended lead times and raised reformulation costs for feed mills. Consolidation among major suppliers is reshaping the market, increasing supplier power and reducing flexibility for buyers. Mills are now holding larger inventories to safeguard against shortages, tying up capital and tempering growth. These disruptions highlight the vulnerability of the supply chain and the need for diversified sourcing strategies. While demand for vitamins remains strong, uncertainty around availability and pricing continues to weigh on the Canada feed additives market. Long‑term solutions will depend on improved logistics, stronger partnerships, and expanded production capacity.
*Our forecasts treat driver/restraint impacts as directional, not additive. The impact forecasts reflect baseline growth, mix effects, and variable interactions.
Segment Analysis
By Additive: Amino Acids Retain Leadership while Acidifiers Gain Pace
Amino acids led with 17.5% of Canada feed additives market share in 2025, anchored by lysine, methionine, and threonine inclusion in pig and poultry diets. Integrators use synthetic amino acids to lower crude protein levels, reduce nitrogen excretion, and improve sustainability. Enzyme co‑application enhances digestibility, reducing reliance on soybean meal and aligning with nutrient‑management requirements in regions such as Quebec. Vitamins continue to play a role despite price fluctuations, while enzymes like phytases and carbohydrases improve phosphorus release in wheat‑based diets. Yeast derivatives sourced from brewery byproducts are gaining traction as cost‑effective alternatives, reinforcing blending strategies and supporting balanced growth in the Canada feed additives market size.
Acidifiers are projected to expand at a 5.1% CAGR through 2031, making them the fastest‑growing component of the Canada feed additives market size. Broiler integrators adopt blends of fumaric, lactic, and propionic acids to suppress pathogens in antibiotic‑free programs. Organic acids also extend shelf life of high‑moisture feeds, reducing mold risk during warmer seasons. In aquaculture, formic‑fumaric combinations stabilize pellet microbiology, supporting fish health in recirculating systems. Suppliers increasingly bundle acidifiers with enzymes or probiotics, raising average selling prices and fostering brand loyalty. Because acidifiers deliver both food‑safety and health‑promotion benefits, their uptake remains resilient even when grain prices fluctuate, positioning them as a cornerstone of future growth in the sector.


By Animal: Swine Dominates while Poultry Shows Fastest Expansion
Swine accounted for 36.1% of the Canada feed additives market size in 2025, reflecting the importance of amino acids and enzymes in pig diets. Producers rely on lysine and threonine to optimize protein utilization, while probiotics and acidifiers help maintain gut health and reduce reliance on antibiotics. Enzyme packages improve the digestibility of cereal‑based diets, lowering feed costs and supporting environmental compliance. Nutrient‑management rules in key provinces encourage the adoption of additives that reduce nitrogen excretion, reinforcing demand. For instance, Ontario’s agricultural regulations require nutrient management plans for large swine operations, mandating strategies to minimize nitrogen runoff into waterways. This has accelerated the use of feed additives such as amino acids and enzyme blends that improve nutrient absorption and reduce waste. Swine integrators also experiment with yeast derivatives to enhance immune function and performance. This segment remains a stable contributor to overall growth, balancing commodity amino acids with specialty solutions that add value.
Poultry is poised for the fastest growth at a 4.7% CAGR to 2031, driven by rising demand for antibiotic‑free production systems. Acidifiers and probiotics are central to maintaining feed conversion efficiency and bird health, while enzymes improve nutrient release from corn and wheat diets. Integrators adopt precision‑feeding technologies that optimize additive use, cutting waste and improving sustainability. Vitamins remain essential for broiler and layer performance, despite supply‑chain challenges. Retail demand for poultry raised under strict stewardship programs further accelerates uptake of specialty additives. As consumer preferences shift toward healthier protein sources, poultry producers are positioned to expand their role in the Canada feed additives market share, making this segment a key driver of future growth.
Geography Analysis
Ontario and Quebec together represent the largest share of the Canada feed additives market, driven by strong poultry, dairy, and hog production. Ontario's extensive chicken and egg output sustains steady demand for amino acids, enzymes, and acidifiers, while Quebec’s dairy pool and hog harvest underpin robust probiotic and enzyme use. Ontario’s chicken output reached 479,830 metric tons in 2024, a 0.5% increase from 2023. This growth positioned Ontario as the single largest contributor to Canada’s overall chicken production, accounting for more than 40% of the national output. Cooperative structures such as Sollio Agriculture aggregate purchasing volumes, enhancing bargaining power with multinational suppliers. In September 2024, the ADM-Alltech venture expanded distribution capacity by integrating feed mills under a single umbrella, reshaping supply chains, and reinforcing these provinces' status as central hubs for the Canadian feed additives market.
The Prairie provinces generate a significant portion of additive demand, with Alberta’s feedlot sector leading trials in yeast and methane‑reduction products. Manitoba’s hog industry drives uptake of amino acids, while Saskatchewan’s emerging pork sector embraces enzymes to optimize wheat‑based diets. Freight premiums from Central Canada inflate delivered prices, prompting Prairie mills to stockpile during winter months. Smaller beef and sheep farms often limit specialty additive use, reducing penetration outside intensive systems. Despite these challenges, the Prairies remain a critical region for innovation in feed efficiency and sustainability, contributing steadily to the overall Canada feed additives market size.
Atlantic Canada contributes a smaller share of national value but records the highest growth, driven by salmon farming in Nova Scotia and New Brunswick. Functional feeds fortified with algal oils, pigments, and immune‑supporting additives are integrated at higher rates than in terrestrial livestock, supporting fish health and meeting sustainability criteria for export markets. British Columbia mirrors these trends with significant salmon production and a strong poultry sector. Its craft‑brewery industry also supplies spent yeast for additive production, reinforcing circular‑economy practices. Together, Atlantic Canada and British Columbia highlight how aquaculture and regional innovation are diversifying demand and expanding the Canada feed additives market share.
Competitive Landscape
Market concentration is moderate, with the top five firms accounting for the majority of revenue. Archer Daniels Midland Co., DSM-Firmenich, Elanco Animal Health Inc., IFF(Danisco Animal Nutrition), and Evonik Industries AG form the top tier, each holding broad additive portfolios and vertically integrated grain origination to buffer ingredient price swings. Evonik is one of the leading companies in vertically integrated amino acid production, leveraging advanced technologies to reduce its carbon footprint. Archer Daniels Midland strengthened its position with a joint venture that integrates milling, premix, and ingredient sourcing, locking in demand across Canadian mills. Elanco is pivoting toward enzymes and probiotics as antibiotic use declines, while DSM‑Firmenich faces strategic changes ahead of its planned restructuring. IFF maintains a strong presence with phytase and probiotic portfolios. Collectively, these leaders shape the competitive dynamics of the Canada feed additives market.
The remaining share is fragmented among domestic specialists. Jefo Nutrition Group pioneers liquid essential‑oil blends for swine, Probiotech supplies natural antioxidants approved for organic systems, and Biofeed markets multi‑strategic mycotoxin detoxifiers. These companies differentiate through innovation and niche expertise, serving specific segments of the Canadian livestock industry. Their agility allows them to respond quickly to regional needs, while partnerships with cooperatives and integrators strengthen distribution. Domestic specialists add diversity to the Canada feed additives market share, balancing the influence of multinational firms with localized solutions.
Supplier consolidation and digital‑nutrition platforms are intensifying competition, with differentiation increasingly tied to technical services, data analytics, and sustainability credentials. Emerging innovation areas include brewery‑grain valorization, insect‑protein approvals, and precision‑fermentation amino acids. Canadian startups are scaling commercial capacity in these fields, positioning themselves as disruptors in specialty additives. These innovations highlight the evolving nature of the market, where sustainability and advanced nutrition intersect. As new technologies mature, they will expand opportunities and reinforce Canada’s role as a hub for feed‑additive innovation, contributing to long‑term growth in the Canada feed additives market size.
Canada Feed Additives Industry Leaders
Elanco Animal Health Inc.
Evonik Industries AG
IFF(Danisco Animal Nutrition)
DSM-Firmenich
Archer Daniels Midland Co.
- *Disclaimer: Major Players sorted in no particular order


Recent Industry Developments
- February 2025: DSM-Firmenich completed the sale of its stake in the Feed Enzymes Alliance to partner Novonesis for EUR 1.5 billion (USD 1.61 billion), with the disposed feed-enzyme activities generating approximately EUR 300 million (USD 321 million) net revenue in 2024, as part of the company's broader strategy to divest its Animal Nutrition and Health unit during 2025.
- November 2024: Phibro Animal Health Corporation completed its USD 350 million acquisition of Zoetis' medicated feed additive product portfolio and certain water-soluble products, adding over 37 product lines sold in approximately 80 countries and six manufacturing sites, including Canada.
- January 2024: DSM-Firmenich, a nutrition, health, and beauty company, received market authorization in Canada for Bovaer, a feed additive for dairy and beef cattle. Bovaer reduces methane emissions in dairy cows by an average of 30% and in feedlot beef cattle by up to 45%, lowering the carbon footprint of dairy and beef farming.


Canada Feed Additives Market Report Scope
Feed additives are defined as substances, micro‑organisms, or preparations intentionally added to animal feed or water to improve feed quality, animal performance, or health outcomes. The Canada Feed Additives Market Report is Segmented by Additive (Acidifiers, Amino Acids, Antibiotics, Antioxidants, Binders, Enzymes, Flavors and Sweeteners, Minerals, Mycotoxin Detoxifiers, Phytogenics, Pigments, Prebiotics, Probiotics, and More), Animal (Aquaculture, Poultry, Ruminants, Swine, and More). The Market Forecasts are Provided in Terms of Value (USD) and Volume (Metric Tons)
Additive
| Acidifiers | By Sub Additive | Fumaric Acid |
| Lactic Acid | ||
| Propionic Acid | ||
| Other Acidifiers | ||
| Amino Acids | By Sub Additive | Lysine |
| Methionine | ||
| Threonine | ||
| Tryptophan | ||
| Other Amino Acids | ||
| Antibiotics | By Sub Additive | Bacitracin |
| Penicillins | ||
| Tetracyclines | ||
| Tylosin | ||
| Other Antibiotics | ||
| Antioxidants | By Sub Additive | Butylated Hydroxyanisole (BHA) |
| Butylated Hydroxytoluene (BHT) | ||
| Citric Acid | ||
| Ethoxyquin | ||
| Propyl Gallate | ||
| Tocopherols | ||
| Other Antioxidants | ||
| Binders | By Sub Additive | Natural Binders |
| Synthetic Binders | ||
| Enzymes | By Sub Additive | Carbohydrases |
| Phytases | ||
| Other Enzymes | ||
| Flavors and Sweeteners | By Sub Additive | Flavors |
| Sweeteners | ||
| Minerals | By Sub Additive | Macrominerals |
| Microminerals | ||
| Mycotoxin Detoxifiers | By Sub Additive | Binders |
| Biotransformers | ||
| Phytogenics | By Sub Additive | Essential Oil |
| Herbs and Spices | ||
| Other Phytogenics | ||
| Pigments | By Sub Additive | Carotenoids |
| Curcumin and Spirulina | ||
| Prebiotics | By Sub Additive | Fructo Oligosaccharides |
| Galacto Oligosaccharides | ||
| Inulin | ||
| Lactulose | ||
| Mannan Oligosaccharides | ||
| Xylo Oligosaccharides | ||
| Other Prebiotics | ||
| Probiotics | By Sub Additive | Bifidobacteria |
| Enterococcus | ||
| Lactobacilli | ||
| Pediococcus | ||
| Streptococcus | ||
| Other Probiotics | ||
| Vitamins | By Sub Additive | Vitamin A |
| Vitamin B | ||
| Vitamin C | ||
| Vitamin E | ||
| Other Vitamins | ||
| Yeast | By Sub Additive | Live Yeast |
| Selenium Yeast | ||
| Spent Yeast | ||
| Torula Dried Yeast | ||
| Whey Yeast | ||
| Yeast Derivatives |
Animal
| Aquaculture | By Sub Animal | Fish |
| Shrimp | ||
| Other Aquaculture Species | ||
| Poultry | By Sub Animal | Broiler |
| Layer | ||
| Other Poultry Birds | ||
| Ruminants | By Sub Animal | Beef Cattle |
| Dairy Cattle | ||
| Other Ruminants | ||
| Swine | ||
| Other Animals |
| Additive | Acidifiers | By Sub Additive | Fumaric Acid |
| Lactic Acid | |||
| Propionic Acid | |||
| Other Acidifiers | |||
| Amino Acids | By Sub Additive | Lysine | |
| Methionine | |||
| Threonine | |||
| Tryptophan | |||
| Other Amino Acids | |||
| Antibiotics | By Sub Additive | Bacitracin | |
| Penicillins | |||
| Tetracyclines | |||
| Tylosin | |||
| Other Antibiotics | |||
| Antioxidants | By Sub Additive | Butylated Hydroxyanisole (BHA) | |
| Butylated Hydroxytoluene (BHT) | |||
| Citric Acid | |||
| Ethoxyquin | |||
| Propyl Gallate | |||
| Tocopherols | |||
| Other Antioxidants | |||
| Binders | By Sub Additive | Natural Binders | |
| Synthetic Binders | |||
| Enzymes | By Sub Additive | Carbohydrases | |
| Phytases | |||
| Other Enzymes | |||
| Flavors and Sweeteners | By Sub Additive | Flavors | |
| Sweeteners | |||
| Minerals | By Sub Additive | Macrominerals | |
| Microminerals | |||
| Mycotoxin Detoxifiers | By Sub Additive | Binders | |
| Biotransformers | |||
| Phytogenics | By Sub Additive | Essential Oil | |
| Herbs and Spices | |||
| Other Phytogenics | |||
| Pigments | By Sub Additive | Carotenoids | |
| Curcumin and Spirulina | |||
| Prebiotics | By Sub Additive | Fructo Oligosaccharides | |
| Galacto Oligosaccharides | |||
| Inulin | |||
| Lactulose | |||
| Mannan Oligosaccharides | |||
| Xylo Oligosaccharides | |||
| Other Prebiotics | |||
| Probiotics | By Sub Additive | Bifidobacteria | |
| Enterococcus | |||
| Lactobacilli | |||
| Pediococcus | |||
| Streptococcus | |||
| Other Probiotics | |||
| Vitamins | By Sub Additive | Vitamin A | |
| Vitamin B | |||
| Vitamin C | |||
| Vitamin E | |||
| Other Vitamins | |||
| Yeast | By Sub Additive | Live Yeast | |
| Selenium Yeast | |||
| Spent Yeast | |||
| Torula Dried Yeast | |||
| Whey Yeast | |||
| Yeast Derivatives | |||
| Animal | Aquaculture | By Sub Animal | Fish |
| Shrimp | |||
| Other Aquaculture Species | |||
| Poultry | By Sub Animal | Broiler | |
| Layer | |||
| Other Poultry Birds | |||
| Ruminants | By Sub Animal | Beef Cattle | |
| Dairy Cattle | |||
| Other Ruminants | |||
| Swine | |||
| Other Animals | |||


Market Definition
- FUNCTIONS - For the study, feed additives are considered to be commercially manufactured products that are used to enhance characteristics such as weight gain, feed conversion ratio, and feed intake when fed in appropriate proportions.
- RESELLERS - Companies engaged in reselling feed additives without value addition have been excluded from the market scope, to avoid double counting.
- END CONSUMERS - Compound feed manufacturers are considered to be end-consumers in the market studied. The scope excludes farmers buying feed additives to be used directly as supplements or premixes.
- INTERNAL COMPANY CONSUMPTION - Companies engaged in the production of compound feed as well as the manufacturing of feed additives are part of the study. However, while estimating the market sizes, the internal consumption of feed additives by such companies has been excluded.
| Keyword | Definition |
|---|---|
| Feed additives | Feed additives are products used in animal nutrition for purposes of improving the quality of feed and the quality of food from animal origin, or to improve the animals’ performance and health. |
| Probiotics | Probiotics are microorganisms introduced into the body for their beneficial qualities. (It maintains or restores beneficial bacteria to the gut). |
| Antibiotics | Antibiotic is a drug that is specifically used to inhibit the growth of bacteria. |
| Prebiotics | A non-digestible food ingredient that promotes the growth of beneficial microorganisms in the intestines. |
| Antioxidants | Antioxidants are compounds that inhibit oxidation, a chemical reaction that produces free radicals. |
| Phytogenics | Phytogenics are a group of natural and non-antibiotic growth promoters derived from herbs, spices, essential oils, and oleoresins. |
| Vitamins | Vitamins are organic compounds, which are required for normal growth and maintenance of the body. |
| Metabolism | A chemical process that occurs within a living organism in order to maintain life. |
| Amino acids | Amino acids are the building blocks of proteins and play an important role in metabolic pathways. |
| Enzymes | Enzyme is a substance that acts as a catalyst to bring about a specific biochemical reaction. |
| Anti-microbial resistance | The ability of a microorganism to resist the effects of an antimicrobial agent. |
| Anti-microbial | Destroying or inhibiting the growth of microorganisms. |
| Osmotic balance | It is a process of maintaining salt and water balance across membranes within the body's fluids. |
| Bacteriocin | Bacteriocins are the toxins produced by bacteria to inhibit the growth of similar or closely related bacterial strains. |
| Biohydrogenation | It is a process that occurs in the rumen of an animal in which bacteria convert unsaturated fatty acids (USFA) to saturated fatty acids (SFA). |
| Oxidative rancidity | It is a reaction of fatty acids with oxygen, which generally causes unpleasant odors in animals. To prevent these, antioxidants were added. |
| Mycotoxicosis | Any condition or disease caused by fungal toxins, mainly due to contamination of animal feed with mycotoxins. |
| Mycotoxins | Mycotoxins are toxin compounds that are naturally produced by certain types of molds (fungi). |
| Feed Probiotics | Microbial feed supplements positively affect gastrointestinal microbial balance. |
| Probiotic yeast | Feed yeast (single-cell fungi) and other fungi used as probiotics. |
| Feed enzymes | They are used to supplement digestive enzymes in an animal’s stomach to break down food. Enzymes also ensure that meat and egg production is improved. |
| Mycotoxin detoxifiers | They are used to prevent fungal growth and to stop any harmful mold from being absorbed in the gut and blood. |
| Feed antibiotics | They are used both for the prevention and treatment of diseases but also for rapid growth and development. |
| Feed antioxidants | They are used to protect the deterioration of other feed nutrients in the feed such as fats, vitamins, pigments, and flavoring agents, thus providing nutrient security to the animals. |
| Feed phytogenics | Phytogenics are natural substances, added to livestock feed to promote growth, aid in digestion, and act as anti-microbial agents. |
| Feed vitamins | They are used to maintain the normal physiological function and normal growth and development of animals. |
| Feed flavors and sweetners | These flavors and sweeteners help to mask tastes and odors during changes in additives or medications and make them ideal for animal diets undergoing transition. |
| Feed acidifiers | Animal feed acidifiers are organic acids incorporated into the feed for nutritional or preservative purposes. Acidifiers enhance congestion and microbiological balance in the alimentary and digestive tracts of livestock. |
| Feed minerals | Feed minerals play an important role in the regular dietary requirements of animal feed. |
| Feed binders | Feed binders are the binding agents used in the manufacture of safe animal feed products. It enhances the taste of food and prolongs the storage period of the feed. |
| Key Terms | Abbreviation |
| LSDV | Lumpy Skin Disease Virus |
| ASF | African Swine Fever |
| GPA | Growth Promoter Antibiotics |
| NSP | Non-Starch Polysaccharides |
| PUFA | Polyunsaturated Fatty Acid |
| Afs | Aflatoxins |
| AGP | Antibiotic Growth Promoters |
| FAO | The Food And Agriculture Organization of the United Nations |
| USDA | The United States Department of Agriculture |


Research Methodology
Mordor Intelligence follows a four-step methodology in all our reports.
- Step-1: IDENTIFY KEY VARIABLES: In order to build a robust forecasting methodology, the variables and factors identified in Step-1 are tested against available historical market numbers. Through an iterative process, the variables required for market forecast are set and the model is built on the basis of these variables.
- Step-2: Build a Market Model: Market-size estimations for the forecast years are in nominal terms. Inflation is not a part of the pricing, and the average selling price (ASP) is kept constant throughout the forecast period.
- Step-3: Validate and Finalize: In this important step, all market numbers, variables and analyst calls are validated through an extensive network of primary research experts from the market studied. The respondents are selected across levels and functions to generate a holistic picture of the market studied.
- Step-4: Research Outputs: Syndicated Reports, Custom Consulting Assignments, Databases & Subscription Platforms


