Market Overview
| Study Period | 2018 - 2031 |
|---|---|
| Forecast Data Period | 2026 - 2031 |
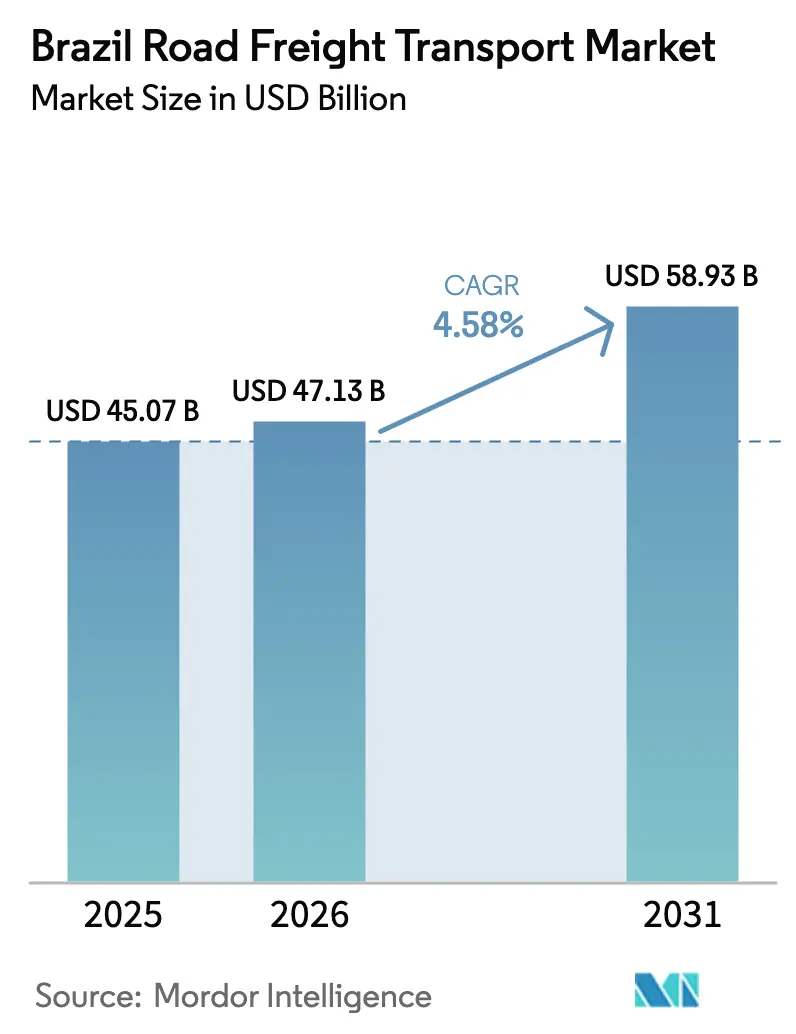
| Base Year Market Size (2025) | USD 45.07 Billion |
| Market Size (2026) | USD 47.13 Billion |
| Market Size (2031) | USD 58.93 Billion |
| Growth Rate (2026 - 2031) | 4.58% CAGR |
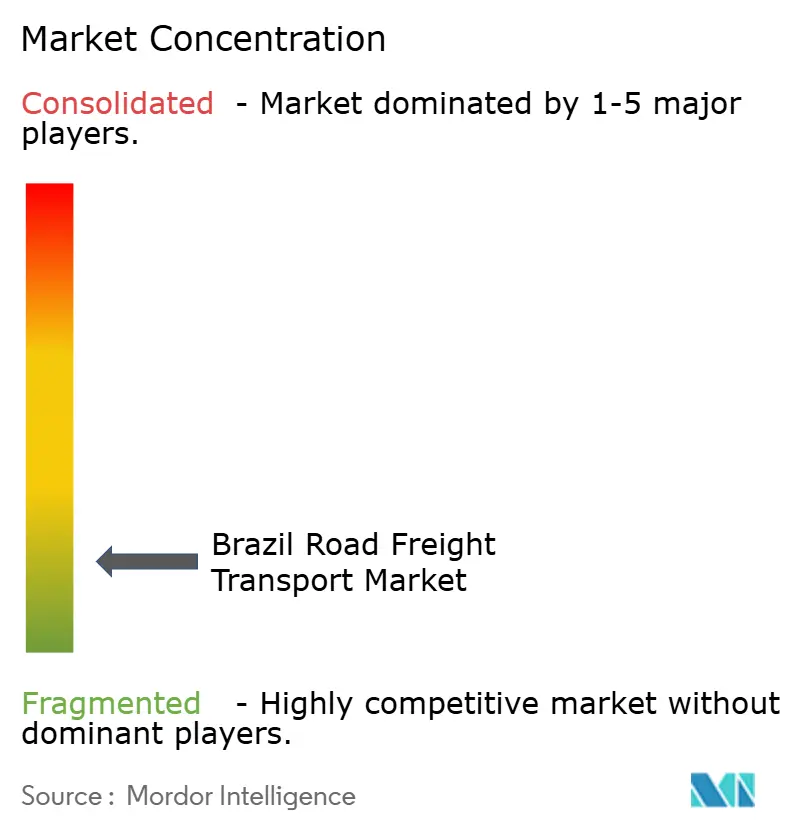
| Market Concentration | Low |
Major Players *Disclaimer: Major Players sorted in no particular order Image © Mordor Intelligence. Reuse requires attribution under CC BY 4.0. | |
Brazil Road Freight Transport Market Analysis by Mordor Intelligence
The Brazil road freight transport market size is expected to grow from USD 45.07 billion in 2025 to USD 47.13 billion in 2026 and is forecast to reach USD 58.93 billion by 2031 at 4.58% CAGR over 2026-2031. Current expansion is underpinned by federal highway investments, rising agricultural output, and a pronounced shift toward digitalized logistics platforms that improve load matching, route planning, and fleet productivity. Freight operators able to secure biofuel-compliant tanker capacity, optimize backhauls along grain corridors, and cultivate technology partnerships are positioned to tap the widest profit pools. Meanwhile, the Port of Santos modernization program, together with concession-backed toll roads, is already trimming average transit times and lowering vehicle wear, which enhances service reliability for shippers. Persistent driver shortages, volatile diesel prices, and the European Union’s impending Carbon Border Adjustment Mechanism (CBAM) push fleet owners to accelerate alternative-fuel adoption, data tracking, and cost-pass-through formulas. The Brazil road freight transport market further benefits from a steady uptick in same-day and next-day deliveries, which amplifies less-than-truckload (LTL) demand in Sao Paulo, Rio de Janeiro, and other major metropolitan areas. Finally, the convergence of public-sector capital expenditure and private concessionaires safeguards road quality on priority corridors, helping carriers mitigate the 82% share of routes that remain unpaved nationwide.
Key Report Takeaways
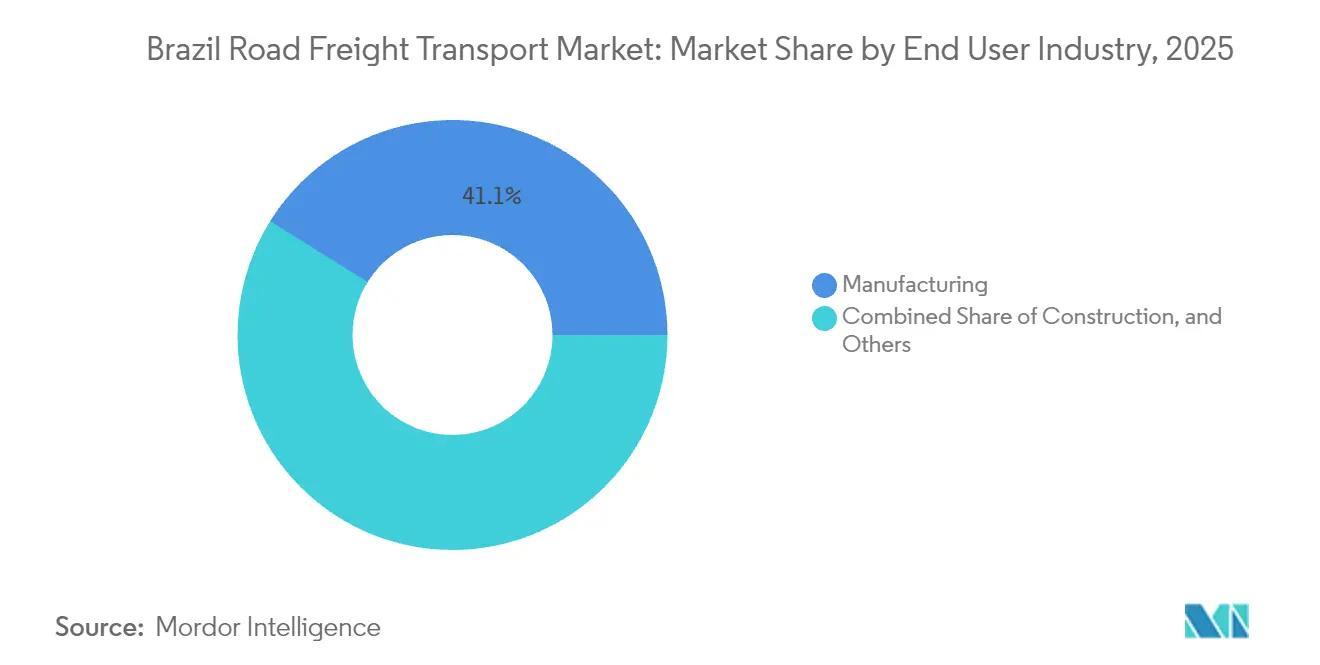
- By end user industry, manufacturing held 41.12% of the Brazil road freight transport market share in 2025; wholesale and retail trade is forecast to expand at a 5.26% CAGR between 2026-2031.
- By destination, domestic freight commanded 63.01% of the Brazil road freight transport market size in 2025, while international flows are advancing at a 5.34% CAGR between 2026 and 2031.
- By truckload specification, full-truck-load (FTL) operations led with 77.62% share of the 2025 revenues, yet LTL services are projected to grow at 5.12% CAGR between 2026-2031.
- By containerization, non-containerized cargo captured 87.28% of the revenue share in 2025; containerized freight is set to rise at a 4.68% CAGR between 2026-2031.
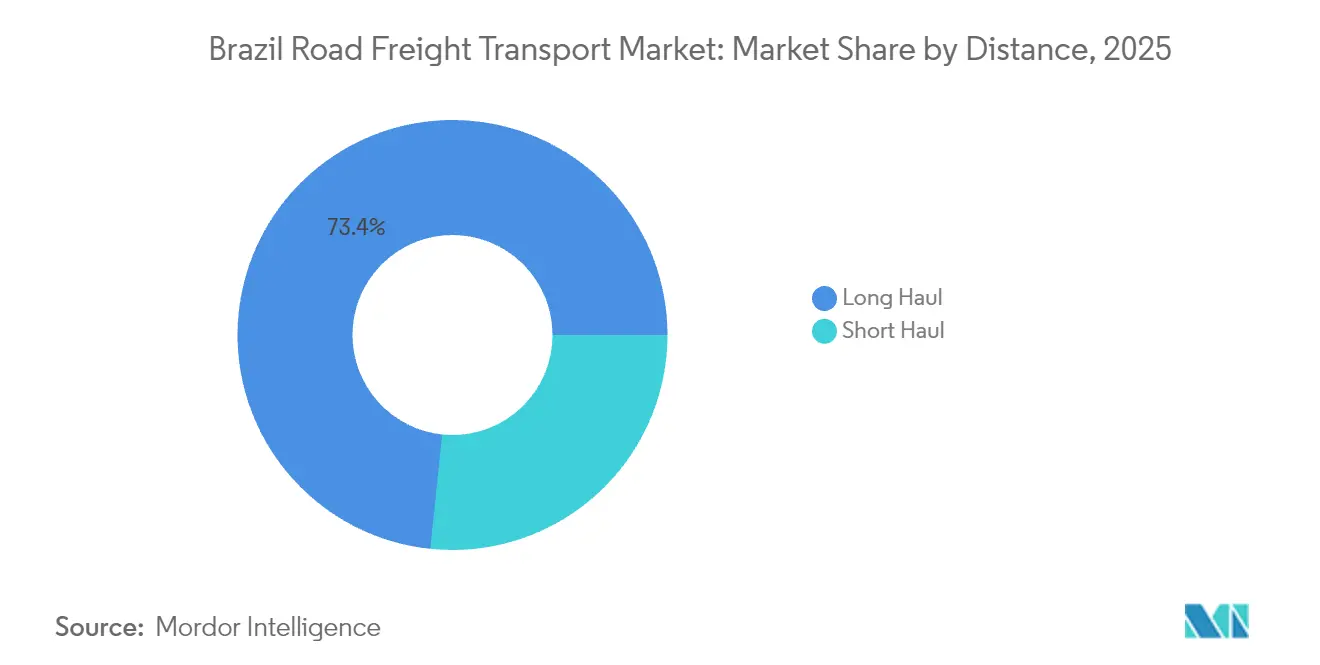
- By distance, long-haul routes accounted for 73.35% of the revenue share in 2025, whereas short-haul services are on track for a 4.95% CAGR between 2026-2031.
- By goods configuration, solid-cargo moves represented 70.62% share of the revenues in 2025; fluid-cargo demand is climbing at a 4.92% CAGR between 2026-2031.
- By temperature control, non-temperature-controlled freight dominated with 94.55% share of the revenues in 2025, but cold-chain volumes are expanding at 5.03% CAGR between 2026-2031.
Note: Market size and forecast figures in this report are generated using Mordor Intelligence’s proprietary estimation framework, updated with the latest available data and insights as of 2026.
Brazil Road Freight Transport Market Trends and Insights
Drivers Impact Analysis*
| Driver | (~) % Impact on CAGR Forecast | Geographic Relevance | Impact Timeline |
|---|---|---|---|
| E-commerce boom drives LTL demand | +0.8% | São Paulo, Rio de Janeiro, Belo Horizonte | Short term (≤ 2 years) |
| Federal highway CAPEX 2023-27 | +1.2% | Priority corridors São Paulo-Rio, Brasília-Goiânia | Medium term (2-4 years) |
| Expanding agro and manufacturing output | +0.9% | Centro-Oeste, Sul, Santos corridor | Medium term (2-4 years) |
| Biofuel supply-chain tanker surge | +0.4% | Ethanol-producing states | Long term (≥ 4 years) |
| Hybrid-flex / EV truck OPEX gains | +0.3% | Metropolitan hubs | Long term (≥ 4 years) |
| Port of Santos grain corridor JV | +0.6% | Centro-Oeste to Santos, Paranaguá routes | Medium term (2-4 years) |
| Source: Mordor Intelligence | |||
E-Commerce Boom Drives LTL Demand
Brazilian online retail continues its multi-year climb, spurring a rapid rise in parcel volumes that require consolidation, segregation, and time-definite final-mile services. Urban facilities in São Paulo and Rio de Janeiro already process sharply higher shipment counts than legacy hub-and-spoke depots, rewarding carriers that invest in cross-docks close to consumer clusters. International players have committed multi-billion-real capital to local distribution networks, accelerating technology adoption for dynamic routing and shipment visibility. Increased consumer expectations around same-day delivery encourage traditional FTL fleets to diversify into shared-capacity models. Early LTL adopters benefit from premium pricing tied to speed and reliability, while digital marketplaces help balance loads, reduce empty kilometers, and optimize warehouse slots[1]“Boletim Mensal de Biodiesel,” ANP, anp.gov.br .
Federal Highway CAPEX 2023-27
A USD 27 billion concession program now under execution targets 13 freight-dense corridors that carry 60% of national road cargo. Sections already handed over to private operators recorded a 15% drop in transit times within the first operational year as resurfacing, lane duplication, and automated toll collection took effect. Predictable pavement quality and continuous maintenance shrink vehicle repair bills and incident rates, especially for equipment hauling heavy agricultural produce. Toll financing assures long-term upkeep, countering the historic stop-start pattern of federal road budgets. Carriers anchored near upgraded corridors capture direct fuel savings and indirect gains from higher equipment availability[2]“Pesquisa CNT de Rodovias 2024,” CNT, cnt.org.br.
Expanding Agro and Manufacturing Output
Soybean acreage in MATOPIBA and double-cropped corn in Mato Grosso lift outbound bulk flows that already exceed 25 million tons annually. Complementary industrial production in automotive and machinery segments generates higher-value moves requiring tighter scheduling and specialized vehicles. Fertilizer backhauls to interior grain belts optimize fleet utilization, offsetting leg imbalances. Robust demand for refrigerated meats further enriches cargo mixes, allowing integrated logistics providers to cross-sell services and capture stickier shipper relationships. Consistent volumes enable operators to deploy larger, more fuel-efficient tractor-trailers and negotiate favorable rates for biofuel blends.
Biofuel Supply-Chain Tanker Surge
The federal mandate to lift biodiesel blending to B15 by 2025 drives an immediate need for stainless-steel and aluminum tankers built to handle higher viscosity fuels. Concentrated ethanol production in five central states pushes steady, high-density flows toward coastal blending terminals, generating predictable revenue streams for certified carriers. Corn-based ethanol facilities in Mato Grosso add millions of liters of daily transport demand, boosting equipment orders for single-compartment and multi-compartment tankers. Carriers that maintain rigorous cleaning and traceability protocols secure premium contracts, while those lacking specialty assets risk being relegated to lower-margin dry-cargo lanes.
Restraints Impact Analysis*
| Restraint | (~) % Impact on CAGR Forecast | Geographic Relevance | Impact Timeline |
|---|---|---|---|
| Volatile diesel price / ICMS tax shifts | -0.7% | All states, disparate ICMS rules | Short term (≤ 2 years) |
| 82% of road network unpaved | -1.1% | Rural Norte / Nordeste, interior farm belts | Long term (≥ 4 years) |
| Ageing driver pool and talent gap | -0.6% | Nationwide, acute on long hauls | Medium term (2-4 years) |
| EU-CBAM–linked compliance costs | -0.4% | Export-heavy corridors | Medium term (2-4 years) |
| Source: Mordor Intelligence | |||
Volatile diesel price / ICMS tax shifts
Fuel expenses make up 35-40% of long-haul operating costs, and yearly price swings of 15% compel carriers to levy surcharges, eroding rate transparency for shippers. Disparate state-level ICMS taxes create arbitrage where fleets register in low-tax jurisdictions but predominantly run high-tax lanes, skewing competition. A pending national tax reform aims to unify rates, yet uncertainty around implementation timelines complicates budgeting and hedging. Smaller operators have limited access to futures contracts, prompting them to maintain older, less fuel-efficient vehicles that heighten emissions and maintenance outlays[3]“Carbon Border Adjustments Could Reduce Emissions but at a Cost,” World Bank, worldbank.org Segment Analysis .
82% of Road Network Unpaved
The dominance of unsealed routes increases transit times by up to 30% and raises maintenance costs by 40% compared with paved corridors. Shippers willing to pay for reliability gravitate toward carriers that restrict fleets to concession roads, segmenting the Brazil road freight transport market by service tier. Agricultural shippers in the Norte and Nordeste absorb higher rates during harvest peaks when few operators accept the risk of dirt-road damage. Persistent under-investment outside concession corridors leaves secondary routes vulnerable to seasonal closures that strand equipment and disrupt inbound supply chains[4]“Indústria 2024,” IBGE, ibge.gov.br.
*Our forecasts treat driver/restraint impacts as directional, not additive. The impact forecasts reflect baseline growth, mix effects, and variable interactions.
Segment Analysis
By End User Industry: Manufacturing Volume Leadership Amid Accelerating Trade Flows
Manufacturing accounted for a 41.12% share of the Brazil road freight transport market size in 2025, anchored by automotive clusters in São Paulo and Rio Grande do Sul. Consistent component inflows and finished-vehicle dispatches underpin multi-stop routes that maximize trailer utilization. The segment’s growth benefits from near-shoring of machinery parts previously imported from Asia, which compresses lead times and drives just-in-time restocking needs. Plant expansions announced by global automakers through 2026 will strengthen demand for specialized out-of-gauge carriers and time-critical deliveries.
Wholesale and retail trade is projected to register the fastest 5.26% CAGR between 2026-2031, buoyed by rising middle-class consumption and proliferating urban fulfillment centers. Frequent, small-lot shipments push carriers to adopt pallet-wide vehicle bodies and lift-gate vans for curbside unloading. Retailers using inventory visibility systems now tender bids based on real-time capacity, shifting bargaining power toward agile fleets. Integration of reverse-logistics lanes for returns and refurbishment further differentiates service providers, driving higher revenue per loaded kilometer.


By Destination: Domestic Bulk Prevails as Export Lanes Quicken
Domestic movements held 63.01% of the Brazil road freight transport market share in 2025, a reflection of the country’s continental distances and consumption hubs clustered in the Southeast. Upgraded toll roads between Brasília and Goiânia have already trimmed door-to-door times by double digits, boosting carrier asset turns. Nationwide supermarket distribution networks favor milk-run routes that reduce dead-heading and balance urban and rural loads.
International freight is expected to climb at 5.34% CAGR between 2026-2031 as grain, meat, and manufactured goods move toward rapidly modernizing port complexes. Cross-border flows into Argentina and Paraguay also expand under streamlined Mercosur documentation. Multimodal corridors pairing truck and short-haul barge segments on the Paraná River deepen service portfolios for integrators equipped with customs-bonded tractor-trailers. Fleet owners able to synchronize export peak seasons with import backhauls take a revenue-per-truck lead over point-to-point competitors.
By Truckload Specification: Scale-Driven FTL Dominance With LTL Outperformance
FTL services retained 77.62% of the Brazil road freight transport market size in 2025 due to bulk commodities and large-volume industrial consignments. Modern tri-axle trailers hauling 48 metric-ton grain loads across Mato Grosso-to-Santos routes showcase the cost advantage of full-capacity dispatches. Digital weigh-station bypass programs cut idling and enforce axle-load compliance, bolstering carrier reputations among exporters.
LTL moves, growing 5.12% CAGR between 2026-2031, capitalize on parcel splintering in metropolitan areas and diversified factory outputs. Cloud-based transport-management systems cluster multiple shipper orders into a single vehicle run, lifting equipment utilization to levels that rival FTL profitability. Carriers operating both segments gain from mode shifting, assigning LTL boxes to FTL trailers for rural collection before de-consolidation at urban hubs.
By Containerization: Bulk’s Stronghold Meets Box-Led Export Modernization
Non-containerized cargo represented 87.28% share of the Brazil road freight transport market size in 2025, mirroring the dominance of grains, minerals, and construction materials that fill tipper bodies and flatbeds. Enhanced body durability and on-board weight sensors reduce overload fines and ensure compliance at concession tollgates.
Containerized freight, advancing at a 4.68% CAGR between 2026-2031, profits from terminal automation at Santos that cuts truck gate times and integrates vessel schedules. Inland container depots dotting São Paulo’s hinterland improve chassis turns and limit urban congestion. Automotive parts, white goods, and furniture increasingly ship in 40-foot high-cubes, enabling exporters to lock in door-to-door transit times and mitigate pilferage risks.
By Distance: Continental Long-Haul Scale Versus Urban Proximity Play
Long-haul routes captured 73.35% of the Brazil road freight transport market size in 2025, leveraging articulated truck configurations and sleeper cabins designed for three-day treks. Satellite-based collision-avoidance systems introduced in 2025 lower accident frequency and insurance premiums, directly lifting fleet margins.
Short-haul volumes, forecast to grow 4.95% CAGR between 2026-2031, revolve around intra-state replenishment loops and e-commerce micro-fulfillment runs. Medium-duty EV trucks tailored for 250 km daily cycles sidestep diesel price volatility and access city centers unrestricted by noise curfews. Carriers offering time-window guarantees secure contracts from pharmaceutical distributors requiring strict temperature compliance within urban clusters.
By Goods Configuration: Solid-Cargo Core Meets Fluid-Cargo Niche Expansion
Solid goods comprised 70.62% of total shipments in 2025, spanning pallets, bales, and bagged commodities. Automated tarpaulin systems on flatbeds now cut loading times and improve driver safety, raising truck revenue utilization. Rising domestic steel output stimulates dedicated coil-carrier demand, diversifying shipment profiles.
Fluid-cargo traffic, growing at a 4.92% CAGR between 2026-2031, depends on the biofuel blending trajectory and chemicals production uptick. Multi-compartment stainless tankers enable simultaneous deliveries of diesel, biodiesel, and gasoline, optimizing terminal turnarounds. Strict ANP certification regimes favor incumbents with established safety records, creating a competitive moat against new entrants.
By Temperature Control: Ambient Supremacy with Chilled-chain Acceleration
Non-temperature-controlled moves dominated 94.55% of total revenue in 2025 and benefit from standardized trailer pools that interchange across commodities. Adoption of low-rolling-resistance tires and aerodynamic skirts within this segment yields measurable fuel reductions on trunk roads.
Temperature-controlled freight, expanding 5.03% CAGR between 2026-2031, flourishes under increasing domestic consumption of frozen poultry and the export push for high-value pharmaceutical products. Two-zone reefer trailers facilitate simultaneous chilled and frozen loads, amplifying backhaul options. Telematics that transmit real-time temperature logs satisfy stringent good-distribution-practice mandates, positioning compliant carriers as shippers’ preferred partners.
Geography Analysis
The Brazil road freight transport market remains intrinsically domestic, with 63.01% of 2025 values circulating inside national borders. Federal concession corridors connecting the Centro-Oeste grain belt to the Southeast refinery cluster yield faster tractor-trailer cycles and reinforce carrier profitability. Harvest-season peaks spur spot-rate spikes that premium operators hedge via forward contracts with exporters. Urban consolidation centers around São Paulo absorb growing parcel flows, compelling fleets to invest in lift-gate rigid trucks and overnight warehousing to meet shorter delivery windows.
International freight, rising at a 5.34% CAGR between 2026-2031, rides on export-oriented agro-industrial growth and Mercosur’s incremental regulatory harmonization. The Bunge-Zen-Noh Terminal XXXIX upgrade at Santos expands berth capacity, easing truck bottlenecks and lowering dwell times by up to 18 hours. Enhanced container connectivity supports outbound machinery shipments to Asia, while northbound fertilizer imports balance backhauls. Digital customs submissions adopted in 2025 streamline border crossings with Argentina, cutting clearance times by 25%.
Nevertheless, remote interior states endure infrastructure deficits; heavy rains often close unpaved routes, isolating soy and corn farms and inflating trucking premiums. State-level incentives for fleet modernization, including discounted vehicle-property-tax rates, encourage carriers to deploy newer, more fuel-efficient tractors on those challenging lanes. Public-private investments in bridges and drainage along BR-163 illustrate how targeted projects can unlock latent capacity and diversify origin-destination pairs within the Brazil road freight transport market.
Competitive Landscape
The Brazil road freight transport market exhibits fragmentation, with the combined top five carriers controlling roughly 28% of sector revenue. Regional specialists leverage intimate lane knowledge and relationships with local shippers, while global integrators emphasize technology and multimodal breadth. JSL’s 2025 acquisition of 2,500 additional vehicles strengthens its hold over grain and urban distribution lanes, showcasing a scale-plus-specialization play. DHL’s cross-dock expansion in interior São Paulo boosts its e-commerce fulfillment network by 30%, positioning the firm to capture high-margin express volumes.
Technology serves as a key differentiator: telematics, predictive maintenance, and load-matching apps accelerate fleet turns and reduce empty kilometers. Digital freight platforms, once confined to spot markets, now negotiate multi-year contracts, cementing their role in capacity procurement for large retailers. In response, traditional carriers partner with software providers to bundle transport-management systems and real-time tracking dashboards into shipper offerings.
Strategic maneuvers also include vertical integration into warehousing, cold-storage nodes, and customs-brokerage services, driven by exporters’ demand for single-invoice logistics solutions. The 2024 agreement under which DSV absorbed DB Schenker unlocks broader access to North American and European networks for Brazilian shippers, aligning local over-the-road legs with global sea-freight and air-freight flows. Fleet electrification pilots remain limited to metropolitan deliveries due to sparse charging infrastructure, but early adopters capture marketing advantages and preferential contracts from sustainability-minded multinationals.
Brazil Road Freight Transport Industry Leaders
Expresso Nepomuceno
JSL SA
Rodonaves Group
VIX Logistics
DHL Group
- *Disclaimer: Major Players sorted in no particular order

Recent Industry Developments
- April 2025: DSV completed its acquisition of DB Schenker for EUR 14.3 billion (USD 16.62 billion), creating a 160,000-employee logistics platform expected to realize DKK 9 billion (USD 1.40 billion) in synergies by 2028.
- March 2025: A.P. Moller-Maersk and DP World deepened their collaboration at the Port of Santos, expanding container handling capacity and inland trucking connectivity.
- February 2025: JSL SA invested BRL450 million (USD 86.5 million) to add 2,500 trucks, focusing on grain haulage and São Paulo urban distribution.
- January 2025: DHL Group inaugurated new cross-docking sites in Campinas and Ribeirao Preto, enlarging its Brazilian trucking network capacity by 30%.


Brazil Road Freight Transport Market Report Scope
Agriculture, Fishing, and Forestry, Construction, Manufacturing, Oil and Gas, Mining and Quarrying, Wholesale and Retail Trade, Others are covered as segments by End User Industry. Domestic, International are covered as segments by Destination. Full-Truck-Load (FTL), Less than-Truck-Load (LTL) are covered as segments by Truckload Specification. Containerized, Non-Containerized are covered as segments by Containerization. Long Haul, Short Haul are covered as segments by Distance. Fluid Goods, Solid Goods are covered as segments by Goods Configuration. Non-Temperature Controlled, Temperature Controlled are covered as segments by Temperature Control.End User Industry
| Agriculture, Fishing, and Forestry |
| Construction |
| Manufacturing |
| Oil and Gas, Mining and Quarrying |
| Wholesale and Retail Trade |
| Others |
Destination
| Domestic |
| International |
Truckload Specification
| Full-Truck-Load (FTL) |
| Less than-Truck-Load (LTL) |
Containerization
| Containerized |
| Non-Containerized |
Distance
| Long Haul |
| Short Haul |
Goods Configuration
| Fluid Goods |
| Solid Goods |
Temperature Control
| Non-Temperature Controlled |
| Temperature Controlled |
| End User Industry | Agriculture, Fishing, and Forestry |
| Construction | |
| Manufacturing | |
| Oil and Gas, Mining and Quarrying | |
| Wholesale and Retail Trade | |
| Others | |
| Destination | Domestic |
| International | |
| Truckload Specification | Full-Truck-Load (FTL) |
| Less than-Truck-Load (LTL) | |
| Containerization | Containerized |
| Non-Containerized | |
| Distance | Long Haul |
| Short Haul | |
| Goods Configuration | Fluid Goods |
| Solid Goods | |
| Temperature Control | Non-Temperature Controlled |
| Temperature Controlled |


Market Definition
- Agriculture, Fishing, and Forestry (AFF) - This end user industry segment captures the external (outsourced) logistics expenditure incurred by the AFF industry players on road freight transport service. The end user players considered are the establishments primarily engaged in growing crops, raising animals, harvesting timber, harvesting fish & other animals from their natural habitats and providing related support activities. Herein, across the value chain, Logistics Service Providers (LSPs) play a crucial role in acquisition, storage, handling, transportation, and distribution activities for the optimal & continuous flow of inputs (seeds, pesticides, fertilizers, equipment, and water) from manufacturers or suppliers to the producers and smooth flow of output (produce, agro-goods) to distributors/ consumers. This includes both termperature controlled and non-temperature controlled logistics, as and when required according to the shelf life of goods being transported or stored.
- Construction - This end user industry segment captures the external (outsourced) logistics expenditure incurred by the construction industry players, on road freight transport service. The end user players considered are the establishments primarily engaged in constructing, repairing and renovating residential & commercial buildings, infrastructure, engineering works, subdividing and developing land. Logistics Service Providers (LSPs) play a crucial role in increasing profitability of construction projects by maintaing the inventory of raw materials & equipment, time-critical supplies and by providing other value added services for effective project management.
- Containerized Road Freight Transport - The segment captures the external (outsourced) logistics expenditure incurred by the road freight transport service end users on Full-Truck-Load (FTL) services. FTL road freight transport is characterized as a full single load not combined with other shipments. It comprises of shipments (i) devoted to the goods of a single shipper (ii) taken directly from a point of origin to one or more destination points (iii) comprising of bulk mail truck transportation (iv) comprising of both Container (Full Container Load, FCL)/Non-Container trucking services (v)comprsing of goods requiring temperature controlled or non-temperature controlled transportation services (vi) comprising of bulk liquid tankering (vii) invoving trucking of waste (viii) hazardous material trucking. Related value added services (VAS) of sorting, consolidation, deconslidation are included in the other services segment of freight and logistics market.
- Export Trends and Import Trends - Overall logistics performance of an economy is positively and significantly (statistically) correlated to its trade performance (exports and imports). Hence, in this industry trend, total value of trade, major commodities/ commodity groups and the major trade partners, for the studied geography (country or region as per the scope of report) have been analysed alongside the impact of major trade/logistics infrastructure investments & regulatory environment.
- Fluid Goods - The segment captures the external (outsourced) logistics expenditure incurred by the road freight transport service end users for the transport of bulk liquids, that are often used in extraction, manufacturing, food processing, agriculture industries among others. It includes transportation of liquids like (i) Chemicals/ hazardous goods (for instance acids) (ii) Water (potable as well as waste) (iii) Oil and gas (upstream as well as downstream like gasoline, fuel, crude oil, or propane), (iv) Food grade bulk liquids (like milk, or juice), (v) Rubber, (vi) Agrichemical products, among others. These goods are generally transported through tanker trucking.
- Fuel Price - Fuel price spikes can cause delays and diruption for logistics service providers (LSPs), while drops in the same can result in higher short-term profitability and increased market rivalry to offer consumers with the best deals. Hence, the fuel price variations have been studied over the review period and presented along with the causes as well as market impacts.
- Full-Truck-Load (FTL) Road Freight Transport - The segment captures the external (outsourced) logistics expenditure incurred by the road freight transport service end users on Full-Truck-Load (FTL) services. FTL road freight transport is characterized as a full single load not combined with other shipments. It comprises of shipments (i) devoted to the goods of a single shipper (ii) taken directly from a point of origin to one or more destination points (iii) comprising of bulk mail truck transportation (iv) comprising of both Container (Full Container Load, FCL)/Non-Container trucking services (v)comprsing of goods requiring temperature controlled or non-temperature controlled transportation services (vi) comprising of bulk liquid tankering (vii) invoving trucking of waste (viii) hazardous material trucking. Related value added services (VAS) of sorting, consolidation, deconslidation are included in the other services segment of freight and logistics market.
- GDP Distribution by Economic Activity - Nominal Gross Domestic Product and distribution of the same, across major economic sectors in the geography studied (country or region as per scope of the report) have been studied and presented in this industry trend. As GDP is positively related to the profitability and growth of logistics industry, this data has been used in adjunction to the input-output tables/ supply-use tables for analyzing the potential major contributing sectors towards the logistics demand.
- GDP Growth by Economic Activity - Growth of Nominal Gross Domestic Product across major economic sectors, for the geography studied (country or region as per scope of the report) have been presented in this industry trend. This data has been utilized for assessing the growth of logistics demand from all the market end users (economic sectors considered here).
- Inflation - Variations in both Wholesale Price Inflation (YoY change in producer price index) and Consumer Price Inflation have been presented in this industry trend. This data has been used to assess the inflationary environment as it plays a vital role in smooth functioning of the supply chain, directly impacting the logistics operational cost components e.g., pricing of tyres, driver wages & benefits, energy/fuel prices, maintenace costs, toll charges, warehousing rents, custom brokerage, forwarding rates, courier rates etc. hence impacting the overall freight and logistics market.
- Key Industry Trends - The report section named "Key Industry Trends" include all the key variables/parameters studied to better analyze the market size estimates and forecasts. All the trends have been presented in the form of data points (time series or latest available data points) along with analysis of the paramter in the form of concise market relevant commentary, for the geography studied (country or region as per the scope of report).
- Key Strategic Moves - The action taken by a company to differentiate from its competitor or used as a general strategy is referred to as a key strategic move (KSM). This includes (1) Agreements (2) Expansions (3) Financial Restructuring (4) Mergers and Acquisitions (5) Partnerships, and (6) Product Innovations. Key players (Logistics Service Providers, LSPs) in the market have been shortlisted, their KSM have been studied and presented in this section.
- Less than-Truck-Load (LTL) Road Freight Transport - The segment captures the external (outsourced) logistics expenditure incurred by the road freight transport service end users on Less than-Truck-Load (LTL) services. LTL road freight transport is characterized as multiple shipments combined onto a single truck for multiple deliveries within a network. It comprises of establishments (i) primarily engaged in general and specialized freight trucking of less than complete truck-loads, (ii) characterized by the use of terminals to consolidate shipments, generally from several shippers, into a single truck for haulage between a load assembly terminal and a disassembly terminal, where the load is sorted and shipments are re-routed for delivery (iv) Less than-Container-Load (LCL) shipping/ Groupage Shipping in case of trucking services. The activities in scope include (i) local pick-up, (ii) line-haul, and (iii) local delivery. Related value added services (VAS) of sorting, consolidation, deconslidation are included in the other services segment of freight and logistics market.
- Logistics Performance - Logistics Performance and Logistics Costs are the backbone of trade, and influences trade costs, making countries compete globally. Logistics performance is influenced by market wide adopted supply chain management strategies, government services, investments & policies, fuel/ energy costs, inflationary environment etc. Hence, in this industry trend, the logistics performance of the geography studied (country/ region as per the scope of report) has been analysed and presented over the review period.
- Major Truck Suppliers - Market share of truck brands is influenced by factors like geographical preferences, portfolio of truck types, truck prices, local production, truck repair & maintenance service peneteration, customer support, technological innovations (like electric vehicles, digitalization, autonomous trucks), fuel efficiency, financing options, annual maintenance costs, availability of substitutes, marketing startegies etc. Hence, the distribution (share % for base year of the study) of truck sales volume for leading truck brands and commentary on current market scenario & market anticipation over the forecast period have been presented in this industry trend.
- Manufacturing - This end user industry segment captures the external (outsourced) logistics expenditure incurred by the Manufacturing industry players, on road freight transport service. The end user players considered are the establishments primarily engaged in the chemical, mechanical or physical transformation of materials or substances into new products. Logistics Service Providers (LSPs) play a crucial role in maintaining a smooth flow of raw materials across the supply chain, enabling timely delivery of finished goods to distributors or end customers and storing & supplying the raw materials to clients for just-in-time manufacturing.
- Modal Share - Freight Modal Share is influenced by factors like modal productivity, government regulations, containerization, distance of shipment, temperature control requirements, type of goods, international trade, terrain, speed of delivery, shipment weight, bulk shipments, etc. Also, modal share by tonnage (tons) and modal share by freight turnover (ton-km) differ as per average distance of shipments, weight of major commodity groups transported in the economy and number of trips. This industry trend represents the distribution of freight transported by mode of transport (tons as well as ton-km), for the study base year.
- Oil and Gas, Mining and Quarrying - This end user industry segment captures the external (outsourced) logistics expenditure incurred by the extraction industry players, on road freight transport service. The end user players considered are the establishments that extract naturally occurring mineral solids, such as coal and ores; liquid minerals, such as crude petroleum; and gases, such as natural gas. Logistics Service Providers (LSPs) covers entire phases from upstream to downstream and plays a crucial role in the transportation of machinery, drilling equipments, extracted minerals, crude oil & natural gas and refined/ processed products from one place to another.
- Other End Users - Other end user segment captures the external (outsourced) logistics expenditure incurred by the financial services (BFSI), real estate, educational services, healthcare, and professional services (administrative, waste management, legal, architectural, engineering, design, consulting, scientific R&D), on road freight transport service. Logistics Service Providers (LSPs) plays a crucial role in the reliable movement of supplies and documents to/from these industries such as transporting any equipment or resources required, shipping confidential documents and files, movement of medical goods & supplies (surgical supplies and instruments, including gloves, masks, syringes, equipment) to name a few.
- Producer Price Inflation - It indicates inflation from viewpoint of the producers viz. the average selling price received for their output over a period of time. Annual change (YoY) of producer price index is reported as wholesale price inflation in the "Inflation" industry trend. As WPI captures dynamic price movements in most comprehensive way, it is widely used by governments, banks, industry, business circles and is deemed important in formulation of trade, fiscal and other economic policies. The data has been used in adjunction to consumer price inflation for better understanding the inflationary environment.
- Road Freight Pricing Trends - Freight pricing by mode of transport (USD/tonkm), over the review period, has been presented in this industry trend. The data has been used in assessing the inflationary environment, impact on trade, freight turnover (tonkm), road freight transport market demand and hence the road freight transport market size.
- Road Freight Tonnage Trends - Freight tonnage (weight of goods in tons) handled by mode of transport, over the review period, has been presented in this industry trend. The data has been used as one of the parameters apart from average distance per shipment (km), freight volume (tonkm), and freight pricing (USD/tonkm) to assess the freight transport market size.
- Road Freight Transport - Hiring a road freight transport logistics service provider (LSP) or haulier (outsourced logistics), for the transport of commodities constitutes road freight transport market. The scope of study includes (i) road transport of goods reported by hauliers registered in the reporting countries (ii) transport of raw materials or manufactured goods (solids as well as fluids) (iii) transport using commerical motor vehicles (rigid trucks or tractor-trailers, (iv) Full-Truck-Load (FTL) or Less than-Truck-Load (LTL) transport (v) containerized or non-containerized transport (vi) temperature controlled or non-temperature controlled trasnport, (vii) short haul or long haul (Over-the-road, OTR) transport, (viii) used office or household goods transport (movers and packers), (ix) other specialized cargo transport (dangerous goods, oversized cargo) and (x) outsourced first mile/ middle mile/last mile delivery shipments undertaken by road freight transport players. The scope does not include (i) transport undertaken by hauliers registered in other countries (ii) last mile meal delivery market (iii) grocery delivery market (iv) transportation via road network undertaken/ reported by Courier, Express, and Parcel (CEP) players.
- Road Length - As infrastructure plays a vital role in an economy's logistics performance, variables like length of roads, distribution of road length by surface category (paved v/s unpaved), distribution of road length by road classification (expressways v/s highways v/s other roads), have been analysed and presented in this industry trend.
- Segmental Revenue - Segmental Revenue has been triangulated or computed and presented for all the major players in the market. It refers to the road freight transport market specific revenue earned by the company, over the base year of study, in the geography studied (country or region as per the scope of report). It is computed through the study and analysis of major parameters like financials, service portfolio, employee strength, fleet size, investments, number of countries present in, major economies of concern, etc. that have been reported by the company in its annual reports, webpage. For companies having scarce financial disclosures, paid databases like D&B Hoovers, Dow Jones Factiva have been resorted to and verified through industry/expert interactions.
- Short Haul Road Freight Transport - The segment captures the external (outsourced) logistics expenditure incurred by the road freight transport service end users on local trucking (less than 100 miles). It includes the road transport of goods (i) within a single administrative area and its hinterland, (ii) by smaller trucks and pickup trucks (iii) via containerized as well as dry bulk services (iv) intermodal from ports, container terminals or airports, and (v) outsourced first mile/ last mile delivery shipments undertaken by road freight transport players.
- Transport and Storage Sector GDP - Value and growth of Transport and Storage Sector GDP has a direct relation to the freight and logistics market size, and hence road freight transport market size. Therefore, this variable has been studied and presented over the review period, in value terms (USD) and as share % of total GDP, in this industry trend. The data has been supported by concise and relevant commentary around the investments, developments, and current market scenario.
- Trends in E-Commerce Industry - Enhanced internet connectivity and boom in smartphone penetration, coupled with increasing disposable incomes, has led to a phenomenal growth in the e-commerce market globally. Online shoppers require fast and efficient delivery of their orders leading to an increase in the demand for logistics services especially e-commerce fulfilment services. Hence, the Gross Merchandise Value (GMV), historial and projected growth, breakup of major commodity groups in e-commerce industry for the studied geography (country or region as per scope of the report) have been analysed and presented in this industry trend.
- Trends in Manufacturing Industry - Manufacturing industry involves the transformation of raw materials into finished products, while logistics industry ensures the efficient flow of raw materials to the factory, and the transport of manufactured products to the distributors & consumers. Demand-Supply of both industries are highly cross-linked and critical for a seamless supply chain. Hence, the Gross Value Added (GVA), breakup of GVA into major manufacturing sectors, and growth of manufacturing industry over the review period have been analysed and presented, in this industry trend.
- Trucking Fleet Size By Type - Market share of truck types is influenced by factors like geographical preferences, major end user industries, truck prices, local production, truck repair & maintenance service peneteration, customer support, technological disruptions (like electric vehicles, digitalization, autonomous trucks) etc. Hence, the distribution (share % for base year of study) of truck parc volume by type of truck, market disruptors, truck manufacturing investments, truck specifications, truck use & import regulations, and market anticipation over the forecast period have been presented in this industry trend.
- Trucking Operational Costs - The prime reasons for measuring/ benchmarking logistics performance of any trucking company are to reduce operational costs and increase profitability. On the other hand, measuring operational costs helps to identify whether and where to make operational changes to control expenses and identify areas for improved performance. Hence, in this industry trend, trucking operational costs and the variables involved viz. driver wages & benefits, fuel prices, repairs & maintenance costs, tyre costs etc. have been studied over the base year of study, and presented for the geography studied (country or region as per the scope of report).
- Wholesale and Retail Trade - This end user industry segment captures the external (outsourced) logistics expenditure incurred by the wholesalers and retailers, on road freight transport service. The end user players considered are the establishments primarily engaged in wholesaling or retailing merchandise, generally without transformation, and rendering services incidental to the sale of merchandise. Logistics Service Providers (LSPs) plays a crucial role in the reliable movement of supplies to and finished products from production houses to the distributors and finally to the end customer covering activites like material sourcing, transportation, order fulfillment, warehousing & storage, demand forecasting, inventory management etc.
| Keyword | Definition |
|---|---|
| Cabotage | Road transport by a motor vehicle registered in a country performed on the national territory of another country. |
| Cross Docking | Cross docking is a logistics procedure where products from a supplier or manufacturing plant are distributed directly to a customer or retail chain with marginal to no handling or storage time. Cross docking takes place in a distribution docking terminal; usually consisting of trucks and dock doors on two (inbound and outbound) sides with minimal storage space. The name ‘cross docking’ explains the process of receiving products through an inbound dock and then transferring them across the dock to the outbound transportation dock. |
| Cross Trade | International road transport between two different countries performed by a road motor vehicle registered in a third country. A third country is a country other than the country of loading/embarkation and than the country of unloading/disembarkation. |
| Dangerous Goods | The classes of dangerous goods carried by Road are those defined by the fifteenth revised edition of the UN Recommendations on the Transport of Dangerous Goods, United Nations, Geneva 2007. They include Class 1: Explosives; Class 2: Gases; Class 3: Flammable Liquids; Class 4: Flammable solids- substances liable to spontaneous combustion; substances which, on contact with water, emit flammable gases; Class 5: Oxidizing substances and organic peroxides; Class 6: Toxic and infectious substances; Class 7: Radioactive material and Class 8: Corrosive substances, Class 9: Miscellaneous dangerous substances and articles. |
| Direct Shipment | Direct shipment is a method of delivering goods from the supplier or the product owner to the customer directly. In most cases, the customer orders the goods from the product owner. This delivery scheme reduces transportation and storage costs, but requires additional planning and administration. |
| Drayage | A drayage is a form of trucking service that connects the different modes of shipping (intermodal), such as ocean freight or air freight. It’s a short-haul trip that transports goods from one place to another, usually before or after its long-haul shipping process. Drayage trucks move cargo to and from various destinations, such as container ships, storage lots, order fulfillment warehouses, and rail yards. Typically, drayage only transports goods in short distances and operates only in one metropolitan area. It also requires only one trucker in a single shift. But despite this, but it plays an important role in long-haul shipping because it gets the goods to the cargo and vice versa. It makes intermodal transport much more efficient and enables the seamless transfer of goods to the end customer. |
| Dry van | A dry van is a type of semi-trailer that's fully enclosed to protect shipments from outside elements. Designed to carry palletized, boxed or loose freight, dry vans aren't temperature-controlled (unlike refrigerated “reefer” units) and can't carry oversized shipments (unlike flatbed trailers). |
| Final Demand | Final demand includes all types of commodities (goods as well as services) consumed as final use and might include personal consumption, or consumption by government, by businesses as capital investment, and as exports. includes all types of commodities (goods as well as services) consumed as final use and might include personal consumption, or consumption by government, by businesses as capital investment, and as exports. |
| Flatbed Truck | A flatbed truck is a type of truck with rigid design. It has a back body that is flatly shaped for easy loading and unloading of goods. The flatbed truck is mostly used to transport heavy, oversized, wide and indelicate goods such as machinery, building supplies or equipment. Due to the truck open body, the goods transported with it must not be vulnerable to rain. By functionality, the flatbed truck is comparable to a flatbed trailer. |
| Inbound Logistics | Inbound logistics is the way materials and other goods are brought into a company. This process includes the steps to order, receive, store, transport and manage incoming supplies. Inbound logistics focuses on the supply part of the supply-demand equation. |
| Intermediate Demand | Intermediate demand includes goods, services, and maintenance and repair construction sold to businesses, excluding capital investment. |
| International Loaded | Place of loading of goods in reporting country (i.e., country in which the vehicle performing the transport is registered) and place of unloading in a different country. |
| International Unloaded | Place of unloading of goods in reporting country (i.e., country in which the vehicle performing the transport is registered) and place of loading in a different country. |
| OOG cargo | Out of Gauge (OOG) cargo is any cargo that can not be loaded into six-sided shipping containers simply because it is too large. The term is a very loose classification of all cargo with dimensions beyond the maximum 40HC container dimensions. That is a length beyond 12.05 meters – a width beyond 2.33 meters – or a height beyond 2.59 meters. |
| Pallets | Raised platform, intended to facilitate the lifting and stacking of goods. |
| Part load | A part load describes goods which only fills a truck partially. In essence, the quantity of the shipment is bigger than the Less Than Truckload (LTL) shipment. Also, the shipment cannot fully occupy a truck i.e. its capacity is much lower than a Full Truckload (FTL) shipment. |
| Paved Road | Road surfaced with crushed stone (macadam) with hydrocarbon binder or bituminized agents, with concrete or with cobblestone. |
| Reverse Logistics | Reverse logistics comprises of the sector of supply chains that process anything returning inwards through the supply chain or traveling ‘backward’ through the supply chain. |
| Road Freight Transport Service | Hiring a trucking agency for transport of commodities (raw materials or manufactured goods including both solids and liquids) form the origin to a destination within the country (domestic) or cross-border (international) constitutes road freight transport market. The service might be Full-Truck-Load or Less than-Truck-Load, containerized or non-containerized, temperature controlled or non temperature controlled, short haul or long haul. |
| Tautliner vehicle | Tautliner and curtainsider are used as generic names for curtain sided trucks/trailers. The curtains are permanently fixed to a runner at the top and detachable rails/poles at front and rear, allowing the curtains to be drawn open and forklifts used all along the sides for easy and efficient loading and unloading. When closed for travel, vertical load restraint straps are attached to a rope rail beneath the truck bed, connecting the truck bed and curtain along both sides. Winches at either end of the curtain tension it, hence the 'Tautliner' name. This stops the curtain from flapping or drumming in the wind and can also help retain light loads from slipping sideways. |
| Transport for hire or reward | The carriage for remuneration of goods. |
| Unpaved Road | Road with a stabilized base not surfaced with crushed stone, hydrocarbon binder or bituminized agents, concrete or cobblestone. |


Research Methodology
Mordor Intelligence follows a four-step methodology in all our reports.
- Step-1: Identify Key Variables: In order to build a robust forecasting methodology, the variables and factors identified in Step-1 are tested against available historical market numbers. Through an iterative process, the variables required for market forecast are set and the model is built on the basis of these variables.
- Step-2: Build a Market Model: Market-size estimations for the forecast years are in nominal terms. Inflation is considered to be a part of the pricing, and the average selling price (ASP) is varying throughout the forecast period for each country
- Step-3: Validate and Finalize: In this important step, all market numbers, variables and analyst calls are validated through an extensive network of primary research experts from the market studied. The respondents are selected across levels and functions to generate a holistic picture of the market studied.
- Step-4: Research Outputs: Syndicated Reports, Custom Consulting Assignments, Databases & Subscription Platforms


