Brazil Rice Market Analysis by Mordor Intelligence
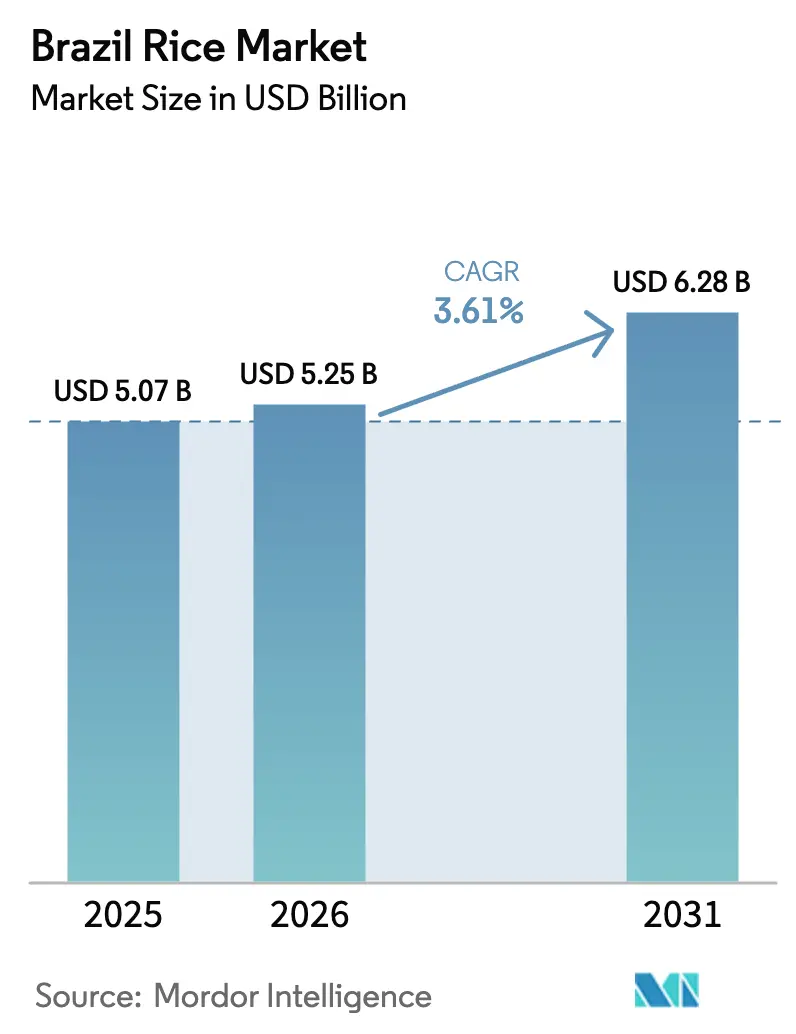
The Brazil rice market size was valued at USD 5.07 billion in 2025 and estimated to grow from USD 5.25 billion in 2026 to reach USD 6.28 billion by 2031, at a CAGR of 3.61% during the forecast period (2026-2031). Rice cultivation in Brazil is concentrated in the southern states, with Rio Grande do Sul producing 70% of the total output. This high production results from advanced farming methods, suitable climate conditions, and extensive irrigation systems that maintain consistent yields. Brazil is the largest consumer of milled rice in South America and the Caribbean, reflecting the grain's significance in the country's diet and food culture. The Brazil rice market is expanding into premium export markets by utilizing Non-GMO certification and improved tariff-free access to Mexico and Central America. The adoption of precision agriculture, genomic breeding, and blockchain traceability systems enables producers and processors to increase their market value.
Key Report Takeaways
- Brazil is one of the largest rice producers in South America, accounting for 41.62% of the region's total rice production.
Note: Market size and forecast figures in this report are generated using Mordor Intelligence’s proprietary estimation framework, updated with the latest available data and insights as of 2026.
Brazil Rice Market Trends and Insights
Drivers Impact Analysis*
| Driver | (~) % Impact on CAGR Forecast | Geographic Relevance | Impact Timeline |
|---|---|---|---|
| Favorable Climate and Land Availability | 1.00% | South (Rio Grande do Sul, Santa Catarina), Midwest (Mato Grosso, Tocantins) | Long term (≥ 4 years) |
| Government Support and Favourable Policies | 0.80% | National, with emphasis on small and medium producers | Medium term (2-4 years) |
| Growing Global Demand for Non-GMO Long-Grain Rice | 0.70% | Export-oriented regions, primarily South | Medium term (2-4 years) |
| Strong Staple Food Demand Maintains Domestic Off-Take | 0.40% | National, particularly Northeast and Southeast | Short term (≤ 2 years) |
| Digital Grain-Origination Platforms | 0.50% | National, with higher adoption in Center-West and South | Short term (≤ 2 years) |
| Expansion of New Rail Corridors | 0.60% | Midwest (Mato Grosso, Tocantins, Goiás) to Northern Arc ports | Long term (≥ 4 years) |
| Source: Mordor Intelligence | |||
Favorable Climate and Land Availability
Brazil's diverse climate zones and abundant surface water resources maintain the competitiveness of its irrigated rice production. The 2024 update to the Agricultural Climate Risk Zoning (ZARC) indicates an 80% success rate for irrigated rice planting in Tocantins between October 1st and November 20th, based on climate conditions. Remote-sensing platforms accurately map irrigated fields across six biomes with over 80% precision, enabling farmers to optimize planting schedules and water management.[1]"Mapping Irrigated Rice in Brazil Using Sentinel-2 Spectral–Temporal Metrics and Random Forest Algorithm", mdpi.com This integration of climate data and technology enhances the resilience of Brazil's rice market against weather-related disruptions while expanding production capabilities.
Government Support and Favorable Policies
The Brazilian government is implementing measures to enhance domestic rice production. In 2024, Brazil introduced the "Rice for the People" program, which aims to increase rice production by 500,000 metric tons in the succeeding year through government-backed option contracts. These contracts provide farmers with guaranteed purchase prices, encouraging small and medium-sized producers to expand their cultivation areas. The program, supported by BRL 1 billion (USD 178 million), addresses losses from recent droughts and floods while enhancing food security. Brazilian scientists are also developing sustainable irrigation techniques to reduce methane emissions in rice farming. Research conducted by USP's School of Agriculture and Embrapa demonstrates that intermittent irrigation can reduce emissions by up to 80%, enhancing environmental sustainability while maintaining crop yields.
Growing Global Demand for Non-GMO Long-Grain Rice
The growing consumer demand for Non-GMO staples is influencing global export patterns. Brazil's strict Non-GMO policies, supported by major mills like Camil Alimentos and Josapar, have created premium market opportunities following GMO contamination issues that affected U.S. exports. A 2023 trade agreement between Brazil and Kenya strengthened rice trade (including Non-GMO long-grain rice) and agricultural collaboration, enabling Kenya to import directly from Brazilian producers and reduce its dependence on Asian suppliers. Additionally, U.S. agricultural import tariffs in 2025 are likely to increase Brazilian rice exports to Mexico. The Mexican government's 2025 Anti-Inflation Decree, which extends duty-free access for certain agricultural products, creates opportunities for Non-FTA partners such as Brazil.
Strong Staple Food Demand Maintains Domestic Off-Take
Rice maintains a presence in 95% of Brazilian households, ensuring consistent baseline consumption. Government initiatives to combat hunger, including the Food-on-the-Plate Plan, strengthen demand through public procurement. Brazil supplements its domestic supply through rice imports, with Mercosur countries serving as primary suppliers. Paraguay, Uruguay, and Argentina, benefiting from tax-free status and favorable market access, collectively supplied 70% of Brazil's rice imports in 2023, according to the Secretariat of Foreign Trade (SECEX) data.[2]USDA Grain and Feed Annual Report
Restraints Impact Analysis*
| Restraint | (~) % Impact on CAGR Forecast | Geographic Relevance | Impact Timeline | |
|---|---|---|---|---|
| Escalating Fertilizer and Fuel Input Costs | -0.40% | National, with higher impact in newer production regions | Medium term (2-4 years) | |
| Competition from Other Exporting Countries | -0.30% | Export markets, particularly Mexico and Central America | Medium term (2-4 years) | |
| Extreme-weather Volatility | -0.50% | South (Rio Grande do Sul), with spillover effects nationally | Short term (≤ 2 years) | |
| Rural Labour Scarcity and Rising Wages | -0.30% | National, with acute impact in traditional production regions | Medium term (2-4 years) | |
| Source: Mordor Intelligence | ||||
Escalating Fertilizer and Fuel Input Costs
Brazil's dependence on fertilizer imports, which account for 77% of the total supply, makes agricultural producers vulnerable to global price fluctuations. Logistics costs constitute over 21% of processors' revenue. The depreciation of the Brazilian Real increases landed costs, reducing profit margins despite recent decreases in spot prices. In response, producers are implementing precision fertilizer application methods and integrated pest management practices to reduce input requirements and enhance operational resilience, even as short-term profits decrease.
Competition from Other Exporting Countries
Brazil's rice market faces constraints from major global exporters like Thailand, Vietnam, India, and the United States, which control international trade through lower production costs and established export networks. Asian exporters maintain competitive prices through government subsidies, modern milling facilities, and efficient logistics infrastructure. Brazil's domestic market also experiences competition from regional suppliers, including Paraguay, Argentina, and Uruguay. The country's dependence on irrigated rice cultivation increases production costs compared to rainfed rice farming in Africa and Southeast Asia. These competitive pressures have led Brazilian producers to focus on premium rice varieties, sustainability certifications, and specialized market segments to distinguish their exports.
*Our forecasts treat driver/restraint impacts as directional, not additive. The impact forecasts reflect baseline growth, mix effects, and variable interactions.
Geography Analysis
The State of Rio Grande do Sul serves as Brazil's primary rice-producing region. The state maintains an established rice industry that generates substantial agricultural waste from processing operations. In line with Brazil's increased focus on sustainability, farms in this region have adopted no-tillage practices in flooded paddies, which improve soil structure, enhance microbial activity, and reduce methane emissions. According to the USDA, irrigated rice accounts for 91.35% of the total rice in the country, and rainfed rice accounts for 8.65% of the total rice production.
The Midwest region provides strategic production diversification. In Lagoa da Confusão, Tocantins, optimized supply chains have enhanced grain classification, reduced spoilage, and decreased drying costs, improving farmer cash flow. Agricultural Climate Risk Zoning guides planting decisions, while financing options support irrigation infrastructure development, enabling commercial-scale production.
The Northeast and Southeast regions fulfill distinct market roles. Northeast farms maintain household-level rice production through targeted support programs, incorporating drought-forecast systems and water-efficient varieties. The Southeast, particularly São Paulo, houses significant milling facilities and packaging operations, utilizing multimodal transportation to distribute to urban markets.
The Northern region's decreased rice production aligns with environmental conservation objectives and shifts toward more profitable crops without impacting national supply capabilities.
Recent Industry Developments
- February 2025: Monthly rice exports climbed 34% year-on-year to 112.5 thousand metric tons, generating USD 35.9 million and reaching Senegal, Gambia, and the United States.
- October 2024: Brazil introduced the "Rice for the People" program to increase rice production and strengthen national stockpiles, with a target of expanding output by 500,000 metric tons. The government allocated BRL 1 billion (USD 178 million) to support the initiative, which provides option contracts to small and medium-sized farmers by guaranteeing predetermined purchase prices to stimulate rice cultivation.
- May 2024: Brazil suspended import tariffs on rice from May 2024 to December 31, 2024, in response to severe flooding in Rio Grande do Sul, which accounts for two-thirds of the country's rice production. The tariff exemption covers polished and non-parboiled rice, which previously carried duties ranging from 9% to 10.8%.


Research Methodology Framework and Report Scope
Market Definitions and Key Coverage
Our study defines the Brazil rice market as all paddy harvested within the country that is transformed into husked, brown, parboiled, or fully milled rice and then sold domestically or exported in bulk or consumer packs. Mordor Intelligence measures value at the processor gate, before retail margins are added, and tracks both volume (metric tons) and revenue (USD).
Scope exclusion: We purposely leave out rice-based derivatives such as rice protein, rice flour, and ready-to-eat meals, as their value chains behave differently.
Segmentation Overview
-
Geography
-
Brazil
- Production Analysis (Volume)
- Consumption Analysis (Value and Volume)
- Import Analysis (Value and Volume)
- Export Analysis (Value and Volume)
- Price Trend Analysis
-
Brazil
Detailed Research Methodology and Data Validation
Primary Research
To close gaps, our analysts interviewed Brazilian millers, distributor cooperatives, port agents, and agronomic researchers across the South, Southeast, and North. The conversations tested preliminary figures, yielded typical ex-mill average selling prices, and confirmed assumptions on seed uptake, irrigation costs, and export tariff pass-throughs that were only hinted at in documents.
Desk Research
We began by mapping the supply side with public datasets such as USDA-FAS production and trade tables, IBGE crop area surveys, Abiarroz export releases, and CEPEA farm-gate price indices, which together sketch annual output, yields, and pricing. Trade statistics retrieved from the Observatory of Economic Complexity and ITC Trade Map let us verify import flows from Paraguay and Uruguay, while Rio Grande do Sul state bulletins clarified irrigated share, now above ninety percent of national output.
Financial filings gathered through D&B Hoovers and headline checks on Dow Jones Factiva added processor revenue guidance and plant utilizations that sharpen volume-to-value conversions.
Additional context came from World Bank macro data and academic journals discussing water use intensity. This list is illustrative, not exhaustive, and many more publications aided data validation and narrative refinement.
Market-Sizing & Forecasting
We build the 2024 baseline through a top-down production and trade reconstruction that converts paddy output to milled equivalent using region-specific recovery rates, adjusts for ending stocks, and values the net supply at verified average selling prices. Results are cross-checked with a selective bottom-up roll-up of the five largest millers to ensure no major disconnect.
Key variables, including cultivated area, paddy yield, conversion yield, per-capita household demand, export rebate policy, and farm-gate price index, feed a multivariate regression, after which scenario analysis projects 2025-2030 outcomes. Where mill-level data are missing, we apply weighted averages drawn from similar capacity plants, then flag variance ranges for review.
Data Validation & Update Cycle
Before sign-off, Mordor analysts compare model outputs against independent trade balances and retail scanner price trends. Any anomaly triggers a second round of peer review. Reports refresh every twelve months, and we push interim updates when floods, tariff shifts, or phytosanitary rule changes materially move the market.
Why Mordor's Brazil Rice Baseline Earns Stakeholder Confidence
Published estimates often diverge because firms select different price points, include processed derivatives, or freeze exchange rates at varied moments. Our disciplined scope, annual refresh, and dual-path modeling reduce such drift.
Key gap drivers with other providers center on: a) counting household spending instead of processor revenue, b) rolling Latin America into Brazil without isolating cross-border re-exports, and c) relying on untraced retail ASPs rather than verified mill gate prices.
Benchmark comparison
| Market Size | Anonymized source | Primary gap driver |
|---|---|---|
| USD 5.07 B (2025) | Mordor Intelligence | |
| USD 4.50 B (2023) | Global Consultancy A | Includes only packaged rice and older base year |
| USD 8.37 B (2021) | Trade Journal B | Uses household expenditure and inflation roll-ups |
These comparisons show that, by anchoring numbers to measurable supply variables and validating every assumption with on-ground voices, Mordor delivers a balanced, transparent baseline that decision-makers can reliably trace back to clear inputs.


Key Questions Answered in the Report
What is the current size of the Brazil rice market?
The Brazil rice market is valued at USD 5.25 billion in 2026 and is projected to reach USD 6.28 billion by 2031.
Which region drives most of Brazil’s rice production?
The South region, led by Rio Grande do Sul and Santa Catarina, contributes 74.35% of national output, although the Midwest is the fastest-growing hub.
How is technology improving rice competitiveness in Brazil?
Precision agriculture, genomic breeding, blockchain traceability, and remote-sensing field mapping cut input costs, raise yields, and help exporters secure premiums.
What government policies support smallholders in the rice sector?
Programs such as “Arroz da Gente” and Pronaf provide subsidized credit and option contracts, ensuring market stability and fostering inclusive growth among small and medium producers
Page last updated on:


