Market Overview
| Study Period | 2021 - 2031 |
|---|---|
| Forecast Data Period | 2026 - 2031 |
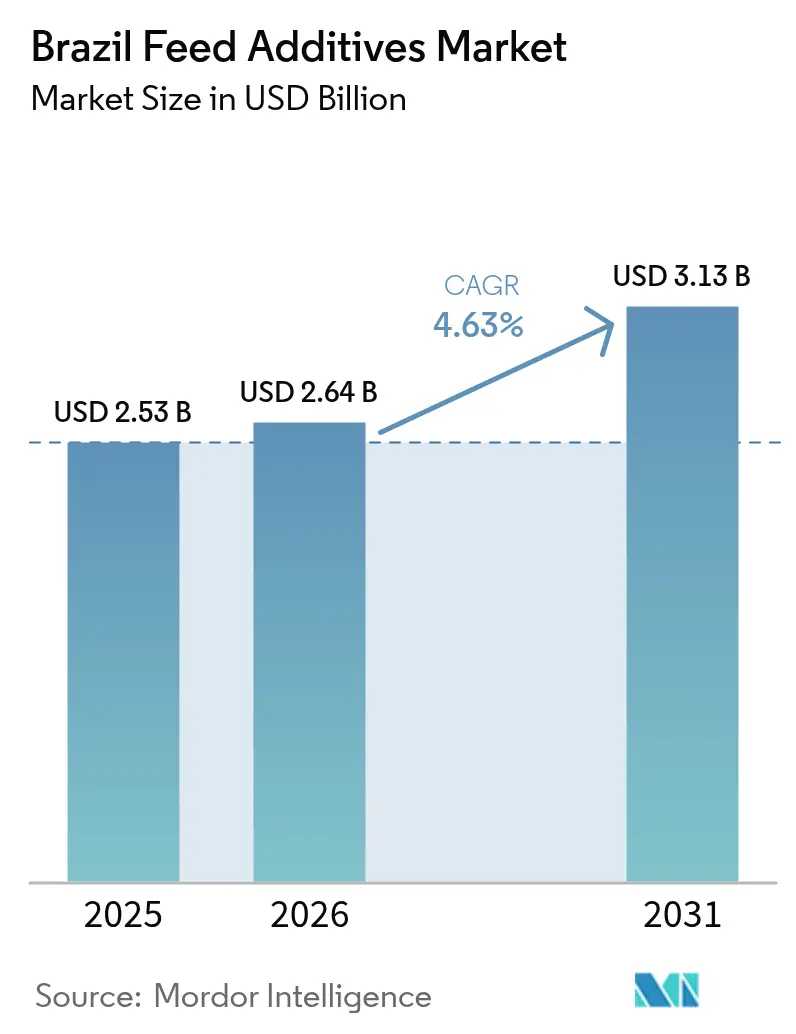
| Base Year Market Size (2025) | USD 2.53 Billion |
| Market Size (2026) | USD 2.64 Billion |
| Market Size (2031) | USD 3.13 Billion |
| Growth Rate (2026 - 2031) | 4.63% CAGR |
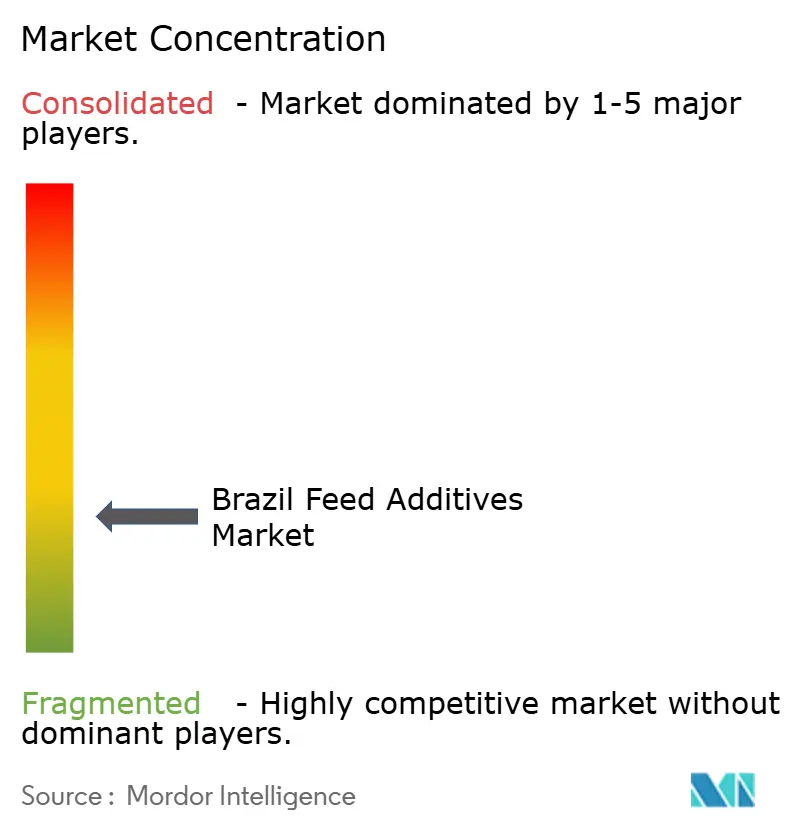
| Market Concentration | Low |
Major Players *Disclaimer: Major Players sorted in no particular order Image © Mordor Intelligence. Reuse requires attribution under CC BY 4.0. | |
Brazil Feed Additives Market Analysis by Mordor Intelligence
The Brazil feed additives market size was valued at USD 2.53 billion in 2025 and estimated to grow from USD 2.64 billion in 2026 to reach USD 3.31 billion by 2031, at a CAGR of 4.63% during the forecast period (2026-2031). Sustained growth reflects Brazil’s entrenched role as the world’s largest chicken exporter, the steady rise of intensive tilapia aquaculture, and mounting regulatory pressure to replace antibiotic growth promoters with functional alternatives[1]Source: Brazilian Animal Protein Association, “Brazilian Poultry Production and Export Statistics 2024,” abpa-br.org. Expanding vertical integration across poultry supply chains, the adoption of recirculating aquaculture systems, and Brazil’s ABC+ low-carbon incentives all reinforce additive demand. Currency volatility and mycotoxin contamination weigh on margins, but precision-feeding platforms, enzyme micro-dosing, and chelated trace-mineral fortification are widening the technical value proposition of additives. Suppliers that localize production, co-develop strains with Brazilian universities, and secure multi-year contracts with integrators can defend pricing while hedging exchange-rate risk.
Key Report Takeaways
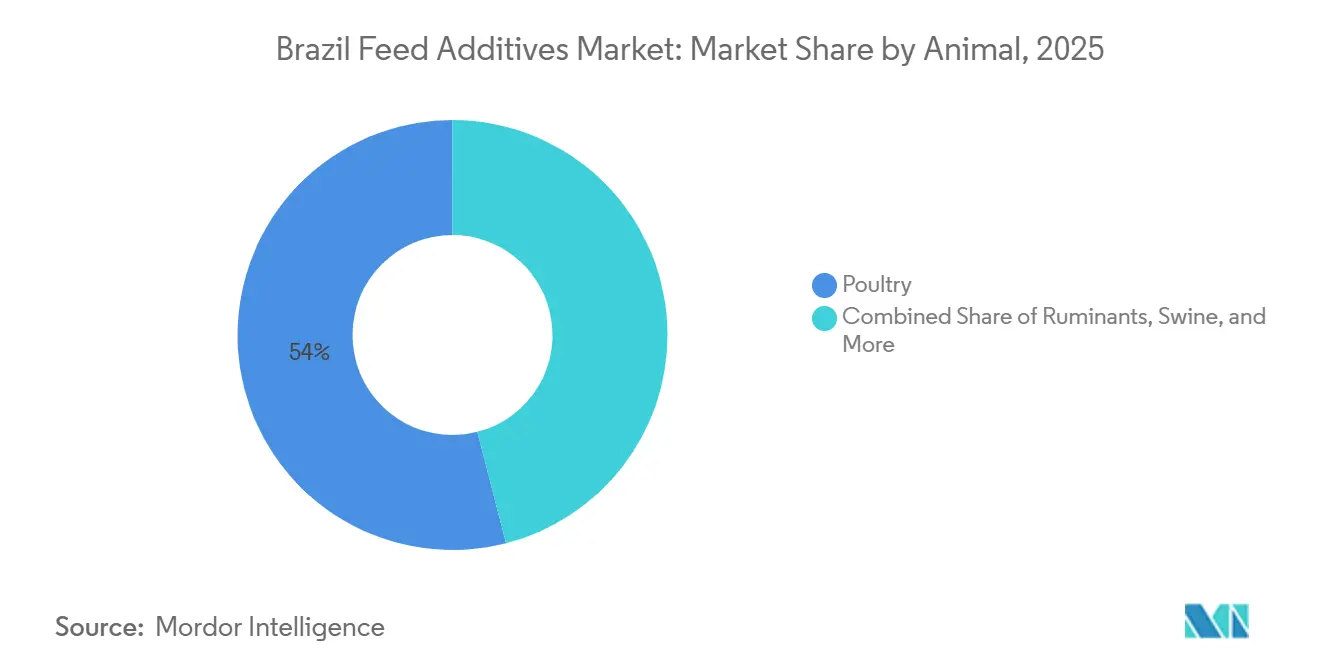
- By animal type, poultry held 54.0% of Brazil feed additives market share in 2025, while aquaculture is projected to post the fastest growth at a 5.3% CAGR from 2026 to 2031.
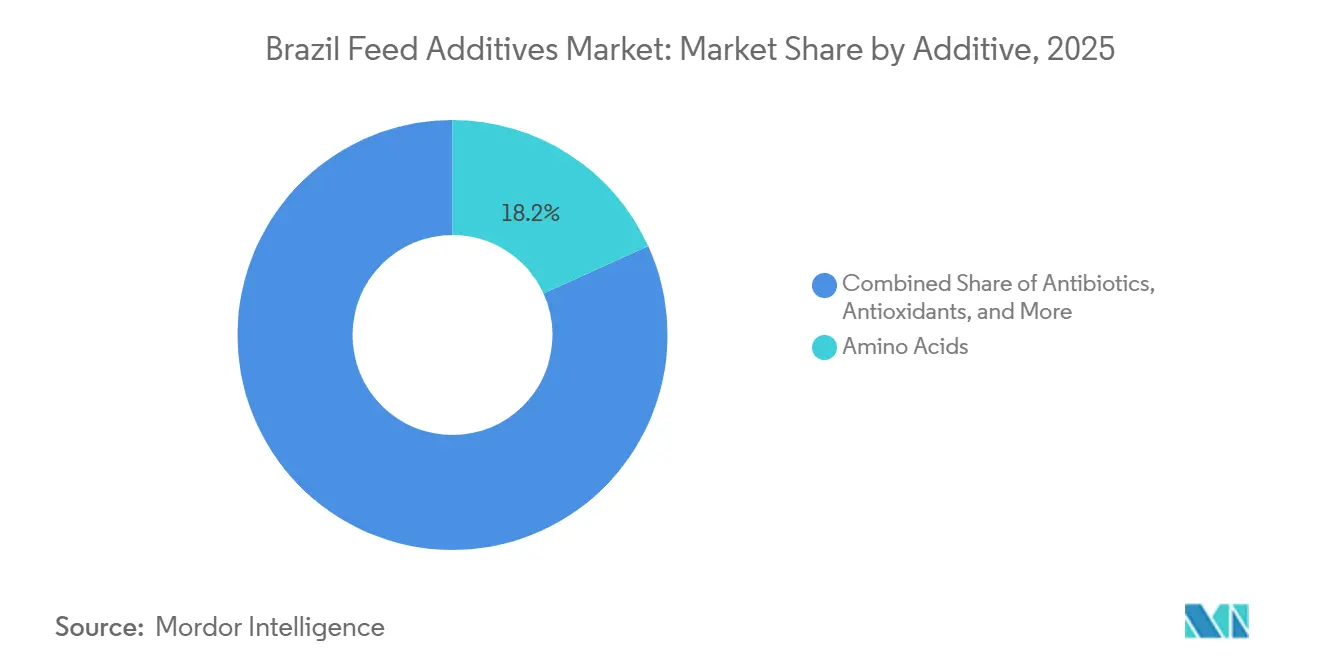
- By additive type, amino acids accounted for 18.2% of the Brazil feed additives market size in 2025, while acidifiers are forecast to expand at a 5.5% CAGR from 2026 to 2031.
Note: Market size and forecast figures in this report are generated using Mordor Intelligence’s proprietary estimation framework, updated with the latest available data and insights as of 2026.
Brazil Feed Additives Market Trends and Insights
Drivers Impact Analysis*
| Driver | (~) % Impact on CAGR Forecast | Geographic Relevance | Impact Timeline |
|---|---|---|---|
| Gradual ban on antibiotic growth promoters | +0.9% | Nationwide, compliance highest in São Paulo, Paraná, Santa Catarina | Medium term (2-4 years) |
| Tilapia RAS (Recirculating Aquaculture System) aquaculture boom | +0.5% | Mato Grosso, Goiás, Minas Gerais | Medium term (2-4 years) |
| Mandatory trace-mineral fortification law | +0.4% | Nationwide (pending MAPA decree) | Long term (≥4 years) |
| Carbon-credit premiums for low-methane feeds | +0.3% | Mato Grosso do Sul, Goiás, Mato Grosso beef feedlots | Long term (≥4 years) |
| Surge of integrated poultry megafarms | +0.7% | São Paulo, Paraná, Santa Catarina hubs | Short term (≤2 years) |
| On-farm enzyme micro-dosing technology | +0.2% | Pilot sites in São Paulo and Paraná | Medium term (2-4 years) |
| Source: Mordor Intelligence | |||
Gradual Ban on Antibiotic Growth Promoters
Brazilian Health Regulatory Agency (Agência Nacional de Vigilância Sanitária [ANVISA]) bans on colistin (2016) and tylosin, lincomycin, and tiamulin (2020) accelerate the transition to multi-strain probiotics, enzymes, and organic acids that maintain feed efficiency without fostering antimicrobial resistance[2]Source: Ministério da Agricultura e Pecuária (MAPA), “Normative Instruction No. 1: Banning of Tylosin, Lincomycin, and Tiamulin as Growth Promoters,” gov.br. Large poultry integrators running antibiotic-free programs for premium export markets have validated Bacillus probiotics and xylanase blends that deliver weight-gain parity at a 3-5% additive-cost uplift. Enzyme manufacturers report double-digit sales growth in antibiotic-free starter diets, while pelleted feed mills in Paraná and Santa Catarina invest in heat-stable probiotic carriers to safeguard viability. As ANVISA signals broader antibiotic phase-outs, demand elasticity for functional alternatives is anticipated to strengthen through 2028.
Tilapia RAS (Recirculating Aquaculture System) Aquaculture Boom
Recirculating aquaculture system (RAS) installations in Mato Grosso and Goiás cut water usage by up to 90% but heighten water-quality sensitivity, spurring uptake of encapsulated fumaric and lactic acids that resist leaching. Trials published in 2024 recorded a 1.5-point feed conversion ratio improvement when RAS tilapia diets included 2 kg metric tons of encapsulated organic acids versus control rations. In tandem, phytase inclusion liberates bound phosphorus in soybean meal, curbing effluent discharge fees and reducing total feed phosphorus costs by 8-10%. Nutritionists forecast continued migration from pond-based production to Recirculating aquaculture system (RAS), underpinning premium additive demand across the inland aquaculture belt.
Mandatory Trace-Mineral Fortification Law
Consultations between the Ministry of Agriculture, Livestock and Food Supply (Ministério da Agricultura, Pecuária e Abastecimento [MAPA]) and industry stakeholders point to legislative drafts that codify baseline zinc, manganese, and copper levels for all complete feeds. Chelated mineral suppliers have demonstrated that organic zinc enables a 30-40% lower inclusion rate while maintaining tissue deposition, reducing environmental excretion, and positioning chelates as cost-neutral beyond breakeven tonnages of 50,000 metric tons per year. Feed mills trialing chelated portfolios in Santa Catarina recorded shell-quality gains in brown layers and increased thicker eggshell membranes. Once enforced, fortification is likely to re-weight the product mix toward higher-value organic minerals.
Surge of Integrated Poultry Megafarms
JBS, BRF, and Aurora Alimentos expanded breeder farms, and hatcheries are investing in expanding their poultry production capacity, underpinning demand for vitamins, methionine, and xylanase dosage systems that feed directly from silos. Contract extensions now last three to five years, binding suppliers to indexed pricing formulas that track soybean meal and corn. Enzyme firms embedding technical teams inside integrator feed mills have secured increased customer retention, despite price pressure, by optimizing nutrient matrices and documenting annual feed cost savings of USD 15 metric tons.
Restraints Impact Analysis*
| Restraint | (~) % Impact on CAGR Forecast | Geographic Relevance | Impact Timeline |
|---|---|---|---|
| Currency volatility inflating import costs | -0.6% | Nationwide | Short term (≤2 years) |
| Mycotoxin-laden domestic corn supply | -0.4% | Mato Grosso, Paraná, Goiás | Short term (≤2 years) |
| Slow generally recognized as safe (GRAS) clearance for novel botanicals | -0.2% | Nationwide | Medium term (2-4 years) |
| Rising consumer distrust of synthetic pigments | -0.1% | São Paulo and Rio de Janeiro urban markets | Medium term (2-4 years) |
| Source: Mordor Intelligence | |||
Slow Generally Recognized as Safe (GRAS) Clearance for Novel Botanicals
ANVISA’s dossier review for phytogenic extracts exceeds 24 months on average, deterring suppliers from registering oregano-thyme blends positioned as antibiotic alternatives. Between 2023 and 2025, only three new botanical additives achieved GRAS-equivalent status, compared with 14 enzyme approvals during the same period. Delayed market entry reduces innovation velocity and preserves incumbent positions of synthetic acidifiers and antioxidants. Without procedural reform, Brazil risks lagging global peers on phytogenic adoption rates.
Rising Consumer Distrust of Synthetic Pigments
Retail chains in São Paulo and Rio de Janeiro have added synthetic canthaxanthin and apo-ester to “clean-label” exclusion lists, pressuring layer producers to switch to marigold or paprika-based natural pigments. Natural pigment inclusion costs are roughly 2.2 times higher, squeezing layer margins unless egg prices adjust. Consumer surveys in 2025 showed increased willingness to pay premium for “natural color” eggs, but price elasticity dropped in low-income demographics. If perception risks spread to broiler skin yellowness, pigment suppliers must pivot marketing toward traceability and safety assurances.
*Our forecasts treat driver/restraint impacts as directional, not additive. The impact forecasts reflect baseline growth, mix effects, and variable interactions.
Segment Analysis
By Additive Type: Amino Acids Anchor Demand
Amino acids secured an 18.2% share of the Brazil feed additives market size in 2025, underscoring their centrality to precision protein nutrition. Methionine and lysine account for the majority of amino acid volume and are typically secured through index-linked contracts that protect suppliers from seasonal fluctuations. Lower crude-protein diet strategies are intensifying threonine and tryptophan uptake. Volumes rose in 2025 as broiler integrators balanced essential amino acids to protect carcass yield. Acidifiers, projected to grow at a 5.5% CAGR from 2026-2031, are gaining favor in tilapia recirculating aquaculture system (RAS) and post-weaning piglet diets, where buffered fumaric and propionic acid blends control gut pH without antibiotics.
Enzymes are driven by widespread phytase inclusion that enables a 0.14% reduction in inorganic phosphate. Heat-stable carbohydrases capable of withstanding 85°C pelleting are now priced at a premium but continue to gain significant traction as feed mills prioritize higher throughput. Antioxidant stabilizers play a critical role in protecting fat-soluble vitamins from oxidative degradation during storage periods of up to 90 days. Probiotics and phytogenics, though smaller in tonnage, deliver outsize growth as antibiotic bans tighten and clean-label retail programs proliferate.


By Animal Type: Poultry Concentration Persists
Poultry absorbed 54.0% of the Brazil feed additives market size in 2025. Broiler majors in Paraná and Santa Catarina employ amino acid density, xylanase, and probiotics to capture export premiums tied to antibiotic-free certification. Layer enterprises focus on calcium and natural pigments to meet shell-quality and yolk-color benchmarks under cage-free repositioning strategies. Acidifier adoption is intensifying in turkey diets as integrators target European markets that cap antibiotic use for necrotic enteritis.
Aquaculture is growing at the fastest pace, with a 5.3% CAGR from 2026-2031, yet it still accounts for a modest share of total volume. Recirculating aquaculture system (RAS) tilapia requires a higher protein density and specialized enzymes to efficiently digest soybean concentrates. Swine holds a steady share as multistage feeding programs escalate amino acid and acidifier volumes in post-weaning diets. Ruminant additive demand and carbon-credit pilot schemes are incentivizing the use of methane-reducing compounds in Mato Grosso do Sul feedlots. Other segments, like equine, ovine, and caprine, account for the residual, served primarily by domestic premix blenders that tailor vitamin-mineral packs.
Geography Analysis
The southern tri-state region, comprising São Paulo, Paraná, and Santa Catarina, dominates Brazil feed additives market. This is due to its dense poultry integration, port access, and high concentration of premix production capacity. Local governments in this region provide tax credits for feed-mill automation, encouraging investments that support the adoption of heat-stable enzymes and probiotic carriers.
The Midwest states of Mato Grosso and Goiás are becoming key hubs for aquaculture. The deployment of tilapia recirculating aquaculture systems has increased regional consumption of additives. Encapsulated acidifiers offer water stability suitable for high-density tanks, a feature less critical in traditional pond systems. Proximity to corn supplies reduces transport costs, enabling the production of competitively priced diets that incorporate premium enzymes.
The Northeast and Northern regions collectively account for a smaller share of Brazil feed additives market but exhibit above-average growth rates. This growth is driven by the migration of integrated swine and dairy enterprises from the saturated southern markets. However, logistical inefficiencies and limited cold-chain infrastructure extend transit times for probiotic products, necessitating higher colony-forming-unit overspecification. Planned government investments in road and rail infrastructure could enhance additive penetration in these under-served regions.
Competitive Landscape
Competition within the Brazil feed additives market is moderate in 2025. Five multinationals, namely DSM-Firmench AG, Bluestar Adisseo Company, Nutreco N.V., Alltech, Inc., and Archer Daniels Midland Company, command a significant share of the Brazil feed additives market, shaping procurement standards and research collaborations. Their vertical integration in premix blending provides end-to-end supply security for broiler giants that place weekly feed orders exceeding 10,000 metric tons.
Mid-tier players such as Evonik Industries AG, BASF SE, Kemin Industries, Inc., and Phibro Animal Health Corporation differentiate through technical service models that embed nutritionists on customer sites, optimizing nutrient matrices and validating cost of use. In August 2025, Cargill, Incorporated expanded its Brazilian feed business through the acquisition of Mig-Plus, focusing on multiple species, particularly swine and ruminants. The product portfolio includes premixes, feed concentrates, and complete feeds[3]Source: Cargill Incorporated, “Animal Nutrition Brazil 2024,” cargill.com. Local specialists leverage by-product substrates from ethanol or sugarcane to produce cost-competitive enzymes, capturing volume among price-sensitive independent mills. Meanwhile, Chinese amino acid suppliers enter via direct distribution, discounting 3-5% against European quotes but face skepticism on traceability and after-sales responsiveness.
Regulatory compliance remains pivotal. ANVISA’s dossier workload and ISO 22000 certification costs can exceed highly per additive, dissuading smaller entrants and reinforcing incumbent positions. Data-driven differentiation is rising, where Nutreco N.V.’s precision nutrition platform correlates real-time performance metrics with feed formulation tweaks, reporting feed conversion improvement among early adopters. Growing traceability demands create white-space for QR-coded additive documentation aligned with export market audits.
Brazil Feed Additives Industry Leaders
Archer Daniels Midland Company
DSM-Firmench AG
Bluestar Adisseo Company
Nutreco N.V
Alltech, Inc.
- *Disclaimer: Major Players sorted in no particular order

Recent Industry Developments
- August 2025: Cargill, Incorporated expanded its Brazilian feed business through the acquisition of Mig-Plus, focusing on multiple species, particularly swine and ruminants. The acquisition expanded the company's presence in Brazil, adding performance enhancers, vitamins, and specialty blends designed for local production systems.
- October 2024: Amlan International has appointed a new distributor in northern Brazil to expand the distribution of its natural feed additives for poultry and livestock producers. This expansion increases regional access to the company's mineral-based toxin binders and gut health solutions, responding to Brazil's increasing demand for antibiotic-free feed additives that enhance animal performance.
- October 2024: DSM-Firmenich AG opens new animal nutrition factory in Brazil. The plant will produce 100,000 metric tons of supplements annually for the health and nutrition of beef and dairy cattle. This facility enhances proximity to customers and strategic partners, enabling more efficient delivery of solutions that support herd health and productivity.


Brazil Feed Additives Market Report Scope
Feed additives are substances incorporated into animal nutrition to influence the feed, the animals, or the food products derived from them. They complement core nutrition by enhancing digestion, immunity, and growth efficiency in livestock and aquaculture. The Brazil Feed Additives Market is Segmented by Additive Type (Acidifiers, Amino Acids, Antibiotics, Antioxidants, Binders, and More), and by Animal Type (Aquaculture, Poultry, Ruminants, Swine, and Other Animals). The Market Forecasts are Provided in Terms of Value (USD) and Volume (Metric Tons).
By Additive
| Acidifiers | Fumaric Acid |
| Lactic Acid | |
| Propionic Acid | |
| Other Acidifiers | |
| Amino Acids | Lysine |
| Methionine | |
| Threonine | |
| Tryptophan | |
| Other Amino Acids | |
| Antibiotics | Bacitracin |
| Penicillins | |
| Tetracyclines | |
| Tylosin | |
| Other Antibiotics | |
| Antioxidants | Butylated Hydroxyanisole |
| Butylated Hydroxytoluene | |
| Citric Acid | |
| Ethoxyquin | |
| Propyl Gallate | |
| Tocopherols | |
| Other Antioxidants | |
| Binders | Natural Binders |
| Synthetic Binders | |
| Enzymes | Carbohydrases |
| Phytases | |
| Other Enzymes | |
| Flavors and Sweeteners | Flavors |
| Sweeteners | |
| Minerals | Macrominerals |
| Microminerals | |
| Mycotoxin Detoxifiers | Binders |
| Biotransformers | |
| Phytogenics | Essential Oil |
| Herbs and Spices | |
| Other Phytogenics | |
| Pigments | Carotenoids |
| Curcumin and Spirulina | |
| Prebiotics | Fructo Oligosaccharides |
| Galacto Oligosaccharides | |
| Inulin | |
| Lactulose | |
| Mannan Oligosaccharides | |
| Xylo Oligosaccharides | |
| Other Prebiotics | |
| Probiotics | Bifidobacteria |
| Enterococcus | |
| Lactobacilli | |
| Pediococcus | |
| Streptococcus | |
| Other Probiotics | |
| Vitamins | Vitamin A |
| Vitamin B | |
| Vitamin C | |
| Vitamin E | |
| Other Vitamins | |
| Yeast | Live Yeast |
| Selenium Yeast | |
| Spent Yeast | |
| Torula Dried Yeast | |
| Whey Yeast | |
| Yeast Derivatives |
By Animal
| Aquaculture | Fish |
| Shrimp | |
| Other Aquaculture Species | |
| Poultry | Broiler |
| Layer | |
| Other Poultry Birds | |
| Ruminants | Beef Cattle |
| Dairy Cattle | |
| Other Ruminants | |
| Swine | |
| Other Animals |
| By Additive | Acidifiers | Fumaric Acid |
| Lactic Acid | ||
| Propionic Acid | ||
| Other Acidifiers | ||
| Amino Acids | Lysine | |
| Methionine | ||
| Threonine | ||
| Tryptophan | ||
| Other Amino Acids | ||
| Antibiotics | Bacitracin | |
| Penicillins | ||
| Tetracyclines | ||
| Tylosin | ||
| Other Antibiotics | ||
| Antioxidants | Butylated Hydroxyanisole | |
| Butylated Hydroxytoluene | ||
| Citric Acid | ||
| Ethoxyquin | ||
| Propyl Gallate | ||
| Tocopherols | ||
| Other Antioxidants | ||
| Binders | Natural Binders | |
| Synthetic Binders | ||
| Enzymes | Carbohydrases | |
| Phytases | ||
| Other Enzymes | ||
| Flavors and Sweeteners | Flavors | |
| Sweeteners | ||
| Minerals | Macrominerals | |
| Microminerals | ||
| Mycotoxin Detoxifiers | Binders | |
| Biotransformers | ||
| Phytogenics | Essential Oil | |
| Herbs and Spices | ||
| Other Phytogenics | ||
| Pigments | Carotenoids | |
| Curcumin and Spirulina | ||
| Prebiotics | Fructo Oligosaccharides | |
| Galacto Oligosaccharides | ||
| Inulin | ||
| Lactulose | ||
| Mannan Oligosaccharides | ||
| Xylo Oligosaccharides | ||
| Other Prebiotics | ||
| Probiotics | Bifidobacteria | |
| Enterococcus | ||
| Lactobacilli | ||
| Pediococcus | ||
| Streptococcus | ||
| Other Probiotics | ||
| Vitamins | Vitamin A | |
| Vitamin B | ||
| Vitamin C | ||
| Vitamin E | ||
| Other Vitamins | ||
| Yeast | Live Yeast | |
| Selenium Yeast | ||
| Spent Yeast | ||
| Torula Dried Yeast | ||
| Whey Yeast | ||
| Yeast Derivatives | ||
| By Animal | Aquaculture | Fish |
| Shrimp | ||
| Other Aquaculture Species | ||
| Poultry | Broiler | |
| Layer | ||
| Other Poultry Birds | ||
| Ruminants | Beef Cattle | |
| Dairy Cattle | ||
| Other Ruminants | ||
| Swine | ||
| Other Animals | ||


Market Definition
- FUNCTIONS - For the study, feed additives are considered to be commercially manufactured products that are used to enhance characteristics such as weight gain, feed conversion ratio, and feed intake when fed in appropriate proportions.
- RESELLERS - Companies engaged in reselling feed additives without value addition have been excluded from the market scope, to avoid double counting.
- END CONSUMERS - Compound feed manufacturers are considered to be end-consumers in the market studied. The scope excludes farmers buying feed additives to be used directly as supplements or premixes.
- INTERNAL COMPANY CONSUMPTION - Companies engaged in the production of compound feed as well as the manufacturing of feed additives are part of the study. However, while estimating the market sizes, the internal consumption of feed additives by such companies has been excluded.
| Keyword | Definition |
|---|---|
| Feed additives | Feed additives are products used in animal nutrition for purposes of improving the quality of feed and the quality of food from animal origin, or to improve the animals’ performance and health. |
| Probiotics | Probiotics are microorganisms introduced into the body for their beneficial qualities. (It maintains or restores beneficial bacteria to the gut). |
| Antibiotics | Antibiotic is a drug that is specifically used to inhibit the growth of bacteria. |
| Prebiotics | A non-digestible food ingredient that promotes the growth of beneficial microorganisms in the intestines. |
| Antioxidants | Antioxidants are compounds that inhibit oxidation, a chemical reaction that produces free radicals. |
| Phytogenics | Phytogenics are a group of natural and non-antibiotic growth promoters derived from herbs, spices, essential oils, and oleoresins. |
| Vitamins | Vitamins are organic compounds, which are required for normal growth and maintenance of the body. |
| Metabolism | A chemical process that occurs within a living organism in order to maintain life. |
| Amino acids | Amino acids are the building blocks of proteins and play an important role in metabolic pathways. |
| Enzymes | Enzyme is a substance that acts as a catalyst to bring about a specific biochemical reaction. |
| Anti-microbial resistance | The ability of a microorganism to resist the effects of an antimicrobial agent. |
| Anti-microbial | Destroying or inhibiting the growth of microorganisms. |
| Osmotic balance | It is a process of maintaining salt and water balance across membranes within the body's fluids. |
| Bacteriocin | Bacteriocins are the toxins produced by bacteria to inhibit the growth of similar or closely related bacterial strains. |
| Biohydrogenation | It is a process that occurs in the rumen of an animal in which bacteria convert unsaturated fatty acids (USFA) to saturated fatty acids (SFA). |
| Oxidative rancidity | It is a reaction of fatty acids with oxygen, which generally causes unpleasant odors in animals. To prevent these, antioxidants were added. |
| Mycotoxicosis | Any condition or disease caused by fungal toxins, mainly due to contamination of animal feed with mycotoxins. |
| Mycotoxins | Mycotoxins are toxin compounds that are naturally produced by certain types of molds (fungi). |
| Feed Probiotics | Microbial feed supplements positively affect gastrointestinal microbial balance. |
| Probiotic yeast | Feed yeast (single-cell fungi) and other fungi used as probiotics. |
| Feed enzymes | They are used to supplement digestive enzymes in an animal’s stomach to break down food. Enzymes also ensure that meat and egg production is improved. |
| Mycotoxin detoxifiers | They are used to prevent fungal growth and to stop any harmful mold from being absorbed in the gut and blood. |
| Feed antibiotics | They are used both for the prevention and treatment of diseases but also for rapid growth and development. |
| Feed antioxidants | They are used to protect the deterioration of other feed nutrients in the feed such as fats, vitamins, pigments, and flavoring agents, thus providing nutrient security to the animals. |
| Feed phytogenics | Phytogenics are natural substances, added to livestock feed to promote growth, aid in digestion, and act as anti-microbial agents. |
| Feed vitamins | They are used to maintain the normal physiological function and normal growth and development of animals. |
| Feed flavors and sweetners | These flavors and sweeteners help to mask tastes and odors during changes in additives or medications and make them ideal for animal diets undergoing transition. |
| Feed acidifiers | Animal feed acidifiers are organic acids incorporated into the feed for nutritional or preservative purposes. Acidifiers enhance congestion and microbiological balance in the alimentary and digestive tracts of livestock. |
| Feed minerals | Feed minerals play an important role in the regular dietary requirements of animal feed. |
| Feed binders | Feed binders are the binding agents used in the manufacture of safe animal feed products. It enhances the taste of food and prolongs the storage period of the feed. |
| Key Terms | Abbreviation |
| LSDV | Lumpy Skin Disease Virus |
| ASF | African Swine Fever |
| GPA | Growth Promoter Antibiotics |
| NSP | Non-Starch Polysaccharides |
| PUFA | Polyunsaturated Fatty Acid |
| Afs | Aflatoxins |
| AGP | Antibiotic Growth Promoters |
| FAO | The Food And Agriculture Organization of the United Nations |
| USDA | The United States Department of Agriculture |


Research Methodology
Mordor Intelligence follows a four-step methodology in all our reports.
- Step-1: IDENTIFY KEY VARIABLES: In order to build a robust forecasting methodology, the variables and factors identified in Step-1 are tested against available historical market numbers. Through an iterative process, the variables required for market forecast are set and the model is built on the basis of these variables.
- Step-2: Build a Market Model: Market-size estimations for the forecast years are in nominal terms. Inflation is not a part of the pricing, and the average selling price (ASP) is kept constant throughout the forecast period.
- Step-3: Validate and Finalize: In this important step, all market numbers, variables and analyst calls are validated through an extensive network of primary research experts from the market studied. The respondents are selected across levels and functions to generate a holistic picture of the market studied.
- Step-4: Research Outputs: Syndicated Reports, Custom Consulting Assignments, Databases & Subscription Platforms


