Battery & EV NDT Market Size and Share
Market Overview
| Study Period | 2019 - 2030 |
|---|---|
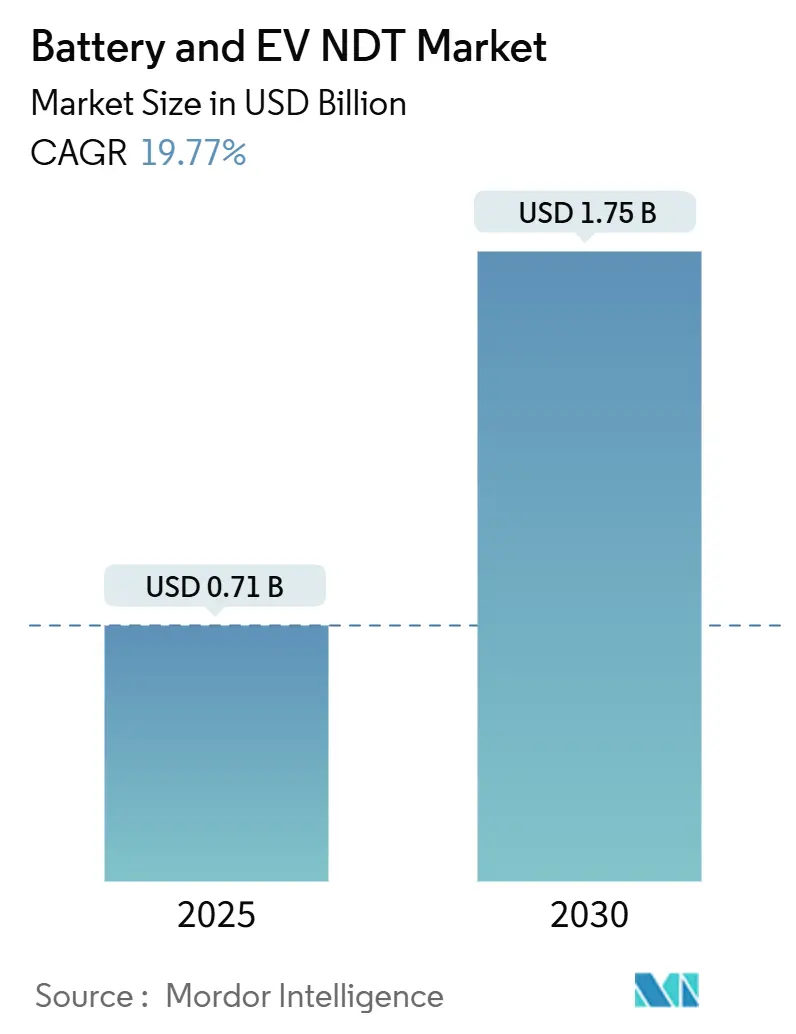
| Market Size (2025) | USD 0.71 Billion |
| Market Size (2030) | USD 1.75 Billion |
| Growth Rate (2025 - 2030) | 19.77% CAGR |
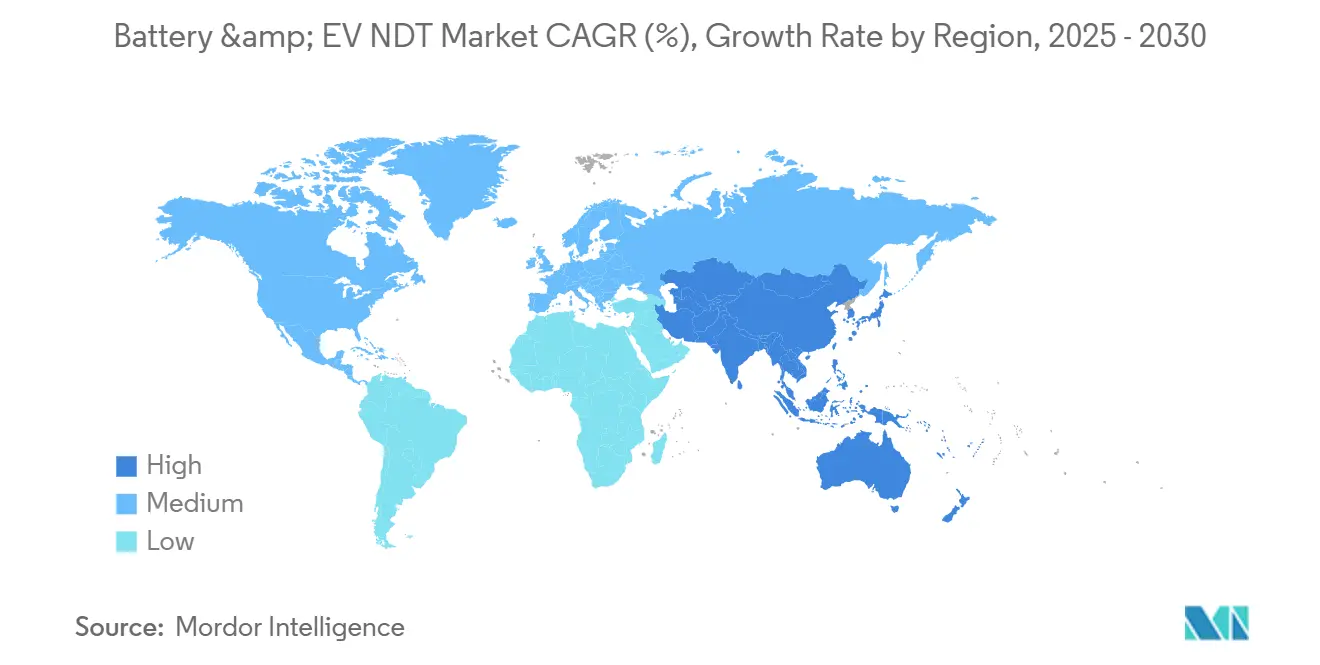
| Fastest Growing Market | Asia Pacific |
| Largest Market | Asia Pacific |
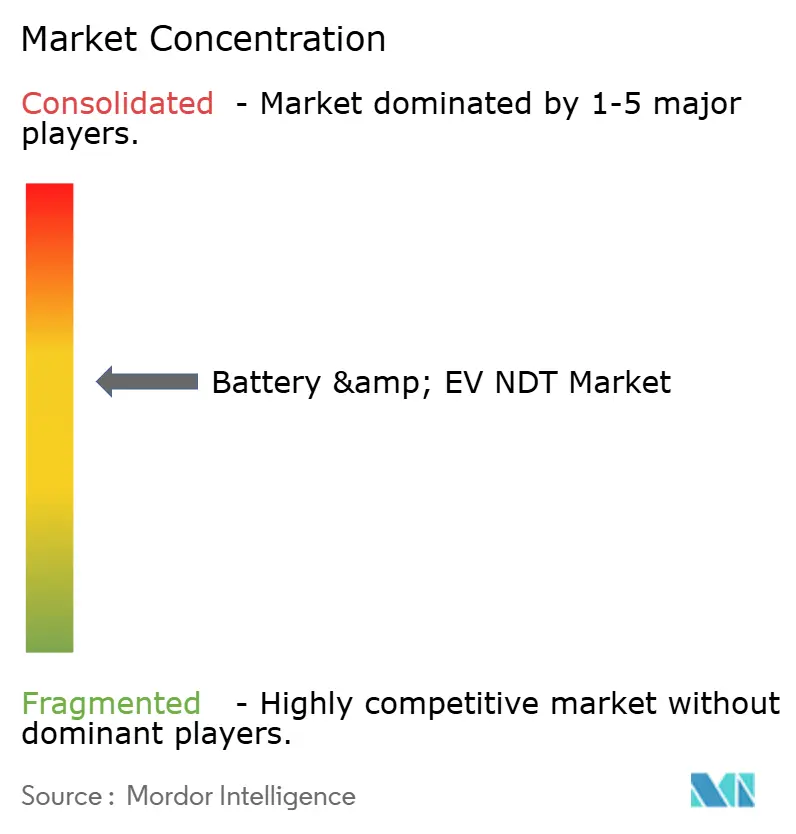
| Market Concentration | Medium |
Major Players *Disclaimer: Major Players sorted in no particular order Image © Mordor Intelligence. Reuse requires attribution under CC BY 4.0. | |
Battery & EV NDT Market Analysis by Mordor Intelligence
The battery and EV NDT market size is valued at USD 0.71 billion in 2025 and is projected to reach USD 1.75 billion by 2030, reflecting a 19.77% CAGR during the forecast period. Strong demand for in-line non-destructive testing across giga-factories, tighter global safety regulations, and rising OEM recall costs are combining to accelerate adoption. Continuous quality control at production line speeds has become a prerequisite, shifting capital budgets toward automated inspection cells that cover ultrasonic, eddy-current, radiographic, and CT methods. Software platforms using AI-driven analytics now underpin real-time decision-making, while service providers supply the specialized expertise that battery manufacturers often lack. Geographic momentum remains centered in the Asia-Pacific region, yet policy incentives in North America and Europe are rapidly expanding regional footprints, reshaping supply chains, and intensifying competition for skilled technicians.
Key Report Takeaways
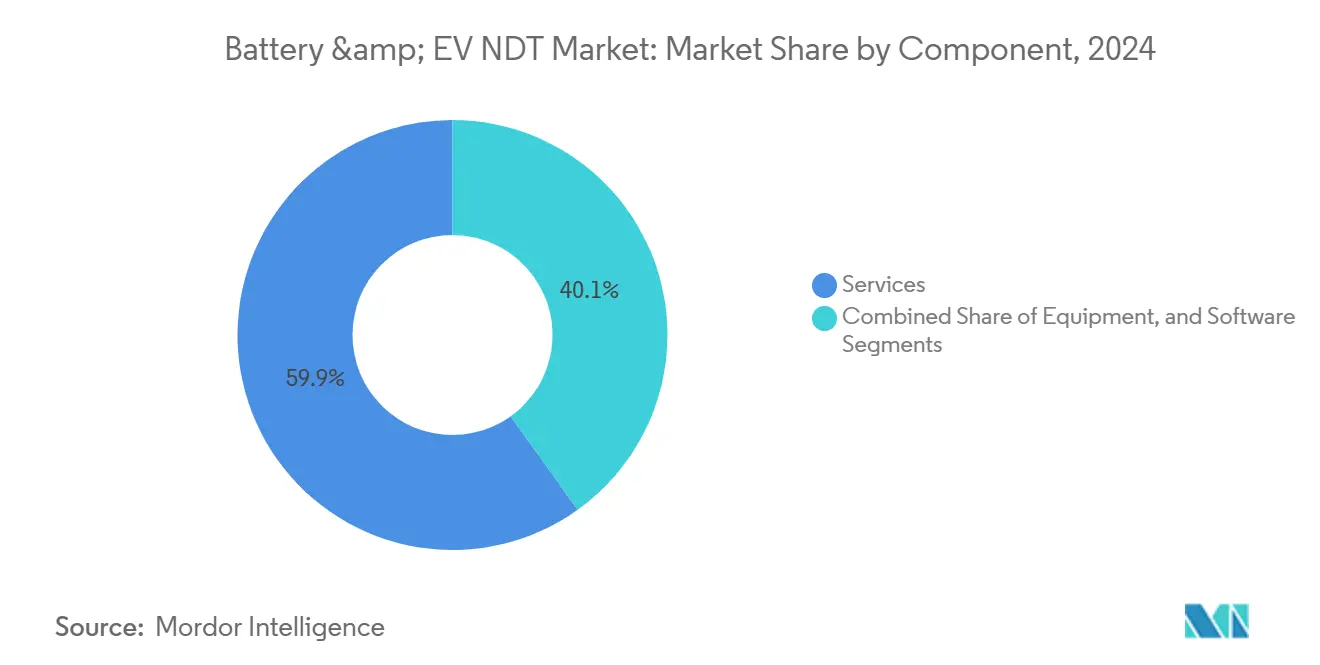
- By component, services led with a 59.9% battery and EV NDT market share in 2024, and software is forecast to grow at a 21.6% CAGR through 2030.
- By testing method, ultrasonic testing accounted for a 45.7% share of the battery and EV NDT market size in 2024, while eddy-current testing is projected to advance at a 22.4% CAGR to 2030.
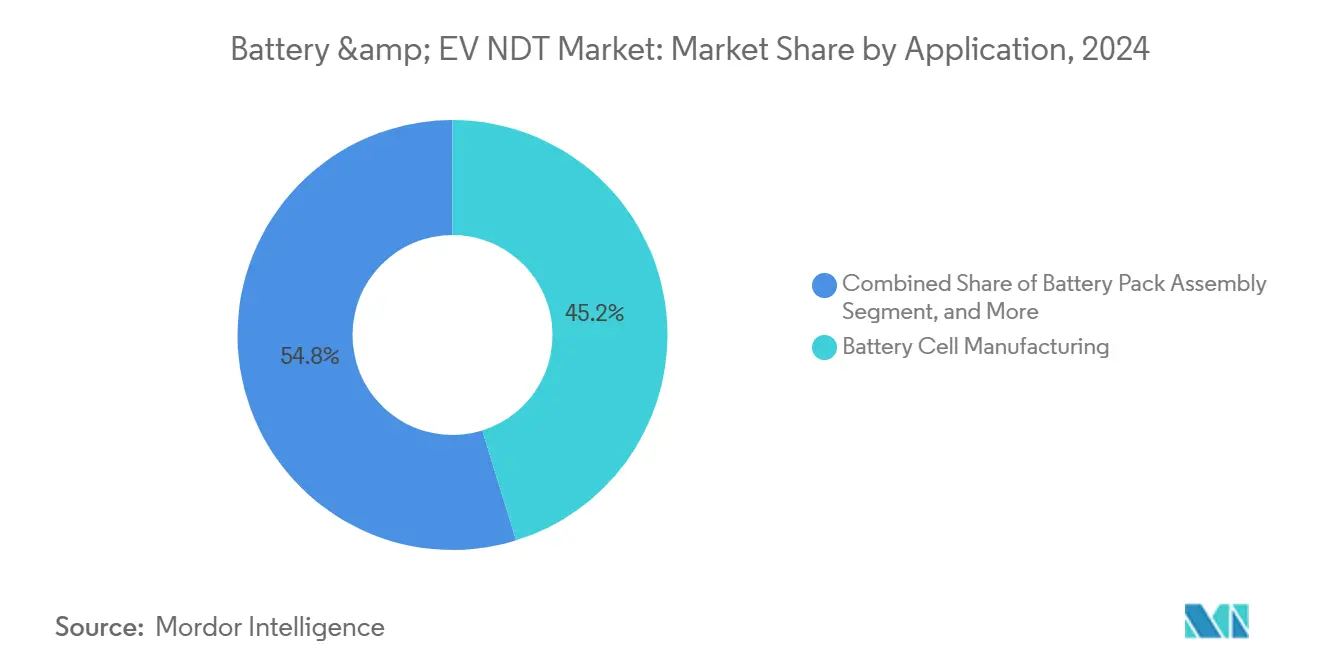
- By application, battery cell manufacturing captured 45.2% of the battery and EV NDT market size in 2024, and in-vehicle high-voltage system testing is expected to expand at a 23.5% CAGR through 2030.
- By geography, the Asia-Pacific region held 42.1% of the battery and EV NDT market share in 2024 and is projected to grow at a 20.8% CAGR to 2030.
Global Battery & EV NDT Market Trends and Insights
Drivers Impact Analysis*
| Driver | (~) % Impact on CAGR Forecast | Geographic Relevance | Impact Timeline |
|---|---|---|---|
| Surge in giga-factory build-outs demanding in-line NDT inspection | +4.2% | Global, concentrated in Asia-Pacific and North America | Medium term (2-4 years) |
| OEM recalls driving investment in advanced battery CT systems | +3.1% | Global, with higher impact in North America and Europe | Short term (≤ 2 years) |
| Rapid drop in X-ray detector cost boosts equipment ROI | +2.8% | Global | Medium term (2-4 years) |
| Regulatory push for UN 38.3 and IEC 62619 compliance | +2.5% | Global | Long term (≥ 4 years) |
| AI-powered defect analytics is reducing test cycle time | +3.4% | Global, early adoption in developed markets | Short term (≤ 2 years) |
| Solid-state battery pilot lines need novel acoustic techniques | +1.9% | Asia-Pacific and Europe primarily | Long term (≥ 4 years) |
| Source: Mordor Intelligence | |||
Surge in Giga-Factory Build-Outs Demanding In-Line NDT Inspection
Escalating cell production volumes at gigafactories are redefining quality assurance blueprints. Tesla’s Gigafactory Nevada utilizes automated ultrasonic arrays to inspect every cell at a rate of 20 pieces per minute, demonstrating the operational feasibility of achieving 100% coverage without slowing throughput.[1]Tesla Inc., “Gigafactory Nevada Battery Production and Quality Control Systems,” ir.tesla.com Floor-space allocation for inspection has quadrupled compared with traditional automotive plants, rising to 15–20% of total area. The economic justification is compelling: manufacturers calculate that preventing a single defective cell from entering a pack averts potential recall liabilities exceeding USD 1 billion. Capital planning now embeds NDT hardware, conveyance, and analytics as core infrastructure, turning inspection from a post-production gatekeeper into an in-line process engineer.
OEM Recalls Driving Investment in Advanced Battery CT Systems
Record-setting recall expenses have prompted automakers to adopt high-energy CT imaging, capable of detecting 50-micrometer flaws before they reach vehicles. General Motors spent more than USD 1.8 billion on the 2024 Chevrolet Bolt campaign, a sum that dwarfs the USD 3–5 million outlay for a state-of-the-art CT cell. Ford’s installation of inline CT for Mustang Mach-E packs cut field failures linked to internal anomalies by 90%, convincing insurers to offer premium discounts for manufacturers that certify CT-based inspection programs. As regulatory and financial pressures converge, CT technology is shifting from a forensic tool to a standard production fixture.
Rapid Drop in X-Ray Detector Cost Boosting Equipment ROI
CMOS sensor advances have reduced flat-panel detector prices by 40% between 2024 and 2025, making high-resolution radiographic testing accessible to mid-tier producers. A detector once priced at USD 85,000 now sells for under USD 50,000, compressing payback periods to 18–24 months and supporting adoption in pouch-cell lines that previously relied on slower film radiography. Faster exposure times—now measured in seconds—allow real-time inspection and process control. Vendors project that cost curves will drop another 15% by 2027, further widening the addressable market for automated X-ray solutions.
AI-Powered Defect Analytics Reducing Test Cycle Time
Machine-learning engines feed on millions of radiographic and ultrasonic images to recognize subtle defect patterns. Waygate Technologies’ deep-learning platform at BMW’s Dingolfing cell plant shortened inspection cycles from 45 seconds to 12 seconds per cell and raised detection accuracy by 35%.[2]Waygate Technologies, “AI-Powered NDT Analytics for Battery Manufacturing,” bakerhughes.com False positives decreased by 60%, resulting in reduced scrap and increased line efficiency. Standards bodies, including IEC TC104, are drafting guidance for AI validation, reinforcing confidence in automated verdict decisions. As algorithms mature, software subscription revenue is emerging as a high-margin growth vector within the broader battery and EV NDT market.
Restraints Impact Analysis*
| Restraint | (~) % Impact on CAGR Forecast | Geographic Relevance | Impact Timeline |
|---|---|---|---|
| High capex of high-energy CT scanners | -2.7% | Global, particularly impacting smaller manufacturers | Medium term (2-4 years) |
| Shortage of ASNT Level-III certified EV specialists | -2.1% | North America and Europe primarily | Short term (≤ 2 years) |
| Limited field-deployable solutions for pouch cell packs | -1.4% | Global, with a higher impact in the Asia-Pacific | Medium term (2-4 years) |
| Cybersecurity concerns in cloud-linked NDT platforms | -1.2% | Global, concentrated in developed markets | Long term (≥ 4 years) |
| Source: Mordor Intelligence | |||
High Capex of High-Energy CT Scanners
Penetrating dense, multi-layer battery packs demands 300-450 kV sources, custom shielding, and climate-controlled enclosures, driving capital requirements to USD 3-8 million per cell. Add-on safety barriers can add USD 1 million, while annual maintenance costs hover at 10-15% of the purchase price. For plants producing under 100,000 cells per year, the per-unit inspection cost can exceed sustainable margins. Leasing models and inspection-as-a-service contracts are emerging, but their adoption remains cautious due to concerns over intellectual property and the rigidity of production schedules.
Shortage of ASNT Level-III Certified EV Specialists
Only 12% of globally certified Level-III technicians hold EV-specific credentials, leaving a deficit of over 5,000 professionals.[3]American Society for Nondestructive Testing, “ASNT Level-III Certification Requirements for EV Battery Applications,” asnt.org Training pipelines extend from 18 to 24 months and require knowledge of electrochemical processes that are not typically covered in conventional NDT curricula. Salary premiums of 25–35% signal acute demand. Manufacturers have begun co-funding technical college programs and fast-track apprenticeships; however, workforce expansion is unlikely to match the commissioning schedules of giga-factories in the near term.
*Our forecasts treat driver/restraint impacts as directional, not additive. The impact forecasts reflect baseline growth, mix effects, and variable interactions.
Segment Analysis
By Component: Services Dominate Through Specialized Expertise
Services captured 59.9% of the battery and EV NDT market share in 2024, illustrating how complexity steers manufacturers toward outsourced knowledge. The heavy weighting reflects the demand for turnkey inspection programs that encompass procedure development, calibration, compliance documentation, and ongoing technician support. Equipment vendors increasingly bundle service contracts, blurring traditional product boundaries.
Service providers now offer predictive analytics that use inspection data to forecast cell degradation, enabling proactive maintenance and warranty optimization. As solid-state chemistries progress, service specialists are generating new revenue lines by adapting acoustic-emission techniques to non-polymer electrolytes. Software remains the fastest-growing component, expanding at a 21.6% CAGR as AI engines become core to defect classification. Equipment sales grow steadily, yet buyers favor integrated hardware-software-service ecosystems over standalone machines. The convergence positions multi-disciplinary service firms as gatekeepers of best-practice implementation across the battery and EV NDT market.


By Testing Method: Ultrasonic Testing Leads While Eddy-Current Gains Momentum
Ultrasonic testing held a dominant 45.7% share of the battery and EV NDT market size in 2024, favored for its versatility in detecting delamination, bond voids, and electrolyte intrusion without requiring electrode contact. Line-scan arrays now inspect cylindrical, pouch, and prismatic cells at production speed, reinforcing ultrasonic testing as the default first-pass filter.
Eddy-current testing’s 22.4% CAGR reflects its unique value in mapping subsurface flaws within conductive components such as tabs and collectors. Probe miniaturization enables the inspection of thin foils and high-density connector arrays, delivering defect resolution that is unattainable with alternative modalities. Hybrid systems are emerging: eddy-current arrays positioned upstream of radiographic cells pre-screen parts, thereby reserving CT capacity for suspected defects and optimizing throughput. Thermography and visual methods continue niche roles but benefit from AI-enhanced image segmentation that flags surface contaminants and dimensional deviations. As method integration intensifies, solution providers with multi-modal portfolios gain strategic leverage in the battery and EV NDT market.
By Application: Battery Cell Manufacturing Dominates Production Quality Focus
Battery cell manufacturing accounted for 45.2% of the battery and EV NDT market size in 2024, underscoring the axiom that defects detected at the cell level are exponentially cheaper than those at pack or vehicle levels. Automated ultrasonic and radiographic units linked to MES platforms drive 100% inspection, correlating cell-level data with downstream pack performance metrics.
In-vehicle high-voltage system testing is projected to post the fastest 23.5% CAGR as evolving electrical architectures raise verification demands on busbars, disconnect units, and coolant regulators. Pack assembly inspection grows steadily through multi-stage protocols that validate module alignment, weld integrity, and thermal interface uniformity. Emerging second-life and recycling applications are prompting the adaptation of inspection methods for state-of-health grading, adding a new revenue stream. Charging-infrastructure component testing is evolving as national networks scale, requiring portable ultrasonic and thermographic solutions that inspect high-power connectors in the field.
Geography Analysis
Asia-Pacific held a commanding 42.1% share of the battery and EV NDT market in 2024 and is poised for a 20.8% CAGR through 2030. Chinese cell giants CATL and BYD have invested over USD 12 billion in fully automated lines that incorporate ultrasonic and eddy-current stages, spanning from lamination to final formation. Japan’s solid-state pilot lines at Toyota incorporate ceramic-layer acoustic modules, while South Korea’s tier-one suppliers favor hybrid CT-ultrasonic cells to accelerate defect triage. Regional standards such as GB/T 31485 mandate rigorous validation, driving continuous equipment upgrades.
North America stands as the second-largest region, lifted by the Inflation Reduction Act’s local-content incentives. Tesla, General Motors, and emerging startups are investing heavily in high-energy CT suites following costly recalls, prompting the development of a domestic ecosystem of service providers and scanner integrators. Workforce development remains a constraint; however, accelerated programs are helping to narrow the skills gap. Battery and EV NDT market participants leverage cross-border technology transfers, blending U.S. AI platforms with Asian hardware.
Europe advances on a dual track of high-end manufacturing and circular-economy initiatives. Premium marques, such as BMW and Mercedes-Benz, deploy multi-method inspections that exceed global norms, while EU sustainability directives stimulate NDT demand for reuse and recycling certification. Investments in field-deployable systems rise as second-life markets develop. The Middle East and Africa see early-stage adoption concentrated in charging infrastructure, whereas South America’s nascent cell plants in Brazil and Argentina integrate inspection capability from day one to align with export goals. Collectively, regional diversification mitigates supply chain risks and spreads best-practice standards across the battery and EV NDT markets.

Competitive Landscape
The battery and EV NDT market remains moderately fragmented yet trends toward consolidation. Legacy industrial titans—Olympus, Waygate Technologies, Yxlon, and Nikon Metrology—capitalize on vast installed bases and cross-industry expertise, offering end-to-end portfolios that encompass scanners, probes, software, and long-term service agreements. Specialized innovators focus on niche challenges, such as Zetec’s ceramic-electrolyte eddy-current arrays or Sonatest’s solid-state ultrasonic modules.
Technology convergence plays a decisive role in competitive positioning. Vendors integrate CT, ultrasonic, and eddy-current technologies in unified platforms governed by AI analytics, delivering immediate pass-fail verdicts and SPC dashboards. Cloud-enabled data lakes enable gigafactory teams to benchmark defect trends across sites, although cybersecurity remains a procurement hurdle. Patent filings topped 200 in 2024, signaling a race to secure IP around high-speed scanning, adaptive AI models, and automated cell handling.
Merger-and-acquisition momentum is reshaping boundaries. Olympus’s USD 85 million purchase of Advanced Battery Diagnostics expands its footprint in electrochemical impedance.[4]Olympus Corporation, “Advanced Battery Diagnostics Acquisition Announcement,” olympus-global.com Waygate’s VC battery launch positions the firm at the center of in-line inspection deployments. Mistras Group’s Battery Excellence Center exemplifies a service differentiation strategy. Strategic alliances, such as Zetec’s partnership with Tesla, combine OEM process expertise with innovative inspection methods, reducing time-to-qualification cycles. Against this backdrop, vendors that marry hardware reliability, AI accuracy, and global service depth secure mindshare with giga-factory planners.
Battery & EV NDT Industry Leaders
Olympus Corporation
Waygate Technologies (Baker Hughes Company)
Eddyfi Technologies (Previan)
Zetec Inc.
Mistras Group Inc.
- *Disclaimer: Major Players sorted in no particular order

Recent Industry Developments
- September 2025: Waygate Technologies introduced its VCbattery system with AI-enabled multi-modal inspection at 30 cells per minute, cutting false positives by 60%.
- August 2025: Olympus completed the USD 85 million acquisition of Advanced Battery Diagnostics, adding impedance spectroscopy and thermal imaging assets.
- July 2025: Zetec partnered with Tesla to co-develop eddy-current probes for ceramic electrolytes in solid-state batteries.
- June 2025: Yxlon unveiled the FF85 CT scanner rated at 450 kV for full pack inspection up to 800 kg.


Global Battery & EV NDT Market Report Scope
| Equipment |
| Software |
| Services |
| Ultrasonic Testing |
| Radiographic Testing |
| Magnetic Particle Testing |
| Liquid Penetrant Testing |
| Visual Inspection Testing |
| Eddy-Current Testing |
| Acoustic Emission Testing |
| Thermography / Infrared Testing |
| Computed Tomography Testing |
| Battery Cell Manufacturing |
| Battery Pack Assembly |
| In-Vehicle High Voltage System |
| Electric Powertrain Components |
| Charging Infrastructure Components |
| North America | United States | |
| Canada | ||
| Mexico | ||
| South America | Brazil | |
| Argentina | ||
| Rest of South America | ||
| Europe | Germany | |
| United Kingdom | ||
| France | ||
| Italy | ||
| Spain | ||
| Rest of Europe | ||
| Asia Pacific | China | |
| Japan | ||
| India | ||
| South Korea | ||
| South-East Asia | ||
| Rest of Asia Pacific | ||
| Middle East and Africa | Middle East | Saudi Arabia |
| United Arab Emirates | ||
| Turkey | ||
| Rest of Middle East | ||
| Africa | South Africa | |
| Nigeria | ||
| Rest of Africa | ||
| By Component | Equipment | ||
| Software | |||
| Services | |||
| By Testing Method | Ultrasonic Testing | ||
| Radiographic Testing | |||
| Magnetic Particle Testing | |||
| Liquid Penetrant Testing | |||
| Visual Inspection Testing | |||
| Eddy-Current Testing | |||
| Acoustic Emission Testing | |||
| Thermography / Infrared Testing | |||
| Computed Tomography Testing | |||
| By Application | Battery Cell Manufacturing | ||
| Battery Pack Assembly | |||
| In-Vehicle High Voltage System | |||
| Electric Powertrain Components | |||
| Charging Infrastructure Components | |||
| By Geography | North America | United States | |
| Canada | |||
| Mexico | |||
| South America | Brazil | ||
| Argentina | |||
| Rest of South America | |||
| Europe | Germany | ||
| United Kingdom | |||
| France | |||
| Italy | |||
| Spain | |||
| Rest of Europe | |||
| Asia Pacific | China | ||
| Japan | |||
| India | |||
| South Korea | |||
| South-East Asia | |||
| Rest of Asia Pacific | |||
| Middle East and Africa | Middle East | Saudi Arabia | |
| United Arab Emirates | |||
| Turkey | |||
| Rest of Middle East | |||
| Africa | South Africa | ||
| Nigeria | |||
| Rest of Africa | |||


Key Questions Answered in the Report
What is the projected value of the battery and EV NDT market by 2030?
It is forecast to reach USD 1.75 billion in 2030 based on a 19.77% CAGR between 2025 and 2030.
Which component segment currently leads revenue?
Services, which account for 59.9% of 2024 revenue, reflect demand for specialized inspection expertise.
Which testing method is growing fastest?
Eddy-current testing is expanding at a 22.4% CAGR through 2030, as subsurface flaw detection gains prominence.
Why is Asia-Pacific the largest regional market?
Concentrated giga-factory investments in China, Japan, and South Korea, combined with stringent safety regulations, give the region 42.1% of global revenue.
How are OEM recalls influencing the adoption of inspection technology?
High recall costs have accelerated investment in high-energy CT systems capable of detecting internal cell defects before vehicles ship.
Page last updated on:


