
Market Overview
| Study Period | 2020 - 2031 |
|---|---|
| Forecast Data Period | 2026 - 2031 |
| Base Year Market Size (2025) | USD 185.68 Million |
| Market Size (2026) | USD 201.33 Million |
| Market Size (2031) | USD 301.78 Million |
| Growth Rate (2026 - 2031) | 8.44 % |
| Market Concentration | Medium |
Major Players *Disclaimer: Major Players sorted in no particular order Image © Mordor Intelligence. Reuse requires attribution under CC BY 4.0. | |
Australia Nuclear Imaging Market Analysis by Mordor Intelligence
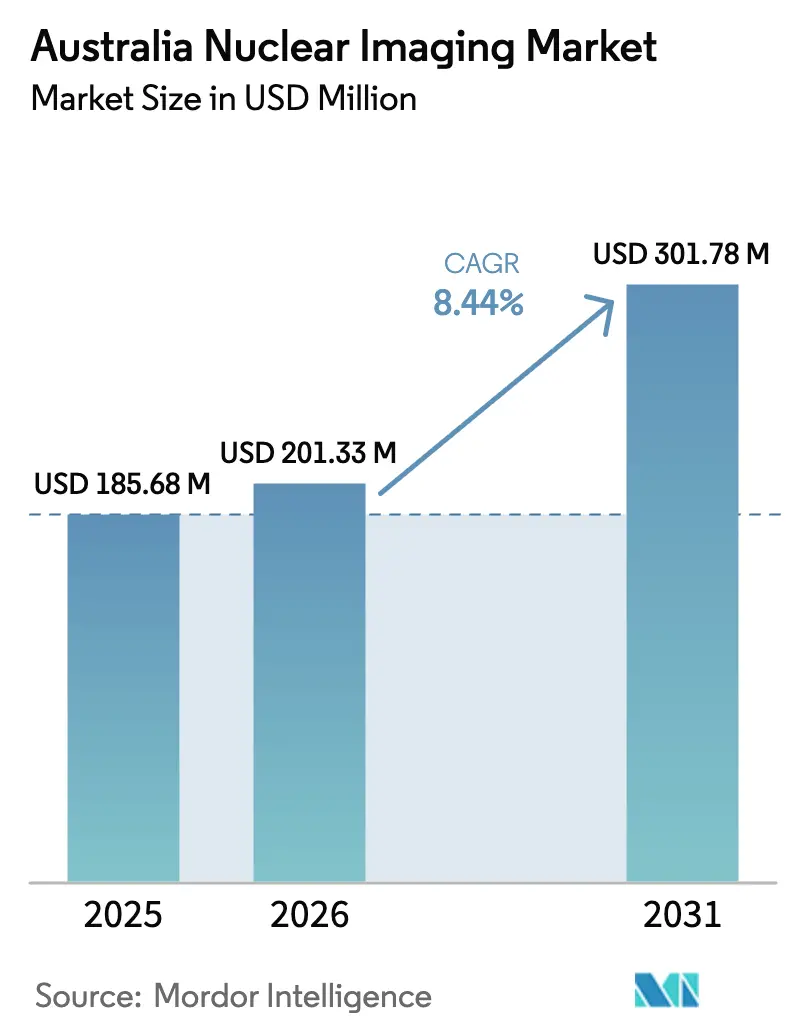
The Australia nuclear imaging market size is expected to grow from USD 185.68 million in 2025 to USD 201.33 million in 2026 and is forecast to reach USD 301.78 million by 2031 at 8.44% CAGR over 2026-2031. Rising cancer incidence, expanding public-hospital replacement cycles for SPECT and PET scanners, and generous reimbursement under the Medicare Benefits Schedule are steering sustained capital investment. A sovereign isotope supply chain anchored by the Lucas Heights reactor safeguards clinical continuity, while private-sector innovation in theranostics broadens treatment pathways. Meanwhile, federal policy measures such as the PBS co-payment freeze and the March 2025 MBS update reinforce patient access and underpin procedure growth. Nonetheless, workforce shortages and occasional Mo-99 supply disruptions temper near-term expansion of the Australia nuclear imaging market.
Key Report Takeaways
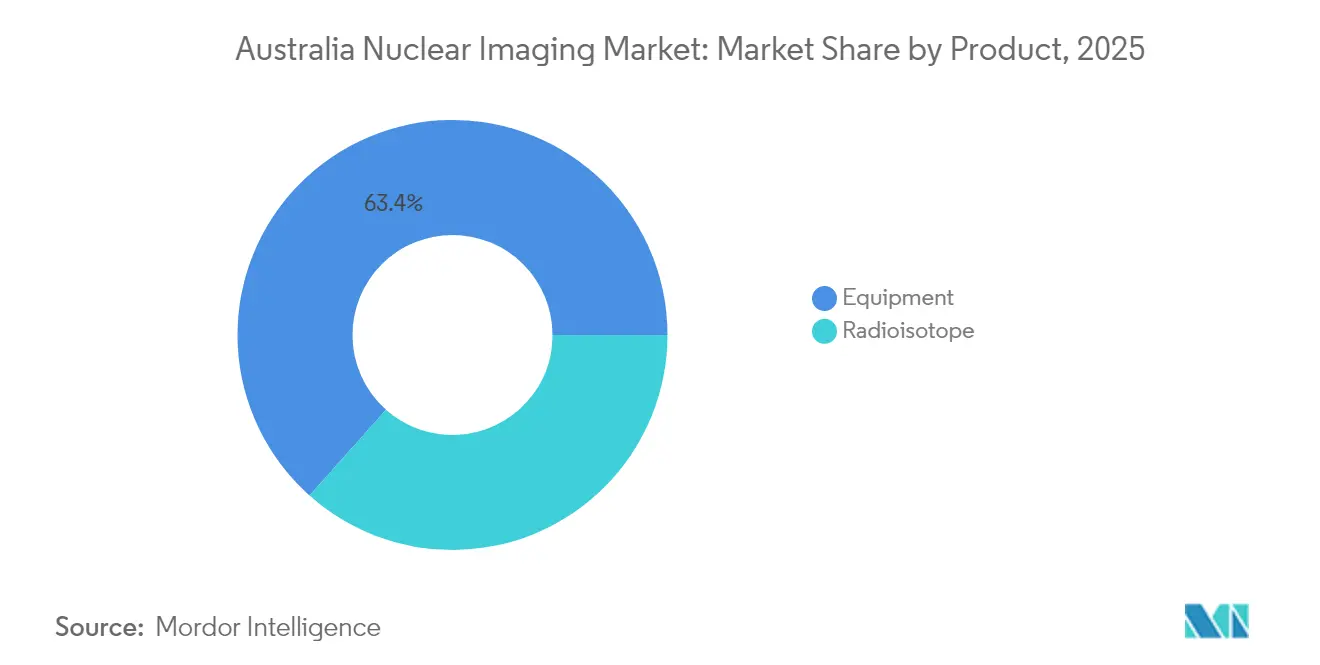
- By product, equipment led with a 63.42% revenue share in 2025; radioisotopes are projected to expand at an 8.78% CAGR through 2031.
- By application, cardiology accounted for 38.31% of the Australia nuclear imaging market share in 2025, while neurology is advancing at an 8.71% CAGR to 2031.
- By end user, hospitals controlled 68.92% of the Australia nuclear imaging market size in 2025 and diagnostic imaging centers are set to grow at a 8.86% CAGR over the forecast period.
Note: Market size and forecast figures in this report are generated using Mordor Intelligence’s proprietary estimation framework, updated with the latest available data and insights as of 2026.
Australia Nuclear Imaging Market Trends and Insights
Drivers Impact Analysis*
| Driver | (~) % Impact on CAGR Forecast | Geographic Relevance | Impact Timeline |
|---|---|---|---|
| Growing oncology PET-CT demand | +2.1% | National, concentrated in Sydney, Melbourne, Brisbane | Medium term (2-4 years) |
| Increasing public-hospital SPECT upgrades | +1.8% | National, priority in NSW and Victoria | Short term (≤ 2 years) |
| Expansion of cyclotron-based F-18 supply | +1.5% | Major metropolitan areas | Medium term (2-4 years) |
| Federal funding for Theranostics centres | +1.3% | National, early gains in major cities | Long term (≥ 4 years) |
| AI-enabled image reconstruction efficiency | +1.0% | National, technology-advanced facilities | Medium term (2-4 years) |
| Decentralised generator tech for remote sites | +0.8% | Regional Australia, remote territories | Long term (≥ 4 years) |
| Source: Mordor Intelligence | |||
Growing Oncology PET-CT Demand
Cancer prevalence and evolving treatment algorithms continue to lift procedure volumes, with ANSTO facilitating 10,000–12,000 nuclear medicine studies every week. The recent FDA nod for Telix’s Gozellix PSMA agent intensifies focus on precision prostate imaging. Integration of theranostic protocols, highlighted by Lutetium-177 PSMA-617 trials at Peter MacCallum Cancer Centre, cements demand for high-end PET-CT scanners. Hospitals are expanding cyclotron access to ensure F-18 FDG availability, reducing delivery risk across state borders. As oncology shifts toward individualized therapy, PET-CT capacity becomes a strategic differentiator within the Australia nuclear imaging market.
Increasing Public-Hospital SPECT Upgrades
Medicare guidelines that cap scanner lifespan at 10 years trigger predictable replacement waves. State procurement clusters combine volumes to negotiate favorable pricing, accelerating adoption of AI-ready SPECT technology. Upgraded systems lower radiopharmaceutical dose and shrink scan times, allowing departments to accommodate rising referrals despite specialist shortages. The mandatory coverage rule—where outdated units lose MBS eligibility—pressures administrators to modernize and sustains revenue visibility for vendors across the Australia nuclear imaging market.
Expansion of Cyclotron-Based F-18 Supply
The 110-minute half-life of F-18 challenges long-distance distribution; localized cyclotrons in Queensland and Western Australia now complement Lucas Heights output. This hub-and-spoke network delivers same-day isotopes to secondary cities, shortening patient waitlists and unlocking incremental PET throughput. Private investors view distributed production as a hedge against reactor downtime, thereby reinforcing the resilience of the Australia nuclear imaging market.
Federal Funding for Theranostics Centres
Canberra’s targeted grants have seeded dedicated theranostic units in Melbourne, Sydney and Brisbane, enabling one-stop diagnostic-plus-therapy workflows. Early-stage trials with scandium-47 and terbium-161 show compelling tumor targeting, prompting the Therapeutic Goods Administration to accelerate review timelines. Public-private consortia straddling research and clinical care shorten commercialization cycles and position Australia as an Asia-Pacific reference site for novel radiopharmaceuticals.
Restraints Impact Analysis*
| Restraint | (~) % Impact on CAGR Forecast | Geographic Relevance | Impact Timeline |
|---|---|---|---|
| Mo-99 global supply-chain fragility | -1.2% | National; acute in remote areas | Short term (≤ 2 years) |
| Capital-equipment budget constraints | -0.9% | Public hospitals; regional | Medium term (2-4 years) |
| Short specialist workforce pipeline | -0.7% | National; severe in regional | Long term (≥ 4 years) |
| Radio-pharma waste-disposal compliance costs | -0.5% | Major facilities | Medium term (2-4 years) |
| Source: Mordor Intelligence | |||
Mo-99 Global Supply-Chain Fragility
The February 2023 safety incident at Lucas Heights temporarily halted domestic Mo-99 output and forced emergency imports, prompting schedule backlogs nationwide. Because Mo-99 decays within 66 hours, even brief outages jeopardize cardiac imaging services that rely on 99mTc generators. Domestic reliance on a single reactor remains a structural risk until cyclotron-based alternatives or LEU-fueled reactors scale commercially. Contingency stockpiling is limited, making consistent isotope access a fragile linchpin for the Australia nuclear imaging market.
Capital-Equipment Budget Constraints
High-spec PET-CT and total-body scanners exceed USD 6 million per unit, testing state budget ceilings amid competing MRI and trauma-care priorities. Smaller hospitals stretch life cycles beyond recommended benchmarks, which may erode image quality and reimbursement eligibility. Private operators confront similar financing hurdles, evidenced by recent consolidation moves to unlock scale economies. The resulting procurement delays could slow the replacement cadence that fuels vendor revenue in the Australia nuclear imaging market.
*Our forecasts treat driver/restraint impacts as directional, not additive. The impact forecasts reflect baseline growth, mix effects, and variable interactions.
Segment Analysis
By Product: Equipment Dominance Drives Infrastructure Investment
Equipment captured 63.42% of 2025 revenue as hospitals refreshed legacy SPECT cameras and added high-end digital PET-CT units. GE HealthCare’s rollout of total-body scanners at Peter MacCallum Cancer Centre exemplifies migration toward ultra-low-dose platforms. The Australia nuclear imaging market size for radioisotopes, though smaller today, is expanding swiftly on an 8.78% CAGR trajectory through 2031, propelled by theranostic isotopes such as Cu-64 and Ac-225. Domestic suppliers benefit from ANSTO’s GenTech 99mTc generators, while Clarity Pharmaceuticals’ copper-based pipeline adds competitive depth.
Innovation in compact cyclotrons and decentralized generator systems opens new addressable pockets in regional Australia. Foreign OEMs like Siemens Healthineers maintain share through bundled service contracts, yet rising sovereign capability in detector manufacturing is gradually diversifying the supply base. The combination of equipment leadership and isotope growth sustains a balanced revenue mix within the Australia nuclear imaging market.

By Application: Cardiology Leadership Amid Neurology Growth
Cardiology held 38.31% of 2025 revenue owing to entrenched protocols for myocardial perfusion scans reimbursed under MBS item 55146. However, neurology is pacing ahead at an 8.71% CAGR as aging demographics lift dementia assessments. Oncology remains structurally significant, especially after Illuccix gained an expanded TGA indication for therapy selection, reinforcing theranostic uptake.
Emerging applications include endocrine imaging and infection mapping, each leveraging new tracers entering early clinical stages. AI-driven reconstruction tools have improved small-lesion detectability, indirectly enlarging addressable volumes across all specialties. The Australia nuclear imaging market share balance is expected to tilt modestly toward neurology and oncology by 2031 as precision-medicine protocols gain mainstream acceptance.
By End User: Hospital Concentration Supports Diagnostic Center Growth
Hospitals accounted for 68.92% of 2025 expenditure because complex isotope handling and multidisciplinary care favor campus-based settings. Major tertiary centers bundle research, training and clinical delivery, reinforcing purchasing clout with OEMs. Diagnostic imaging centers, though smaller, are the fastest-growing channel at a 8.86% CAGR as health systems redirect low-acuity scans to ambulatory environments for cost efficiency.
Private equity interest—illustrated by Affinity’s AUD 658 million buyout of Lumus Imaging—signals confidence in scalable outpatient models. Academic institutes contribute niche demand tied to early-phase trials, leveraging ANSTO’s Innovation Precinct for isotope access. Collectively, diversified end-user channels fortify resilience in the Australia nuclear imaging market.

Geography Analysis
New South Wales and Victoria dominate activity, anchored by Sydney’s Lucas Heights reactor and Melbourne’s oncology research cluster. Combined, the two states process a majority of national nuclear medicine procedures, reflecting population density and capital-intensive infrastructure. Queensland and Western Australia are closing the gap; Brisbane’s Princess Alexandra Hospital and Perth’s Sir Charles Gairdner Hospital now run full PET-CT suites supported by regional cyclotrons that offset F-18 logistics challenges.
Tasmania and the Northern Territory rely on mainland isotope shipments via temperature-controlled freight and tight scheduling to overcome half-life decay. The rollout of mobile SPECT units is improving rural outreach, aligning with federal equity mandates. Western Australia’s Sandy Ridge disposal site offers sovereign low-level waste capacity, easing compliance risk for facilities nationwide.
Looking ahead, planned theranostic hubs in Adelaide and Canberra are expected to diffuse expertise beyond the eastern seaboard. Telecommunications upgrades underpin tele-nuclear-medicine consults, enabling specialist oversight of remote scans in real time. Together, these initiatives reinforce geographically balanced growth within the Australia nuclear imaging market.
Regulatory Landscape
Nuclear imaging in Australia is governed by two main regulatory tracks. The Therapeutic Goods Administration (TGA) regulates imaging equipment as medical devices (including relevant active medical devices) under the Therapeutic Goods (Medical Devices) Regulations 2002, while radiopharmaceuticals are regulated as prescription medicines by the TGA. Radiation safety oversight is reinforced through ARPANSA and state and territory radiation licensing frameworks covering possession, transport, and clinical use, which creates practical multi-jurisdiction compliance requirements for providers operating across borders.
A near-term compliance anchor for device suppliers is the commencement of Unique Device Identification (UDI) requirements from 1 July 2026, which increases labeling, system, and data-management obligations for manufacturers and sponsors supplying imaging devices. Separately, the TGA consultation information paper released in May 2026 on radiopharmaceutical regulation points to ongoing policy focus at the medicines oversight and radiation controls interface, with potential implications for development pathways and release logistics for new tracers used in PET and SPECT.
Value Chain Analysis
Australia's nuclear imaging value chain begins upstream with isotope production and radiochemistry, anchored by ANSTO at Lucas Heights. ANSTO produces a substantial portion of domestic medical radioisotopes and supplies generator-based and reactor-produced isotopes into the clinical network. This upstream capability is increasingly complemented by specialized manufacturing and translation capacity, including Telix Manufacturing Solutions in North Melbourne and entX's Advanced Radioisotope Manufacturing Facility in Adelaide, which support precursor handling, radiolabeling, and readiness for scaled clinical supply.
Midstream actors include global imaging OEMs supplying SPECT and PET-CT platforms and associated service contracts, along with software vendors improving reconstruction and workflow performance. Downstream delivery depends on accredited nuclear medicine departments in hospitals and imaging centers, supported by professional and standards bodies such as the Australian and New Zealand Society of Nuclear Medicine (ANZSNM) and the Australian Association of Nuclear Medicine Specialists (AANMS). These groups shape practice consistency, training expectations, and clinical adoption of new radiopharmaceutical protocols.
Competitive Landscape
ANSTO’s significant share of isotope supply secures a semi-monopolistic upstream position, while global OEMs such as GE HealthCare and Siemens Healthineers drive equipment innovation. Telix Pharmaceuticals and Clarity Pharmaceuticals illustrate a vibrant domestic biotech cohort, each advancing targeted radiopharmaceuticals with international licensing footprints.
Technology partnerships remain a core competitive lever; GE HealthCare’s total-body PET-CT alliance with Peter MacCallum Cancer Centre is a case in point. AI start-up Harrison.ai, whose software touches half of Australian radiologists, is reshaping diagnostic workflow economics. On the isotope front, strategic pacts—such as Telix and Eckert & Ziegler’s Actinium-225 venture—secure scarce alpha emitters critical for next-wave therapies.
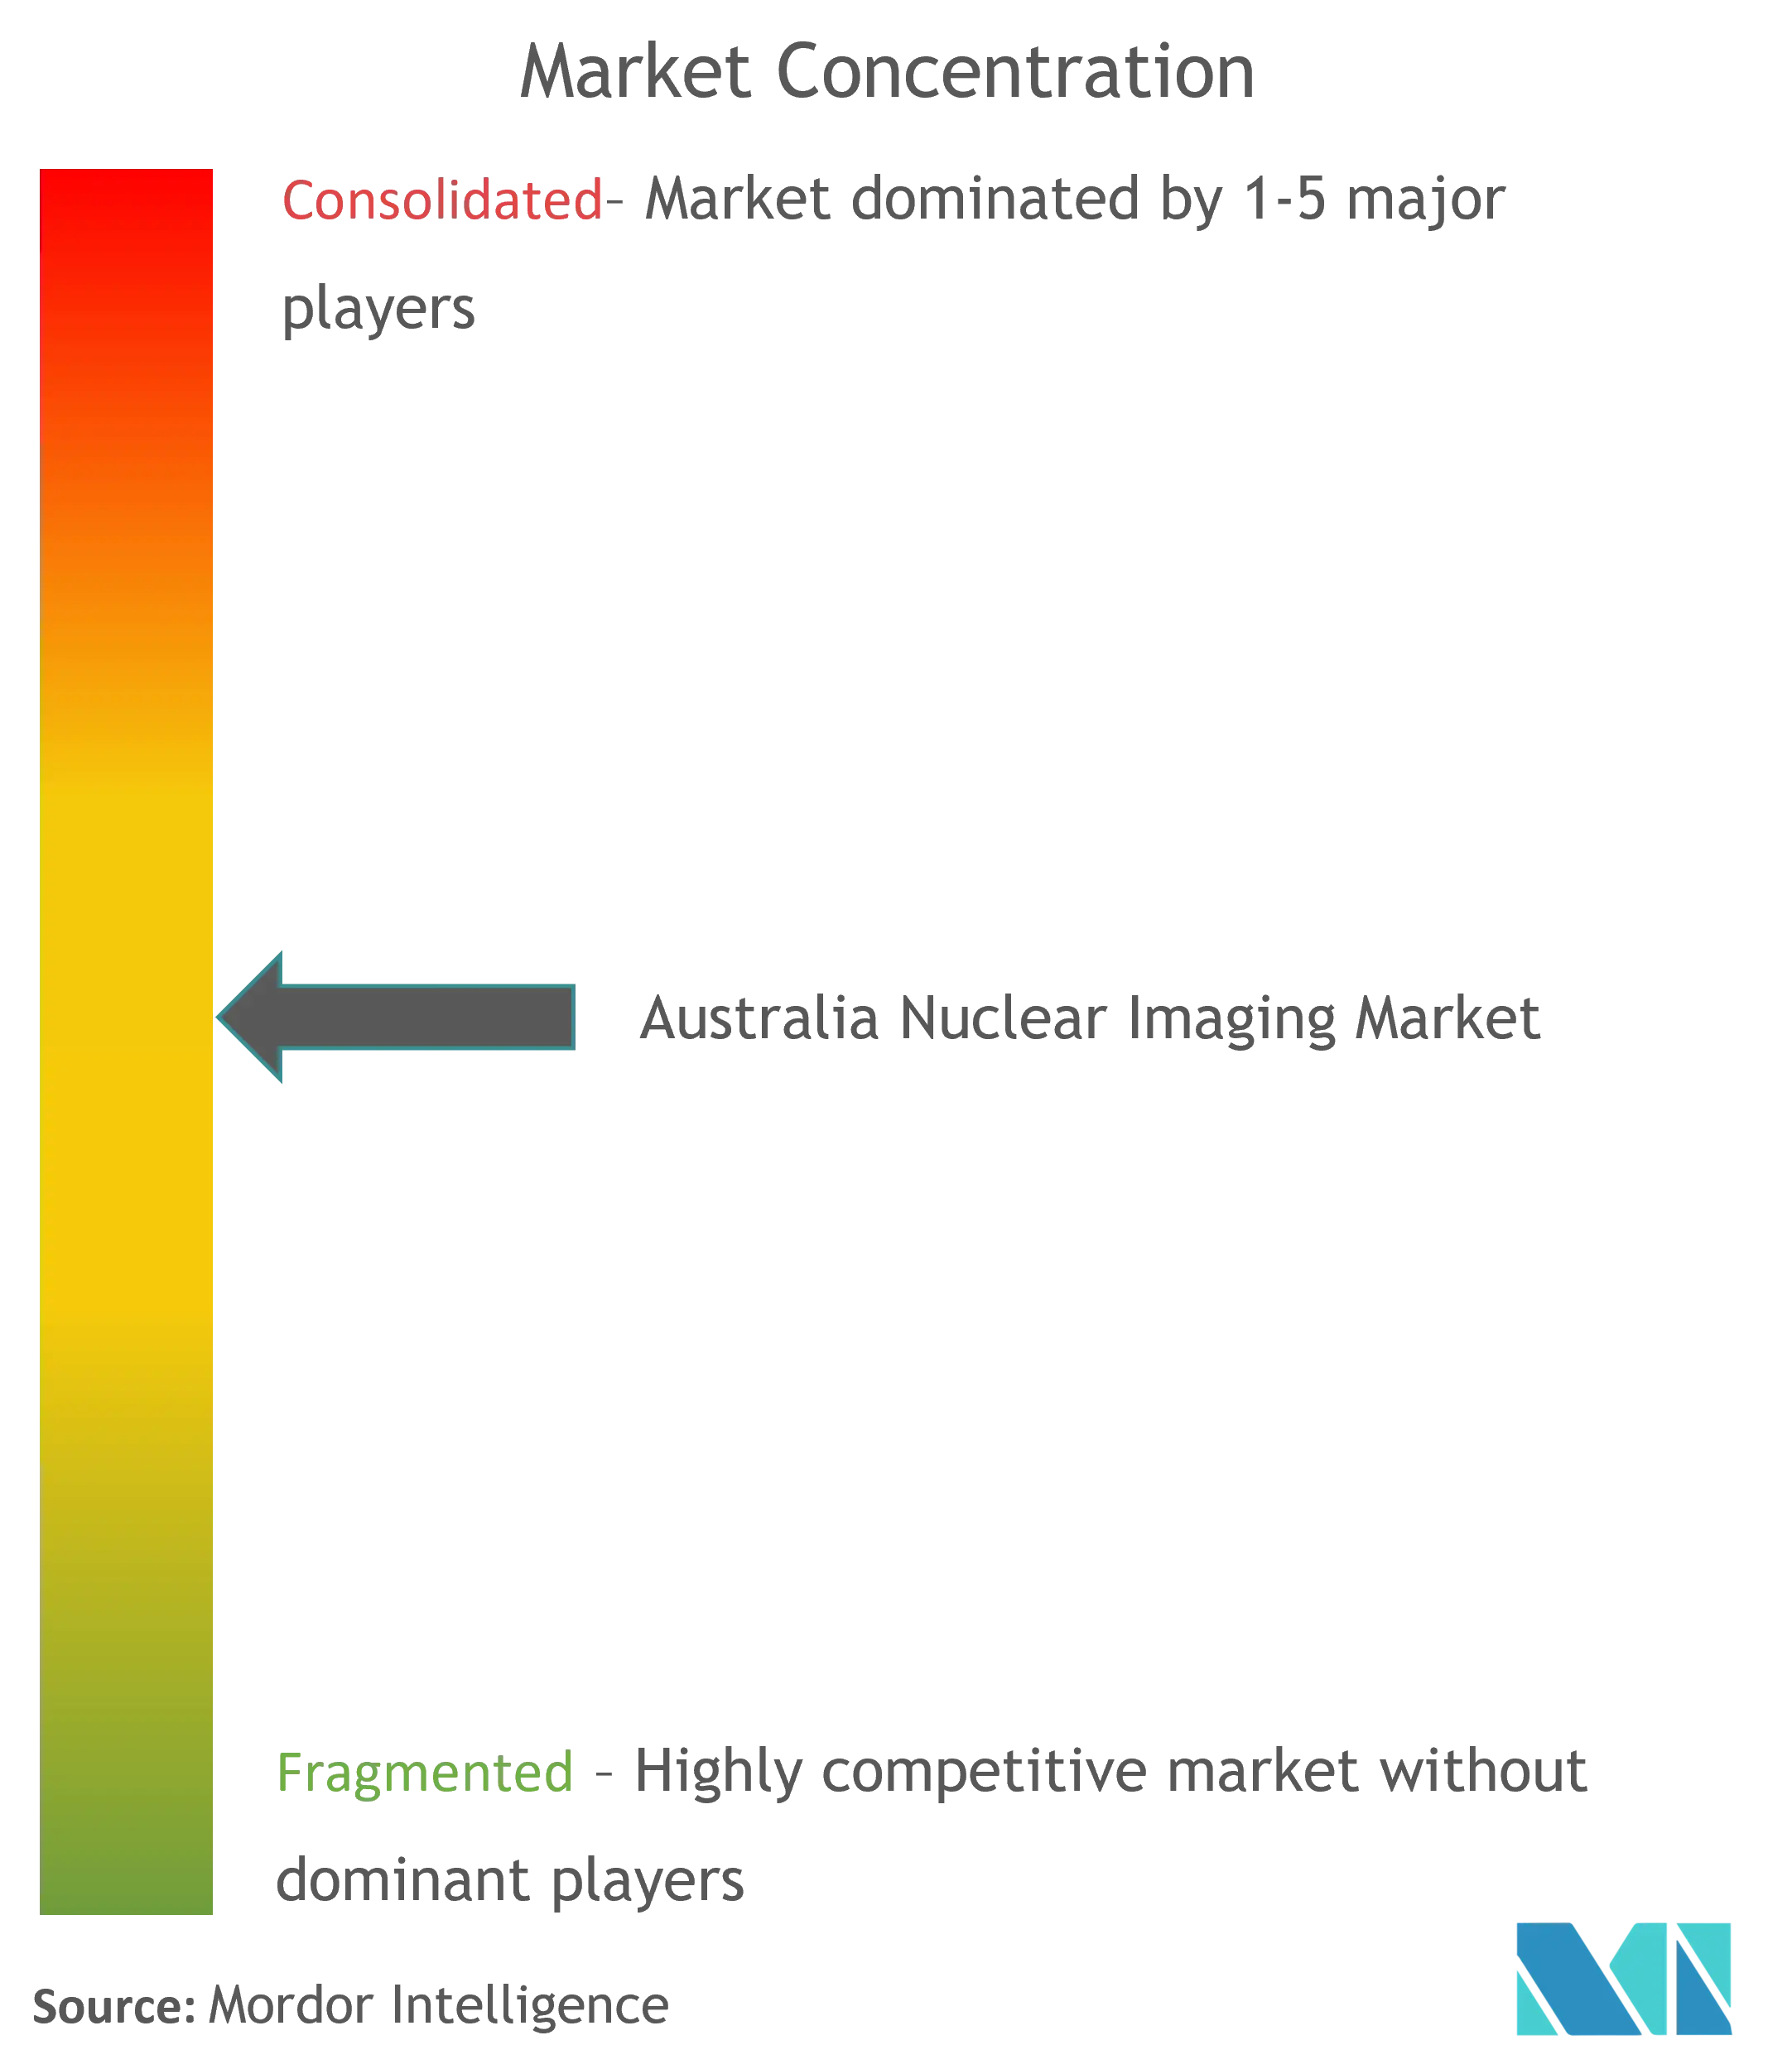
Market entry barriers remain high due to regulatory controls over radiation safety and capital-intensive assets. However, novel generator technologies and decentralized cyclotrons lower threshold footprints for regional operators, broadening competitive participation. Overall, the Australia nuclear imaging market balances concentrated isotope supply with an increasingly dynamic ecosystem of equipment, software and radiopharmaceutical innovators.
Australia Nuclear Imaging Industry Leaders
-
GE Healthcare
-
Siemens Healthineers AG
-
Koninklijke Philips N.V.
-
Canon Inc. (Canon Medical Systems Corporation)
-
Bayer AG
- *Disclaimer: Major Players sorted in no particular order
Market Opportunities and Future Outlook
Sovereign radiopharmaceutical manufacturing and localized supply resilience remain clear whitespace, with capacity build-out and company positioning pointing to near- and mid-term execution. Telix's integrated Telix Manufacturing Solutions facility in North Melbourne (July 2026) supports domestic infrastructure across radiochemistry, clinical product manufacturing, and patient dose administration, while entX's Advanced Radioisotope Manufacturing Facility in Adelaide adds specialist capability for radioisotope precursors. At the same time, ANSTO's Lucas Heights role as the upstream isotope hub keeps continuity and scaling of locally produced isotopes central to hospital and diagnostic-network planning.
Theranostics-driven tracer breadth also creates space for both suppliers and imaging providers to expand procedure offerings when approvals, trials, and supply lines align. The April 2026 Telix and Regeneron radiopharmaceutical collaboration points to continued pipeline investment in solid-tumor programs, while clinical use and trials involving Lutetium-177 and constrained-supply alpha emitters such as Actinium-225 highlight the need for secured sourcing, compliant manufacturing, and site-level capability. On the technology side, TGA approvals in 2026 for software that enables diagnostic-quality images from shorter scans and/or lower doses create a practical route for sites to raise throughput and broaden access using existing PET/PET-CT infrastructure, particularly where capital budgets and workforce constraints slow equipment expansion.
Recent Industry Developments
- July 2026: Telix Pharmaceuticals opened the Telix Manufacturing Solutions North Melbourne facility, an integrated radiochemistry, clinical product manufacturing, and patient dose administration site. The development expands domestic radiopharmaceutical manufacturing capacity and bolsters the Australian supply chain for radiopharmaceuticals. The opening improves national readiness to support rising demand for radiopharmaceutical products and accelerates access to theranostic therapies.
- June 2026: 4DMedical received Therapeutic Goods Administration approval for CT:VQ software. The approval enables non-contrast ventilation perfusion imaging via existing CT infrastructure. It strengthens imaging capabilities and efficiency without new hardware investments.
- March 2026: Claritas NucMed Technologies received TGA approval for the Claritas iPET software device. The approval improves diagnostic PET/PET-CT/MRI image quality with shorter scans or lower radiation. It advances software-enabled imaging performance within Australia's nuclear imaging ecosystem.
Research Methodology Framework and Report Scope
Market Definition and Coverage
This market covers spending tied to nuclear imaging in Australia, including nuclear imaging systems and the radioisotopes used for PET and SPECT procedures, across key care settings in each state.
Scope exclusions: We exclude non-nuclear modalities (such as MRI, CT, ultrasound, and X-ray), along with radiation therapy equipment and surgical imaging tools.
Segmentation Overview
- By Product
- Equipment
- Radioisotope
- SPECT Radioisotopes
- Technetium-99m (TC-99m)
- Thallium-201 (TI-201)
- Gallium (Ga-67)
- Iodine (I-123)
- Other SPECT Radioisotopes
- PET Radioisotopes
- Fluorine-18 (F-18)
- Rubidium-82 (RB-82)
- Other PET Radioisotopes
- SPECT Radioisotopes
- By Application
- Cardiology
- Neurology
- Thyroid
- Oncology
- Other Applications
- By End User (Value)
- Hospitals
- Diagnostic Imaging Centres
- Academic & Research Institutes
Data Sources, Market Sizing, and Validation
Desk Research
Desk research was used to set the factual base, so the model starts from a realistic procedure and capacity view rather than only device shipment stories. We relied on public healthcare statistics and reimbursement references, such as the Australian Institute of Health and Welfare, Medicare Benefits Schedule schedule items, the Pharmaceutical Benefits Scheme information pages, and the Australian Bureau of Statistics population and age profiles.
To keep the state view practical, we also reviewed hospital and health department publications (where available), peer-reviewed clinical literature on PET and SPECT use patterns, and regulator and safety guidance around radiopharmaceutical handling. Company annual reports and investor materials were used to understand installation activity and service reach, and paid subscriptions for company financials, patent databases, and an import-export shipment level database were used only as supporting checks. These desk sources are illustrative and not exhaustive, since many other documents were also used for collection, clarification, and cross-checking.
Primary Interviews and Surveys
Primary work focused on validating how volumes and pricing actually behave by state, because utilization can differ between large metro catchments and smaller regional networks. We spoke with a mix of hospital imaging decision makers, radiopharmacy and nuclear medicine operators, and independent imaging center managers. Follow-up checks were then used to close gaps on isotope availability, scan mix, and typical budgeting cycles.
Distribution of primary research fieldwork respondents
| Company type | Respondent position |
|---|---|
| Top tier: 34% | CXOs: 14% |
| Mid tier: 51% | Functional/Unit leaders: 35% |
| Smaller Players: 15% | Managers: 51% |
Market-Sizing & Forecasting
The sizing started with a top-down build that reconstructs demand from the addressable procedure pool and funding signals, and then converts that demand into dollars through typical price points for scans and radiopharmaceutical use by modality. Since state differences matter, population aging, cancer incidence direction, and the practical availability of PET and SPECT capacity were treated as key inputs, along with Medicare Benefits Schedule coverage behavior and replacement cycles for public hospital equipment.
Those totals were then cross-checked with selective bottom-up approximations, such as sampled site level utilization ranges, channel checks on equipment installation activity, and simple ASP times volume calculations for common tracer use cases. For smaller states where public data was limited, we used ratio based estimates linked to population and specialist service availability, then adjusted them only when interviews flagged a clear mismatch. Forecasts were built using scenario analysis, varying procedure growth, reimbursement stability, and isotope supply reliability within bounds that experts considered plausible.
Data Validation & Update Cycle
Model outputs were checked against independent signals so that no single data series dominated the final number, and unusual movements were investigated before sign-off. We ran variance checks across states, compared implied scans per capita against reasonable ranges, and reviewed pricing assumptions against reimbursement and typical contracting patterns.
Before publication, the work goes through multi-step analyst review, followed by targeted re-contacts when a metric shifts sharply or a new policy, funding, or supply event changes the outlook. Reports are refreshed annually, and interim updates are made when material events occur. Right before delivery, a final pass is completed so clients receive the most current view available.
Mordor Intelligence's Australia States Nuclear Imaging Market Size Versus Other Published Estimates
Published market sizes for nuclear imaging in Australia can differ even when the same years are referenced, because each study makes its own choices on what revenue streams are counted and how procedure demand is translated into dollars. Differences usually come from whether equipment and radiopharmaceuticals are both included, how state level activity is treated, and how currency timing and pricing changes are handled.
The main gap comes from scope, where Mordor Intelligence counts both imaging systems and radioisotopes used in PET and SPECT, and then ties growth to procedure-driven demand and reimbursement linked pricing rather than blending in broader diagnostic imaging services or adjacent radiopharmaceutical therapy revenues.
Benchmark comparison
| Source | Market Size | Gaps in Research Methodology |
|---|---|---|
| Mordor Intelligence | USD 185.68 M (2025) | |
| Industry Data Portal A | USD 174.87 M (2026) | Uses a later base year with a slower growth profile, and it is not clear if equipment revenue is included alongside isotope consumption, which can compress the reported total. |
| Health Services Report B | USD 6.30 B (2026) | Covers the full diagnostic imaging services industry and bundles nuclear medicine with multiple modalities and service lines, which inflates the figure versus a nuclear-imaging-only scope. |
The spread in the table is mostly explained by what is being counted and how the demand proxy is chosen. When scope is kept strictly on nuclear imaging equipment plus PET and SPECT isotopes, and when procedure and reimbursement signals are used as the main anchors, the resulting market size stays traceable to repeatable inputs rather than broad service revenue pools.
Key Questions Answered in the Report
What is the 2026 value of the Australia nuclear imaging market?
It is valued at USD 201.33 million with a forecast to reach USD 301.78 million by 2031 at an 8.44% CAGR over 2026-2031.
Which segment is growing fastest within the Australia nuclear imaging space?
Radioisotopes are expanding at an 8.78% CAGR, driven by theranostic demand.
Why are neurology procedures gaining traction?
An aging population and rising neurodegenerative disease prevalence are lifting neurology PET and SPECT scan volumes.
How does Australia maintain isotope supply security?
A sovereign production base at Lucas Heights, complemented by regional cyclotrons, underpins domestic availability.
What policy measures support patient access?
The PBS co-payment freeze and updated Medicare Benefits Schedule maintain affordability and reimburse modern equipment.