
Market Overview
| Study Period | 2021 - 2031 |
|---|---|
| Forecast Data Period | 2026 - 2031 |
| Base Year Market Size (2025) | 28.45 gigawatt |
| Market Volume (2026) | 31.33 gigawatt |
| Market Volume (2031) | 50.78 gigawatt |
| Growth Rate (2026 - 2031) | 10.14 % |
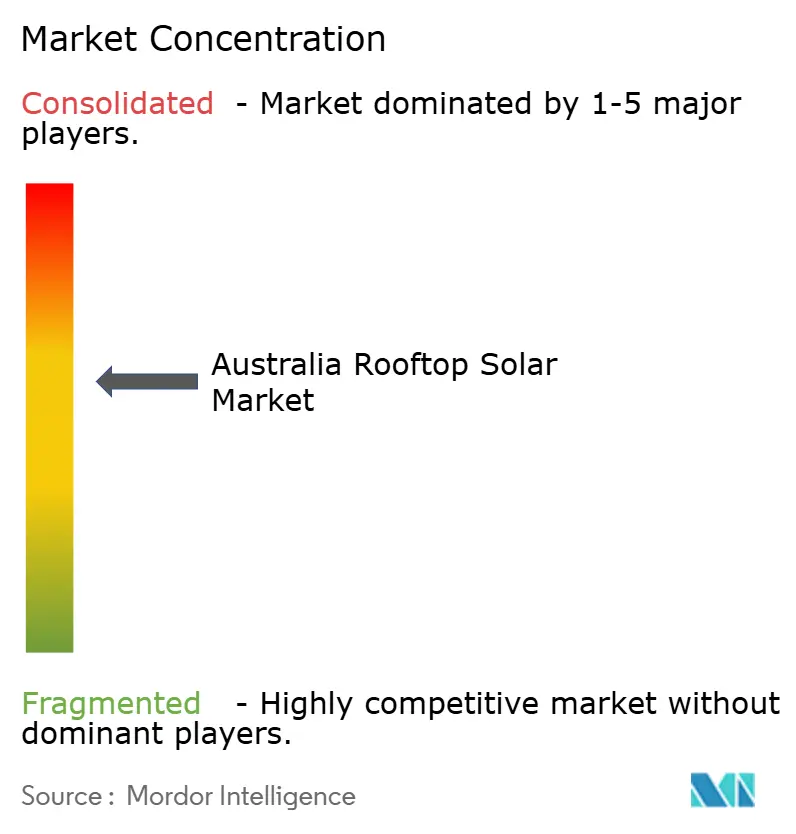
| Market Concentration | Medium |
Major Players *Disclaimer: Major Players sorted in no particular order Image © Mordor Intelligence. Reuse requires attribution under CC BY 4.0. | |
Australia Rooftop Solar Market Analysis by Mordor Intelligence
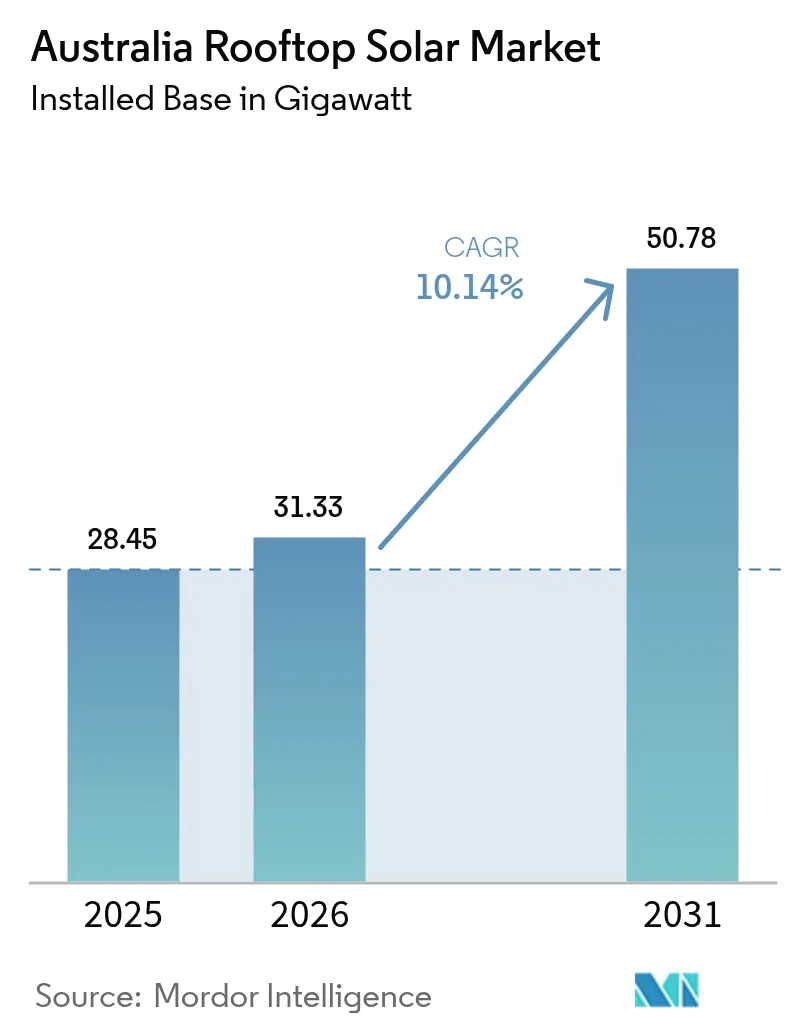
Australia Rooftop Solar Market size in 2026 is estimated at 31.33 gigawatt, growing from 2025 value of 28.45 gigawatt with 2031 projections showing 50.78 gigawatt, growing at 10.14% CAGR over 2026-2031.
This expansion elevates distributed generation from a helpful supplement into a key pillar of national electricity supply, already contributing more than 12% of grid power in 2025. Growth is propelled by a progressive policy mix, lower equipment costs, battery uptake, and rapid technological advances, while the federal Solar Sunshot program steers supply-chain localisation. Network operators are transitioning from static to dynamic operating envelopes, which raise export ceilings and enable higher rooftop penetration, notably in South Australia, where the 10 kW export limit is being addressed. Commercial momentum, expanding virtual power plant participation, and larger average system sizes indicate an accelerating shift from residential dominance toward diversified, service-oriented business models across the Australian rooftop solar market.
Key Report Takeaways
- By panel technology, mono-PERC panels commanded a 69.35% revenue share of the Australian rooftop solar market in 2025, whereas heterojunction and TOPCon are forecasted to grow at a 16.3% CAGR to 2031.
- By system size, the 5 to 10 kW range captured 44.20% of Australia's rooftop solar market size in 2025; the 30 to 100 kW band is projected to expand at a 13.9% CAGR between 2026-2031.
- By ownership model, outright purchase held 78.85% of Australia's rooftop solar market share in 2025; however, community solar and VPP aggregation are expected to grow fastest at a 19.1% CAGR to 2031.
- By end user, the residential segment accounted for 67.10% of Australia's rooftop solar market share in 2025, while commercial and industrial installations are set to post the fastest growth at 12.05% CAGR through 2031.
- Queensland led in total installations with more than 1 million systems in 2024, but South Australia delivered the highest penetration at 10.7% of the state's electricity demand.
Note: Market size and forecast figures in this report are generated using Mordor Intelligence’s proprietary estimation framework, updated with the latest available data and insights as of 2026.
Australia Rooftop Solar Market Trends and Insights
Drivers Impact Analysis*
| Driver | (~) % Impact on CAGR Forecast | Geographic Relevance | Impact Timeline |
|---|---|---|---|
| Declining PV & battery costs | +2.8% | National, with early gains in Queensland, NSW, Victoria | Medium term (2-4 years) |
| SRES & state-level rebates continuity | +2.1% | National, enhanced in Victoria, NSW, ACT | Short term (≤ 2 years) |
| Rising retail tariffs shortening payback | +1.9% | National, most pronounced in SA, Victoria | Short term (≤ 2 years) |
| Virtual-power-plant (VPP) program uptake | +1.4% | SA leading, expanding to Victoria, NSW | Medium term (2-4 years) |
| Mandatory climate-reporting for C&I roofs | +1.2% | National, concentrated in major cities | Long term (≥ 4 years) |
| Solar Sunshot Program & local mfg push | +0.8% | National, focused on NSW Hunter Valley, SA | Long term (≥ 4 years) |
| Source: Mordor Intelligence | |||
Declining PV & Battery Costs
Combined module and storage prices continue falling. The average home solar payback period dropped below five years in 2024, while battery packs approached AUD 10,000, encouraging paired installations. CSIRO’s perovskite research achieved 11% efficiency on printed cells, signalling future cost declines via roll-to-roll manufacturing.[1]CSIRO, “Printed flexible solar cell milestone,” csiro.au Price deflation coincides with rising retail tariffs, thereby accelerating the adoption of both products across households and businesses. With virtual power plant revenue stacking, batteries now generate grid services income that further shortens returns. Cost trends, therefore, underpin a self-reinforcing adoption loop in the Australian rooftop solar market.
SRES & State-Level Rebates Continuity
The federal Small-scale Renewable Energy Scheme remains in force to 2030, underwriting certificate income that de-risks purchases. Victoria’s battery rebate and NSW’s Empowering Homes package add upfront discounts that sway system sizing decisions. These layered incentives lift installation volumes, stabilise installer pipelines, and steer buyers toward larger arrays that future-proof consumption. Consistent rebate rules across jurisdictions reduce stop-start cycles and sustain installer employment, anchoring growth in the Australian rooftop solar market.
Rising Retail Tariffs Shortening Payback
Wholesale electricity costs rose 83% in 2024, following coal retirements and increased peak-demand volatility. Concurrently, feed-in tariffs slid to 3 c/kWh, shifting value from export to self-consumption. The tariff gap makes rooftop solar the cheapest retail supply option, particularly for businesses exposed to demand charges. Enterprises therefore pursue solar-plus-storage to cap exposure to high spot prices, reinforcing the commercial growth runway across the Australian rooftop solar market.
Virtual-Power-Plant (VPP) Program Uptake
South Australia’s VPP demonstrates aggregated value, pooling more than 1 MW of home batteries for frequency response services. Victoria has 700,000 eligible rooftops, providing the critical mass for statewide orchestration. Participation generates new revenue streams that boost residential economies and opens up merchant models for aggregators. Expansion into small businesses broadens capacity under management, tapping idle battery assets during work hours and boosting resilience to blackouts nationwide.
Restraints Impact Analysis*
| Restraint | (~) % Impact on CAGR Forecast | Geographic Relevance | Impact Timeline |
|---|---|---|---|
| Grid export limits & congestion | -1.8% | SA, Victoria leading, spreading to Queensland, NSW | Short term (≤ 2 years) |
| Import-linked supply-chain volatility | -1.2% | National, affecting all segments equally | Medium term (2-4 years) |
| Ageing early systems needing retrofits | -0.9% | National, concentrated in early adoption areas | Medium term (2-4 years) |
| Tougher fire-safety / building codes | -0.6% | National, with stricter enforcement in Victoria, NSW | Short term (≤ 2 years) |
| Source: Mordor Intelligence | |||
Grid Export Limits & Congestion
High-penetration feeders experience voltage rise and thermal constraints that compel dynamic export caps. South Australian trials across 2,835 inverters verified software limits that safeguard stability while returning AUD 250 annually to a 10 kW system. AEMO earmarked AUD 16 billion for transmission upgrades to absorb renewable peaks.[2]Australian Energy Market Operator, “2025 Integrated System Plan,” aemo.com.au Until these lines are built, rooftop export ceilings limit revenue, prompting households to opt for batteries and curbing unconstrained growth in the Australian rooftop solar market.
Import-Linked Supply-Chain Volatility
Rooftop panels remain 99% import-dependent, leaving installers vulnerable to freight hikes and geopolitical shocks. The AUD 1 billion Solar Sunshot initiative aims to localise module assembly in the Hunter Valley and South Australia, with SunDrive trialling copper-based cells at pilot scale. Yet domestic polysilicon and glass facilities are years away, so currency swings and shipping delays can inflate costs and elongate project cycles, tempering the otherwise strong demand trajectory.
*Our forecasts treat driver/restraint impacts as directional, not additive. The impact forecasts reflect baseline growth, mix effects, and variable interactions.
Segment Analysis
By Panel Technology: Next-Generation Efficiency Disrupts Mono-PERC Leadership
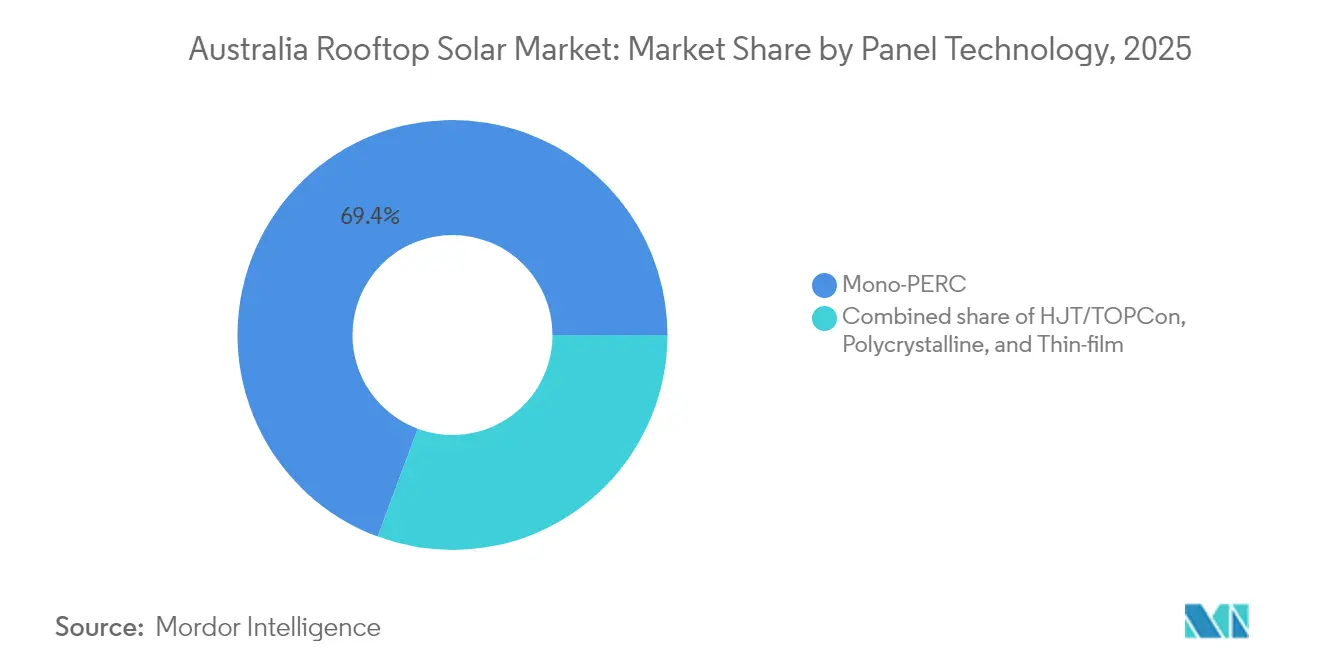
Mono-PERC cells delivered 69.35% of system shipments in 2025, maintaining a price-performance sweet spot. Yet, heterojunction and TOPCon lines are scaling swiftly, registering a 16.3% CAGR to 2031 and edging towards parity on a $/W installed basis. Lifespans above 30 years and temperature coefficients below 0.3% per °C drive commercial site preference for these higher-efficiency modules. Polycrystalline shares continue to contract due to lower efficiency, while thin-film technology positions itself in weight-constrained structures.
SunDrive’s copper-plated heterojunction cell has reached commercial pilot runs with Trina, opening a local high-efficiency supply. CSIRO’s printed flexible cell roadmap targets building-integrated photovoltaic cladding that could revolutionise supermarkets and warehouses. Maxeon’s 24.1% IBC module offering launched in Q3 2024 anchors the premium residential segment. Technology choices, therefore, revolve around space constraints, degradation rates, and embodied-carbon goals, steering differentiation within the Australian rooftop solar market.



By System Size: Mid-Range Dominance Faces Commercial Scaling
Systems between 5 kW and 10 kW secured 44.20% of Australia's rooftop solar market share in 2025, reflecting typical suburban roof space and electricity use. Average installs hit 9.9 kW that year as households future-proofed for electric vehicles. Simultaneously, the 30 to 100 kW commercial class is forecast to register the fastest growth, with a 13.9% CAGR, fueling capacity uplift among warehouses, schools, and shopping centers. The up to 5 kW tier is being phased out as small-scale tariffs decline, while the 10 to 30 kW tier suits boutique commercial premises and larger homes.
Large roofs above 100 kW, though a smaller count, yield outsized megawatt additions. Smart inverters in this bracket participate in frequency markets, monetising otherwise curtailed energy. Businesses cluster charging stations under solar canopies, coupling daytime photovoltaic output with fleet electrification strategies. Module efficiencies near 24% reduce the surface area for a given wattage, allowing tighter footprints to accommodate higher ratings and enhancing the mid-range class's appeal. Thus, size dynamics continue to diversify as the Australian rooftop solar market matures.
By Ownership Model: Community Solar Disrupts Traditional Purchase Patterns
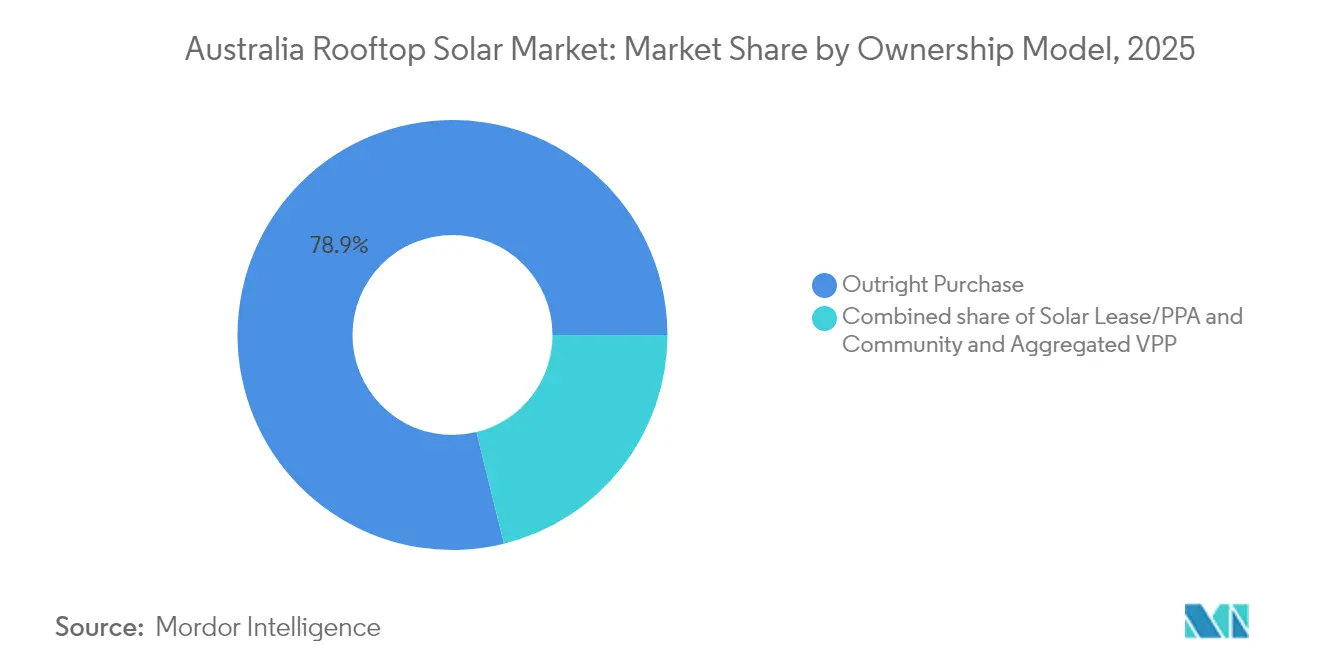
Outright purchase retained a 78.85% share of the Australian rooftop solar market in 2025, underpinned by rebate frameworks that reward owner-operators. Yet community projects, leases, and PPAs are chipping away at this dominance. Community and VPP aggregation shows a 19.1% CAGR, granting apartment tenants and renters access to shared arrays. Leases eliminate upfront costs, and PPAs provide cheaper power than the grid without requiring a capital outlay.
RACV’s commercial VPP product bundles battery hardware, grid services, and maintenance into a single bill, illustrating the shift in service. Developers of build-to-rent housing add communal rooftop arrays with transparent allocation of kilowatt-hours to tenants. As retail margins tighten, electricity retailers are integrating solar hardware bundles into their tariff plans, creating stickier relationships and generating data-rich customer insights. These models collectively reduce inequality in solar access and diversify revenue streams across the Australian rooftop solar market.
By End User: Commercial Momentum Challenges Residential Dominance
Residential rooftops accounted for 67.10% of installed capacity and revenues in 2025, driven by accessible financing and widespread installer networks. However, mandatory climate-reporting rules drive corporations to publicise scope-2 emissions cuts, spurring a 12.05% CAGR for commercial and industrial arrays through 2031. Commercial projects benefit from daytime load alignment and demand charge avoidance, generating superior internal rates of return compared to households. Retrofit activity is rising among 2010-era homes that require inverter swaps or size expansions, opening a secondary market. Companies are layering batteries onto solar to sell frequency response, deepening the value proposition and tilting the Australian rooftop solar market toward business-led deployments.
Commercial estates also unlock bundled energy-management contracts that combine solar, storage, and efficiency retrofits. Supermarket groups, breweries, and cold-storage operators are prime adopters, aligning rooftop output with refrigeration loads to hedge volatile wholesale power. Leasing and power-purchase agreements shift capital off balance sheets, allowing firms to claim decarbonization without upfront cash. This convergence of disclosure pressure, tariff arbitrage, and finance innovation accelerates the commercial share of capacity additions in the Australian rooftop solar market.
Geography Analysis
Queensland counted more than 1 million rooftop systems and 3.8 GW of capacity in 2024, maintaining numerical leadership on the back of abundant irradiance and business-friendly feed-in structures. Brisbane’s suburban sprawl provides ample roof surface, while regional councils streamline permitting. New South Wales added 970 MW during 2024 as Sydney households and inland agribusinesses chase hedge value amid volatile wholesale prices. Victoria, an early adopter state, is now pivoting to battery incentives that boost self-consumption ratios and trigger two-stage retrofits on mature homes.
South Australia leads the way in penetration, at 10.7% of overall consumption, thanks to its strong solar resource and early policy support, making the state a live laboratory for dynamic export limit trials. Western Australia’s isolated South West Interconnected System necessitates a more nuanced balancing of rooftop generation with limited interconnection, prompting the development of battery and demand-response schemes. Tasmania’s hydro dominance reduces solar urgency, yet niche off-grid communities adopt hybrid diesel-PV-battery microgrids to reduce fuel logistics costs.
AEMO’s integrated system plan earmarks AUD 16 billion for new inter-state lines that lift rooftop hosting capacity and strengthen east-to-west power flows. Queensland commissioned the country’s first commercial solar panel recycling plant in October 2024, tackling looming waste streams and retaining valuable materials such as silver and silicon. The Solar Sunshot program clusters pilot module lines in NSW’s Hunter Valley, leveraging existing materials know-how, while South Australia nurtures inverter and battery assembly. These geographic nuances shape policy, infrastructure, and industry development vectors within the Australian rooftop solar market.
Regulatory Landscape
Australia’s rooftop solar is governed by the Small-scale Renewable Energy Scheme (SRES), overseen by the Clean Energy Regulator (CER), with additional constraints from state retail and network settings as well as national product and connection standards. In 2024, the CER appointed Solar Accreditation Australia (SAA) as the installer accreditation operator, tightening credentialing pathways linked to STC eligibility and consumer protections.
Technical compliance requirements have been progressively tightened across inverters and modules. From August 2025, new inverter applications were required to comply with AS/NZS 4777.2:2020 Amendment 2:2024, while May 2026 introduced higher module listing standards via IEC 61730:2023 under the Clean Energy Council (CEC) product program. In parallel, Renewable Energy Legislation Amendment Regulations 2026 updated provisions relevant to battery-connected small generation units and the Cheaper Home Batteries Program. The Solar Sharer Offer framework also advanced within the 2026-27 Default Market Offer settings to better align consumer tariffs with high midday solar generation.
Competitive Landscape
Competition remains fragmented among thousands of accredited installers, resulting in tight margins for simple residential systems. Chinese module giants Trina, Jinko, and LONGi dominate the supply, yet product differentiation arises from warranty lengths, degradation guarantees, and smart inverter integration. Premium niche vendors such as Maxeon and REC capture high-efficiency demand segments. Origin Energy is vertically integrating by co-investing with SunDrive in heterojunction pilot fabrication, creating a home-grown technology pathway.
Retail energy incumbents bundle rooftop packages with electricity tariffs to defend customer bases. AGL repurposes land at retired coal plants into recycling hubs, differentiating on circular-economy credentials. Specialized EPCs focusing on commercial rooftops deploy energy-management software that taps demand-response revenue, raising the bar for integrated offerings across the Australian rooftop solar market.
Virtual power plant operators represent an emerging competitor category. RACV leverages its automotive club membership to cross-sell solar-battery bundles, while Amber Electric’s spot-price-linked retail plan dynamically manages customer batteries to capture arbitrage opportunities. Installers who can couple hardware with software and finance now win tenders from corporates seeking turnkey decarbonization. The ongoing tightening of AS/NZS 4777.2 inverter standards favors technically adept players, gradually weeding out small-scale installers and inching the market toward moderate consolidation.
Australia Rooftop Solar Industry Leaders
Trina Solar
JinkoSolar
LONGi Green Energy
Maxeon (SunPower)
Canadian Solar
- *Disclaimer: Major Players sorted in no particular order

Market Opportunities and Future Outlook
Australia’s installed base creates a clear pipeline for upgrades, storage attachment, and orchestration. Replacement activity has grown as a larger share of small-scale solar deployments move through their next maintenance and enhancement cycle, supporting inverter swaps, mounting upgrades, higher-efficiency modules, and battery-ready redesigns. This trend sits alongside tightening technical requirements and the CEC product program, which supports bundled compliant hardware, commissioning, and after-sales monitoring.
Commercial and service-led models also gain more usable roof area as rooftop solar integrates into grid operations and tariff design. In 2026, policy and operational focus is shifting toward interoperable consumer energy devices and demand-side coordination, including the federal move in the 2026-27 Budget for the Clean Energy Regulator to function as a National Technical Regulator to improve interoperability and national standards. Storage propositions remain active as Cheaper Home Batteries Program settings evolve, including May 2026 adjustments that tighten subsidy criteria for larger batteries, which supports more optimized system sizing and retailer-aggregator offerings tied to self-consumption and grid services.
Recent Industry Developments
- May 2026: The Australian federal government announced that the Clean Energy Regulator will function as the National Technical Regulator under the 2026-27 Budget, enabling harmonized standards for rooftop solar and storage across states. This shift points to a more centralized approach to interoperability and certification for the sector.
- August 2025: ARENA launched the Rooftop Solar and Storage Acceleration program, funding partnerships to deploy integrated systems in commercial buildings across multiple states. The program signals an acceleration of storage-enabled rooftop solar uptake.
- October 2024: Trina Solar and SunDrive formed a joint venture in Australia to accelerate high-efficiency heterojunction solar cell production. The move aligns with broader efforts to localize parts of the rooftop solar supply chain and diversify sourcing.


Research Methodology Framework and Report Scope
Market Definition and Coverage
For this report, we define the Australia rooftop solar market as grid-connected solar PV systems installed on rooftops, measured as cumulative installed capacity in gigawatts (GW) across homes and businesses.
Scope exclusions: utility-scale ground-mounted solar farms and off-grid rooftop systems are not counted in this market size.
Segmentation Overview
- By Panel Technology
- Mono-PERC
- HJT/TOPCon
- Polycrystalline
- Thin-film (CdTe/Perovskite)
- By System Size
- Up to 5 kW
- 5 to 10 kW
- 10 to 30 kW
- 30 to 100 kW
- 100 to 1 MW
- By Ownership Model
- Outright Purchase
- Solar Lease/PPA
- Community and Aggregated VPP
- By End User
- Residential
- Commercial and Industrial
Data Sources, Market Sizing, and Validation
Desk Research
Desk research sets the base structure of the model, so we can map what is installed, where it is installed, and how fast additions are happening. We mainly use public energy statistics and policy publications to understand installation trends, grid connection rules, and incentive design, which then helps avoid mixing rooftop PV with large-scale solar.
Key references include sources such as the Clean Energy Regulator (small-scale installation and certificate activity), the Australian PV Institute and OpenNEM (rooftop PV outputs and penetration signals), the Australian Energy Regulator and AEMO publications (network connection and distributed energy outlook), and Australian Bureau of Statistics releases (building, housing, and business activity used for demand context). We also review company filings, investor presentations, industry association websites, and reputable press for confirmation on system sizing ranges and adoption behavior, and then use a paid subscription for company financials and a patent database to support technology trend checks. These sources are illustrative only, and many other references were also used to collect data, validate assumptions, and clarify market boundaries.
Primary Interviews and Surveys
Primary work is used to pressure-test our assumptions on what counts as rooftop capacity, how systems are classified by size, and how ownership models are treated in reporting. We speak with installers, EPC and O&M service providers, equipment distributors, utilities and network-facing stakeholders, and commercial site decision-makers across Australia so gaps in public reporting can be filled with grounded context.
Distribution of primary research fieldwork respondents
| Company type | Respondent position |
|---|---|
| Top tier: 26% | CXOs: 16% |
| Mid tier: 56% | Functional/Unit leaders: 31% |
| Smaller Players: 18% | Managers: 53% |
Market-Sizing & Forecasting
We size the market in GW by rebuilding the rooftop installed base from official small-scale installation signals and then carrying that stock forward with yearly additions and retirements. A top-down and bottom-up mix is used, where national registration and commissioning patterns are first translated into cumulative installed rooftop capacity, and then corroborated with selective channel checks to avoid over-counting.
To keep the model tied to real installation behavior, inputs include annual rooftop additions, typical system size by customer type, the split of residential versus commercial and industrial rooftops, and the share of systems by common size bands (for example, up to 5 kW and 5-10 kW), which changes how quickly capacity compounds. Policy and grid factors are treated as drivers, so feed-in settings, connection constraints, and distributed energy program momentum are tracked and applied as scenario levers. Where bottom-up views have missing coverage, the gaps are filled using conservative ranges that are then rechecked in interviews before totals are finalized.
For forecasting, scenario analysis is used because rooftop adoption can shift quickly with electricity prices, incentive settings, and installer capacity. Final forecast paths are adjusted after expert feedback aligns on the likely pace of additions and realistic shifts toward larger system sizes.
Data Validation & Update Cycle
We validate outputs through consistency checks across multiple independent signals, and then look for breaks in trend that cannot be explained by policy, grid conditions, or adoption dynamics. When a variance is detected, the input series is rechecked, and follow-up calls are triggered to confirm whether the change is structural or timing-related.
Before sign-off, the model and assumptions go through multi-step analyst reviews so units, definitions, and time-series continuity remain consistent. Reports are refreshed annually, with interim updates for material events, and then a final pre-delivery pass is completed so clients receive the most current view.
Mordor Intelligence's Australia Rooftop Solar Market Size Compared With Other Published Estimates
Published rooftop solar market sizes often differ because the unit of measurement is not always consistent, and the boundary between rooftop PV and broader solar categories can be drawn differently. Variations also show up when one estimate reflects cumulative installed capacity, while another reports annual additions or converts capacity into a value figure using assumed system costs.
The table highlights how unit selection and scope definition can shift totals. In Mordor Intelligence's model, the number represents cumulative installed rooftop PV capacity in Australia (GW) for grid-connected systems, with utility-scale solar farms and off-grid rooftops left outside the scope.
Benchmark comparison
| Source | Market Size | Gaps in Research Methodology |
|---|---|---|
| Mordor Intelligence | USD 28.45 B (2025) | |
| Industry Association A | USD 5.90 B (2025) | This figure appears closer to annual new installations or annual spending, rather than a cumulative installed base, which reduces the reported size versus a stock measure. |
| Energy Analytics B | USD 43.10 B (2026) | This estimate likely applies higher per-kW cost assumptions when converting capacity into USD and may blend rooftop PV with adjacent solar categories, which increases the total. |
Overall, the spread is mostly explained by whether the publisher is counting cumulative operating rooftop capacity versus annual flows, and whether the number is expressed as GW or converted into USD using assumed system costs. Our approach stays traceable to installation and commissioning signals, and it is then cross-checked with size-band mixes and expert feedback so the series is repeatable and easy to validate.


Key Questions Answered in the Report
What is the current capacity of the Australia rooftop solar market?
Installed rooftop capacity reached 31.33 GW in 2026 and is forecast to climb to 50.78 GW by 2031.
How fast is the commercial segment growing compared with residential?
Commercial and industrial rooftops are projected to expand at a 12.05% CAGR, outpacing the overall market’s 10.14% growth.
Which system size dominates new installations?
Arrays between 5 kW and 10 kW hold 44.20% of 2025 installations, but 30 to 100 kW systems show the fastest growth.
What technologies are overtaking mono-PERC panels?
Heterojunction and TOPCon modules are gaining share at a 16.3% CAGR thanks to higher efficiencies.
How important are virtual-power-plants to future growth?
VPP participation adds revenue from grid services, raising battery returns and supporting widespread adoption, especially in South Australia and Victoria.
Is local manufacturing expected to reduce supply-chain risk?
Yes, the AUD 1 billion Solar Sunshot scheme and partnerships such as SunDrive-Trina aim to establish domestic module lines and lessen import dependency over the next five years.
Page last updated on:





