
Market Overview
| Study Period | 2020 - 2031 |
|---|---|
| Forecast Data Period | 2026 - 2031 |
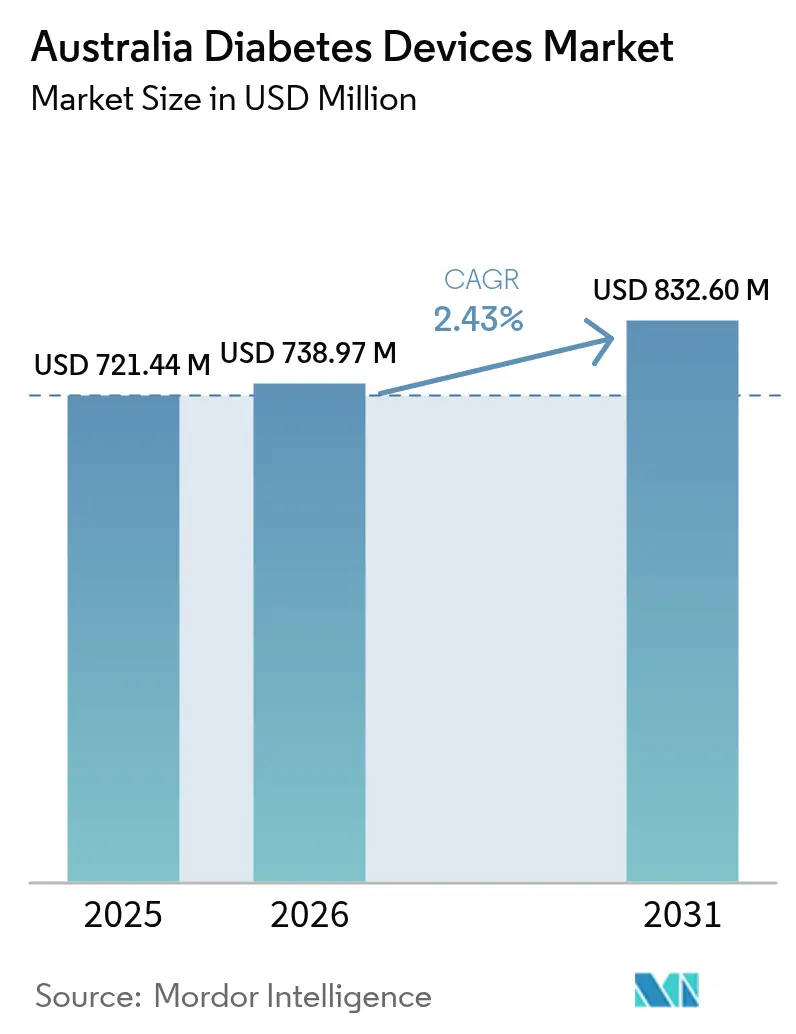
| Base Year Market Size (2025) | USD 721.44 Million |
| Market Size (2026) | USD 738.97 Million |
| Market Size (2031) | USD 832.6 Million |
| Growth Rate (2026 - 2031) | 2.43 % |
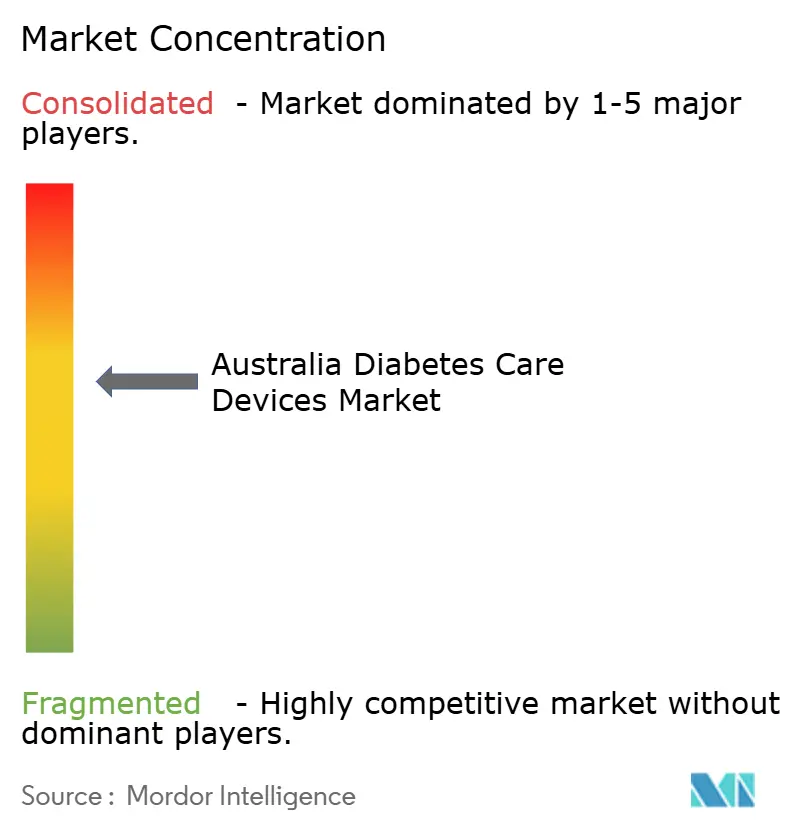
| Market Concentration | Medium |
Major Players *Disclaimer: Major Players sorted in no particular order Image © Mordor Intelligence. Reuse requires attribution under CC BY 4.0. | |
Australia Diabetes Devices Market Analysis by Mordor Intelligence
The Australia diabetes devices market size was valued at USD 721.44 million in 2025 and estimated to grow from USD 738.97 million in 2026 to reach USD 832.6 million by 2031, at a CAGR of 2.43% during the forecast period (2026-2031). The Australia diabetes devices market size reflects a mature reimbursement environment, strong clinician acceptance of real-time glucose data, and steady technological upgrades that keep replacement cycles active. Wider National Diabetes Services Scheme (NDSS) subsidies for continuous glucose monitoring (CGM), the shift toward automated insulin delivery, and rising type 2 diabetes prevalence are underpinning demand. Integrated digital health infrastructure—especially universal electronic health records—reduces onboarding barriers for new devices and promotes data-driven care pathways. Global manufacturers are intensifying local partnerships to marry device ecosystems with the My Health Record platform, while start-ups concentrate on pain-free diagnostics aimed at underserved groups. Competitive momentum now centers on linking glucose data to broader cardiometabolic platforms, a move likely to reshape procurement criteria over the next five years.
Key Report Takeaways
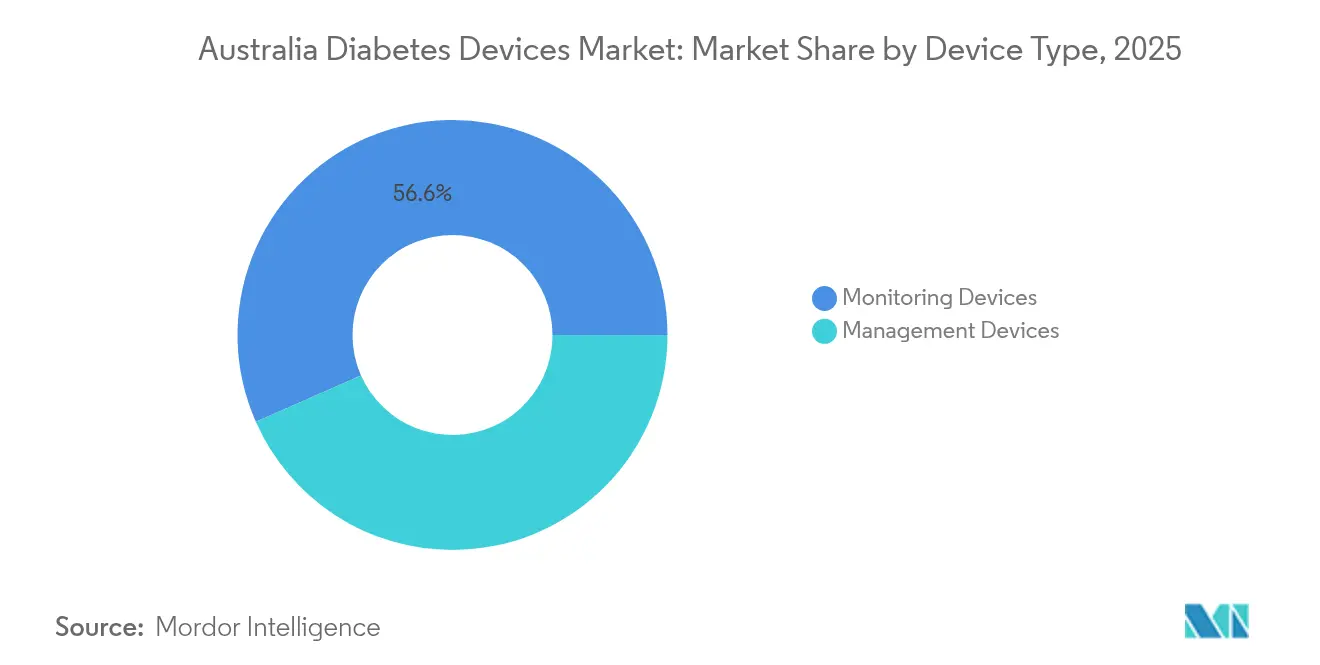
- By device type, monitoring devices led with 56.62% of Australia diabetes devices market share in 2025; management devices are projected to post the fastest 3.01% CAGR to 2031.By end user, hospitals accounted for 47.85% share of the Australia diabetes devices market size in 2025, while home-care settings are advancing at a 2.91% CAGR through 2031.
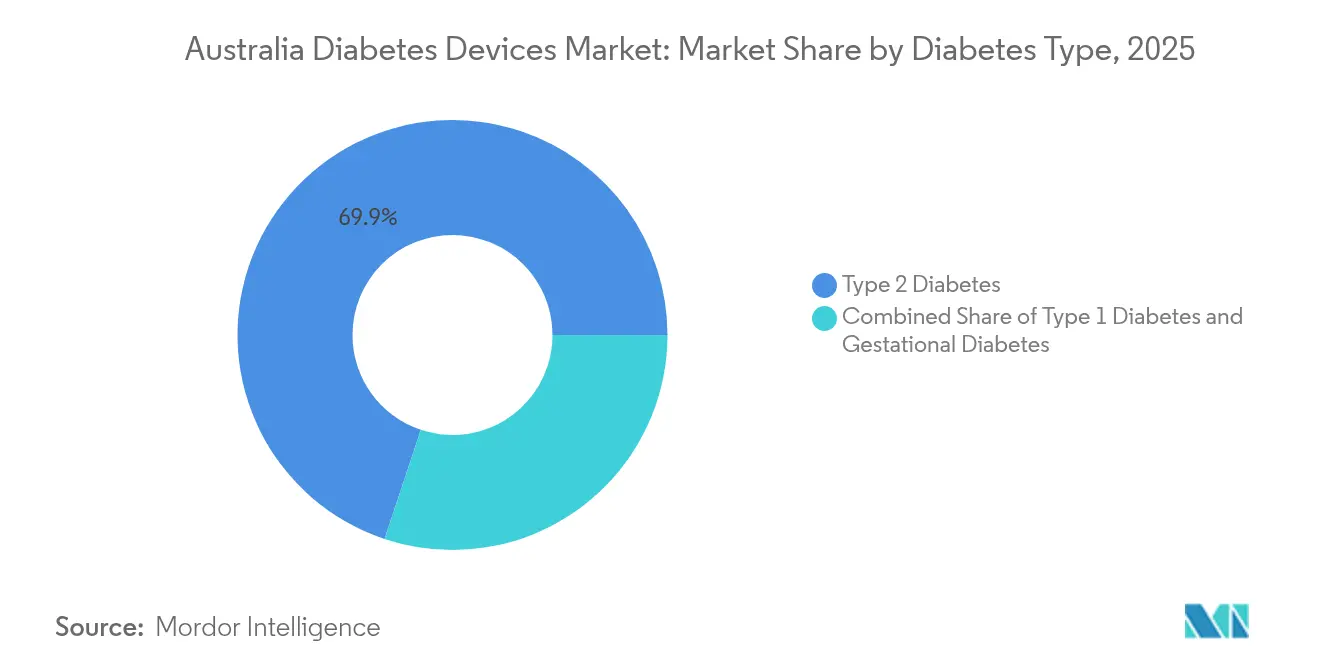
- By diabetes type, type 2 diabetes dominated with a 69.88% revenue share in 2025; type 1 diabetes is projected to expand at a 2.83% CAGR to 2031.
- By technology, invasive systems commanded 75.05% of the Australia diabetes devices market size in 2025, yet non-invasive systems are on track for a 3.17% CAGR during the forecast.
Note: Market size and forecast figures in this report are generated using Mordor Intelligence’s proprietary estimation framework, updated with the latest available data and insights as of 2026.
Australia Diabetes Devices Market Trends and Insights
Drivers Impact Analysis*
| Driver | (~) % Impact on CAGR Forecast | Geographic Relevance | Impact Timeline |
|---|---|---|---|
| Expansion of CGM Reimbursement via NDSS & Private Health Funds | +0.8% | National, with higher impact in metropolitan areas | Medium term (2-4 years) |
| Escalating diabetes prevalence—especially Type 2—fueling sustained demand for both monitoring and insulin-delivery technologies | +0.6% | National, with higher rates in Indigenous communities and rural areas | Long term (≥ 4 years) |
| Rapid uptake of digital health and telehealth services that integrate CGM data with My Health Record, boosting clinical adoption | +0.4% | National, with initial concentration in urban centers | Medium term (2-4 years) |
| Surge in Local R&D for Non-Invasive CGM (e.g., Opuz Bioimpedance Ring) | +0.3% | Concentrated in innovation hubs in major cities | Long term (≥ 4 years) |
| Accelerated rollout of next-generation solutions | +0.25% | National | Short term (≤ 2 years) |
| Corporate Wellness Programs Integrating Connected Glucose Sensors | +0.2% | Limited to major metropolitan areas | Short term (≤ 2 years) |
| Source: Mordor Intelligence | |||
Expansion of CGM reimbursement via NDSS & private health funds
National reimbursement initiatives have transformed the Australia diabetes devices market by removing upfront cost barriers for real-time CGM. The NDSS CGM Initiative, which subsidises CGM for every person with type 1 diabetes, lifted utilisation from 5% to as high as 79% among eligible users [1]Australian Bureau of Statistics, “Diabetes affects one in 15 Australians,” abc.net.au Source: National Diabetes Services Scheme, “FreeStyle Libre 2 Plus to be subsidised through the NDSS,” ndss.com.au . Insurers have complemented this policy, funding sensors for high-risk pregnancies and paediatric cohorts. Evidence from cost-utility studies shows an incremental cost-effectiveness ratio of AUD 39,518 per quality-adjusted life-year versus self-funded use [2]Pease A. J. et al., “Nationally Subsidized Continuous Glucose Monitoring: A Cost-effectiveness Analysis,” diabetesjournals.org. Heightened public coverage has also stimulated manufacturer competition, prompting quicker rollouts of next-generation sensors with longer wear time and factory calibration.
Escalating diabetes prevalence driving device demand
Diagnosed diabetes cases reached 1.3 million in 2025, with an additional 500,000 people undiagnosed, underscoring unmet monitoring needs. Type 2 diabetes accounts for seven in ten cases and is rising fastest in lower-income and Indigenous populations. The Australia diabetes devices market benefits directly, as primary-care guidelines encourage earlier CGM initiation for complex type 2 profiles. Advocacy groups are lobbying to extend NDSS subsidies from type 1 to insulin-requiring type 2 cohorts, a policy change that could lift sensor volumes by a further 20%.
Rapid uptake of digital health and telehealth services
Permanent Medicare telehealth item numbers now cover remote diabetes consultations, embedding virtual care into routine practice. Meta-analyses show that telemedicine linked to CGM data trims HbA1c by 0.37% on average, a clinically meaningful improvement [3]Ravi S. et al., “Effect of Virtual Care in Type 2 Diabetes Management,” bmchealthservres.biomedcentral.com. Urban providers pioneered these services, but adoption is accelerating in regional centres where internet connectivity has improved. Vendors are racing to certify cellular-enabled sensors that auto-populate My Health Record, streamlining shared‐care models between endocrinologists, GPs, and credentialled diabetes educators.
Local R&D for non-invasive CGM
Research bodies and med-tech start-ups have secured new federal grants to build optical and electrochemical sensors that avoid skin pierce. Early laboratory data from optical spectroscopy platforms suggest accuracy within ±15 mg/dL over hypoglycaemic ranges. Although no non-invasive product has yet reached Therapeutic Goods Administration (TGA) approval, clinical trials planned for 2025-2027 signal a strategic pivot for the Australia diabetes devices market toward pain-free monitoring. Industry observers expect these pipelines to attract co-development deals with multinational device firms once reliability hurdles are cleared.
Restraints Impact Analysis*
| Restraint | (~) % Impact on CAGR Forecast | Geographic Relevance | Impact Timeline |
|---|---|---|---|
| High Out-of-Pocket Cost of Pump Consumables outside Insurance Cover | -0.5% | National, with greater impact in lower socioeconomic areas | Medium term (2-4 years) |
| Limited Interoperability between Imported Pumps & Local Apps | -0.3% | National | Short term (≤ 2 years) |
| Workforce and training gaps | -0.35% | Rural and remote regions | Long term (≥ 4 years) |
| Stringent TGA Post-Market Surveillance Slowing New Launches | -0.2% | National | Medium term (2-4 years) |
| Source: Mordor Intelligence | |||
High out-of-pocket cost of pump consumables outside insurance cover
While public and private schemes offset sensor costs, many Australians still pay USD 4,600-USD 6,600 equivalent for pump consumables across a four-year warranty cycle. Parliamentary modelling shows universal pump subsidies would require up to AUD 749 million over forward estimates. Price pressures deter uptake among low-income adults, contributing to slower penetration of automated insulin delivery systems beyond paediatric segments. The Australia diabetes devices market therefore faces a ceiling effect until funding parity with CGM is achieved.
Limited interoperability between imported pumps & local apps
Consumers increasingly want flexible ecosystems where any approved sensor can pair with any pump and smartphone interface. Imported pumps often rely on proprietary protocols, limiting local app integration and spawning do-it-yourself closed-loop workarounds. Clinicians value innovation but express liability concerns because these DIY systems fall outside TGA approval. The Australia diabetes devices market risks fragmentation unless industry and regulators collaborate on open-standard architectures that mitigate safety and warranty issues.
*Our forecasts treat driver/restraint impacts as directional, not additive. The impact forecasts reflect baseline growth, mix effects, and variable interactions.
Segment Analysis
By Device Type: Monitoring devices dominate while therapy systems accelerate
Monitoring devices generated 56.62% of Australia diabetes devices market revenue in 2025 and represent the anchor segment. Strong NDSS backing vaulted CGM penetration, making sensors routine even in primary care. At USD 408.6 million, the monitoring slice of the Australia diabetes devices market size benefits from frequent sensor replacement that ensures recurring revenue. The early-2025 addition of Dexcom G7 and FreeStyle Libre 2 Plus reinforced competitive intensity, with both brands offering twelve-hour warm-up times and predictive alert algorithms that satisfy national clinical guidelines.
Management devices earned the remaining share but are expanding at a 3.01% CAGR, the fastest within the portfolio. Evidence from multi-centre Queensland trials indicates that automated insulin delivery improves time-in-range by 15 percentage points, translating to lower complication risk and stronger payer support. If the proposed universal pump subsidy passes Parliament by 2026, uptake could propel the therapy segment to USD 392.4 million by 2031, thereby shrinking the gap between monitoring and management categories within the Australia diabetes devices market.



By End User: Hospital leadership persists as home-care gains momentum
Hospital systems contributed 47.85% of Australia diabetes devices market share in 2025 because they are the primary enrolment point for pump initiation, sensor training, and acute complication management. Large metropolitan teaching hospitals run specialised diabetes technology clinics that standardise device selection protocols. In rural regions, district hospitals rely on visiting nurse educators, yet still dominate procurement budgets, reinforcing hospital grip on the supply chain of the Australia diabetes devices market.
Home-care settings are climbing at a 2.91% CAGR as telehealth compresses geographic constraints. A national survey showed 64% of sensor users now transmit real-time glucose data to clinicians from home, reducing routine clinic visits. Private insurers are piloting bundled payment models that provide sensors, smart pens, and virtual coaching under a single premium. This shift encourages longer-term adherence, suggesting home-care could surpass 35.00% revenue share of the Australia diabetes devices market by 2031.
By Diabetes Type: Type 2 volume dominates; type 1 captures technology uptick
Type 2 diabetes represented 69.88% of device sales, equal to roughly USD 504.1 million of Australia diabetes devices market size in 2025. Although NDSS funding focuses on type 1, demand from insulin-requiring type 2 users is growing, with private insurers offering partial rebates for sensors when HbA1c exceeds 8%. Extending public reimbursement would unlock a sizeable latent market, particularly in Indigenous populations where prevalence is triple the national average.
Type 1 diabetes accounts for fewer absolute users yet is forecast to grow at 2.83% annually on the back of universal CGM coverage and potential pump subsidies. Advocacy groups forecast 80% pump uptake four years after subsidy implementation, a scenario that would elevate type 1 contributions to 35.10% of Australia diabetes devices market revenue. The segment obtains disproportionate media visibility, reinforcing patient awareness and accelerating technology turnover.
By Technology: Invasive platforms hold sway while non-invasive research matures
Invasive systems comprised 75.05% of 2025 turnover because they meet accuracy thresholds and enjoy established NDSS reimbursement. References to finger-stick meters persist, yet multi-sensor CGM platforms increasingly dominate the invasive category. Manufacturers invest in extended-wear cannulas and silicone adhesives to cut skin irritation, thereby bolstering retention within an already sizeable portion of the Australia diabetes devices market.
Non-invasive concepts such as spectroscopic wristbands and bio-impedance skins have moved from bench to first-in-human testing. Academic-industry consortia in Sydney and Melbourne are preparing pivotal trials that, if successful, could peel market share away from invasive incumbents post-2028. Anticipated regulatory guidance from the TGA on analytical performance standards will determine the timeline for commercial launch, but analysts still expect non-invasive revenue to surpass USD 68.7 million by 2031, reflecting a meaningful yet yet modest slice of Australia diabetes devices market share.
Geography Analysis
Metropolitan hubs—Sydney, Melbourne, Brisbane, and Perth—collectively generate roughly 64.90% of Australia diabetes devices market value. These cities house the highest concentration of endocrinologists, diabetes educators, and tertiary hospitals, which eases patient induction into CGM and pump programs. Private health coverage is also highest in these regions, amplifying out-of-pocket purchasing power for adjunct sensors that fall outside NDSS schedules.
Regional cities such as Townsville, Cairns, and Launceston exhibit rising sensor uptake after state governments rolled out tele-endocrinology networks funded through the Medicare Benefits Schedule. Average HbA1c fell by 0.4 percentage points among sensor users enrolled in Queensland’s virtual care program, showcasing clinical gains that justify further infrastructure spending. As 5G connectivity reaches more regional postcodes by 2027, the Australia diabetes devices market expects faster device data uploads and lower dropout rates.
Remote and Indigenous communities across the Northern Territory and Western Australia face logistical barriers that suppress utilisation. Transport costs, intermittent refrigeration for insulin, and cultural preferences complicate device adherence despite higher disease burden. Pilot projects that ship sensors via drone and employ community health workers for training have shown early success but require long-term funding to scale. The government’s Closing the Gap strategy now lists CGM access as a measurable target, suggesting public procurement will expand in these underserved geographies of the Australia diabetes devices market.
Regulatory Landscape
Diabetes devices in Australia are regulated by the Therapeutic Goods Administration (TGA) under the Therapeutic Goods Act 1989 and the Therapeutic Goods (Medical Devices) Regulations 2002. In most cases, products must be included in the Australian Register of Therapeutic Goods (ARTG) before supply, and sponsors (as Australian legal entities) are accountable for compliance with the Essential Principles covering safety and performance, technical documentation, and adverse event reporting.
For device-drug combinations (such as insulin delivery systems and connected components), the TGA boundary and combination products framework guides classification and the applicable pathway, which can affect evidence requirements and time-to-market. A key near-term compliance anchor is the Australian Unique Device Identification (UDI) reform, established via the Therapeutic Goods Legislation Amendment (Australian Unique Device Identification Database and Other Measures) Regulations 2025. Mandatory UDI labelling requirements for most medical devices begin from 1 July 2026, increasing implementation work across labeling, packaging, and downstream distribution systems.
Value Chain Analysis
The value chain is led by global manufacturers of CGM sensors, insulin delivery hardware, and diabetes management consumables. In Australia, sponsors are responsible for ARTG inclusion, Essential Principles compliance, and post-market obligations. Because CGM and pump workflows depend on connected ecosystems, software-based medical-device compliance and documentation run alongside physical manufacturing and quality systems as practical gates for commercialization and lifecycle updates.
Distribution is shaped by the National Diabetes Services Scheme (NDSS), which supplies subsidized diabetes products through approved Access Points, commonly community pharmacies, with logistics partners (for example, CSO Distributors) supporting national replenishment. Recent supply-side actions also affect continuity of care in device-drug combinations. In December 2025, TGA communications flagged discontinuations and transitions for certain insulin presentations (including pens and cartridges) by major manufacturers such as Novo Nordisk and Eli Lilly, increasing the need for coordinated patient transition, pharmacy stocking adjustments, and clinician education. At the same time, Commonwealth procurement activity is exploring updated NDSS supply-chain solutions (including end-to-end order management and improved distribution into remote areas), creating roles for technology and logistics providers that can meet traceability and service-level requirements.
Competitive Landscape
Abbott, Medtronic, and Dexcom commanded major share of Australia diabetes devices market revenue in 2025. Abbott leads in sensor volume on the back of its FreeStyle Libre franchise and secured rapid NDSS listing for the Libre 2 Plus, which adds optional alarms while retaining factory calibration. Dexcom differentiates through real-time connectivity, and early 2025 rollout of the G7 platform cut warm-up periods to 30 minutes, reinforcing adherence advantages.
Medtronic leverages its legacy pump installed base and capitalises on its Simplera sensor partnership with Abbott to craft a unified automated insulin delivery ecosystem. Cross-licensing between the two giants underscores consolidation tendencies inside the Australia diabetes devices market, aligning hardware roadmaps and reinforcing influence with payers.
Challenger brands focus on niche innovation. Tandem, distributed locally by AMSL Diabetes, gained TGA approval for an algorithm update enabling automatic correction boluses. Small Australian start-ups concentrate on photonic sensing and wearable patch pumps that cater to athletes and gestational diabetes segments. These contenders often secure government R&D tax incentives and collaborate with university hospitals for trial recruitment, giving them a modest yet growing footprint that keeps the Australia diabetes devices market dynamically competitive.
Australia Diabetes Devices Industry Leaders
Abbott Diabetes Care
Novo Nordisk A/S
Medtronic PLC
Dexcom Inc.
Roche Diabetes Care
- *Disclaimer: Major Players sorted in no particular order

Market Opportunities and Future Outlook
A major whitespace is NDSS-funded access to CGM for insulin-dependent type 2 diabetes, where subsidy expansion is being evaluated through Australia’s health technology assessment pathway. MSAC consultation for Application 1785 on NDSS funding for the Dexcom ONE+ CGM system for people with insulin-dependent type 2 diabetes concluded in June 2026, and a July 2026 MSAC re-evaluation date has been flagged for CGM public-funding applications involving Abbott Australasia and Australasian Medical & Scientific Limited (AMSL). This sets up a defined market access inflection point for manufacturers and local partners, with differentiated submissions focused on cost-effectiveness, training burden, and interoperability with care pathways that feed into My Health Record-enabled shared care.
Opportunities also run through automated insulin delivery (AID) affordability and ecosystem interoperability, given the market’s sensitivity to out-of-pocket pump consumables and the policy debate around broader pump/AID support. Sector bodies have proposed quantified investment to extend technology access, including an initiative framed around AID subsidies for 38,000 people with type 1 diabetes and CGM subsidies for 16,000 people with type 2 diabetes over four years, keeping funding expansion on the agenda for payers and policymakers. On the innovation front, Australian translational programs are supporting next-generation combination approaches. Endo Axiom advanced smart oral insulin toward Phase 1a/1b clinical trials with funding linked to MTPConnect’s TTRA program (noted in 2025 and followed by additional funding in April 2026), reinforcing a pipeline of locally backed clinical development that can draw co-development, trial infrastructure investment, and specialized regulatory support services.
Recent Industry Developments
- June 2026: Abbott updated NDSS supply by discontinuing the FreeStyle Libre 2 sensor (NDSS Code 970), with delisting effective 1 July 2026 and users transitioned to FreeStyle Libre 2 Plus. The change concentrates NDSS volumes into newer SKUs and requires pharmacies, educators, and clinics to manage changeovers without interrupting sensor continuity.
- March 2025: The Australian Government, through the NDSS, commenced subsidy of the Dexcom G7 CGM sensor from 1 March 2025. Public reimbursement lowered access barriers and increased competitive pressure on incumbent CGM platforms to match performance, service, and clinician-training support at scale.
- September 2024: Dexcom introduced the Dexcom G7 CGM system in Australia for people with diabetes aged two years and older. The launch strengthened the premium CGM segment and supported faster upgrade cycles as clinics and patients compared newer sensor form factors and alert capabilities.


Research Methodology Framework and Report Scope
Market Definition and Coverage
This market covers diabetes care devices sold and used in Australia to monitor blood glucose and support diabetes management, including related device software where it is packaged with the device offering.
Scope exclusions: We exclude diabetes drugs, general hospital consumables not specific to diabetes device use, and broader wellness wearables that are not designed for diabetes monitoring.
Segmentation Overview
- By Device Type
- Management Devices
- Insulin Pumps
- Pump Device
- Reservoir
- Infusion Set
- Insulin Syringes
- Cartridges in Re-usable Pens
- Disposable Insulin Pens
- Jet Injectors
- Insulin Pumps
- Monitoring Devices
- Self-Monitoring Blood Glucose
- Glucometer Devices
- Test Strips
- Lancets
- Continuous Glucose Monitoring
- Sensors
- Durables / Transmitters
- Emerging Non-Invasive CGM Prototypes
- Self-Monitoring Blood Glucose
- Management Devices
- By End User
- Home-Care Settings
- Hospitals
- Specialty Diabetes Clinics
- Community & Retail Pharmacies (Point-of-Care)
- By Diabetes Type
- Type 1 Diabetes
- Type 2 Diabetes
- Gestational Diabetes
- By Technology
- Invasive Systems
- Minimally Invasive Systems
- Non-Invasive Systems
Data Sources, Market Sizing, and Validation
Desk Research
We start by building a clean demand and supply picture from public sources so the model has real anchors before assumptions are added. Inputs come from the Australian Institute of Health and Welfare for the diabetes burden, the Australian Bureau of Statistics for population and age mix, and peer reviewed clinical journals for adoption patterns across monitoring and insulin delivery.
To keep the pricing and access side realistic, we also review listings and updates from the national reimbursement environment, along with product documentation and safety notices from official regulator websites where relevant. Company annual reports, investor presentations, and credible health sector press are used to understand portfolio mix and channel direction, and paid subscriptions for company financials and patent databases are used selectively to cross-check revenue direction and innovation intensity. The desk sources above are illustrative only, and other public references were also used to collect, validate, and clarify data points.
Primary Interviews and Surveys
Next, we validate key assumptions through expert interviews and structured surveys with manufacturers, distributors, pharmacy and hospital stakeholders, diabetes educators, and clinical specialists who see device usage in practice. The respondent input was used to confirm adoption of CGM versus SMBG, typical replacement cycles for durables, realistic price movement, and how reimbursement and tenders shift mix across care settings, and then the findings were compared back to desk signals before finalizing totals.
Distribution of primary research fieldwork respondents
| Company type | Respondent position |
|---|---|
| Top tier: 33% | CXOs: 16% |
| Mid tier: 51% | Functional/Unit leaders: 36% |
| Smaller Players: 16% | Managers: 48% |
Market-Sizing & Forecasting
Sizing is built with a top-down path that reconstructs the addressable demand pool from Australia diabetes prevalence and treated population, and then applies device adoption and usage logic to convert that pool into annual device value. Once the main totals are formed, they are checked with selective bottom-up approximations, such as sampled ASP times volume for strips and sensors, and supplier and channel checks for pump and pen volumes, so the outputs stay practical.
Key inputs we track include the mix shift between CGM and SMBG, sensor and strip consumption rates, replacement cycles for durables like meters and pumps, reimbursement coverage changes, and the share of use occurring in home care versus institutional settings. Forecasting uses scenario analysis supported by expert views, where adoption and price paths are varied within realistic bands, followed by smoothing to avoid step changes unless a policy or access event supports it. When direct volume signals are patchy for smaller sub-categories, gaps are handled through proxy ratios from adjacent components and then re-tested against what respondents report as typical purchasing behavior.
Data Validation & Update Cycle
We run multi-step validation so the final series is internally consistent and also consistent with external health and device signals. Outputs are cross-checked against independent indicators like diagnosed population trends, reimbursement updates, and the implied per patient device spend, and then variances are reviewed until the drivers are clear.
Before sign-off, another analyst reviews assumptions, unit conversions, and year-over-year movements, and follow-up outreach is triggered if any result conflicts with what market participants describe as normal buying patterns. Reports are refreshed annually, and interim updates are made when material events occur, such as a reimbursement change or a major technology shift. Right before delivery, a final pass is completed so clients receive the most current view that can be supported by traceable inputs.
Mordor Intelligence's Australia Diabetes Devices Market Size Versus Other Published Estimates
Published market sizes for Australia diabetes devices can look far apart because groups do not always count the same device basket, and they can also treat software, supplies, and channel markups differently. Differences also come from the year selected as the base and whether the estimate is anchored to diagnosed patients, treated patients, or a broader wellness monitored population.
In this study, the largest gap drivers are usually whether CGM sensors and transmitters are counted as recurring device revenue, how insulin delivery supplies are bundled with pumps and pens, and how reimbursement changes are timed in the year. Another recurring issue is pricing, where some figures apply aggressive ASP expansion across sensors and pumps without checking local tender and reimbursement realities, and then the totals move quickly away from what channel participants observe.
Benchmark comparison
| Source | Market Size | Gaps in Research Methodology |
|---|---|---|
| Mordor Intelligence | USD 721.44 M (2025) | |
| Global Consultancy A | USD 1.45 B (2024) | Uses an earlier base year and a broader device definition that can bundle diabetes care device revenues more widely, which can lift totals when recurring supplies and channel pricing are treated less consistently. |
| Industry Publisher B | USD 117.80 M (2025) | Narrow product scope focused on insulin pumps and related accessories only, which omits larger monitoring revenue pools such as CGM and SMBG components. |
The table shows that scope choice explains most of the spread, and then base year and price logic widen it further. When monitoring devices and insulin delivery are counted together, and recurring components like sensors and strips are treated using usage rates and replacement cycles that align with local access conditions, the resulting total stays more stable, which is the approach used here by Mordor Intelligence.


Key Questions Answered in the Report
How big is the Australia Diabetes Care Devices Market?
The Australia Diabetes Care Devices Market size is expected to reach USD 738.97 million in 2026 and grow at a CAGR of 2.43% to reach USD 832.6 million by 2031.
Which device category holds the largest share of spending?
Monitoring devices, especially continuous glucose monitoring systems, account for 56.62% of Australia diabetes devices market revenue in 2025.
Who are the key players in Australia Diabetes Care Devices Market?
Abbott Diabetes Care, Novo Nordisk A/S, Medtronic PLC, Dexcom Inc. and Roche Diabetes Care are the major companies operating in the Australia Diabetes Care Devices Market.
Are insulin pumps widely reimbursed in Australia?
CGM sensors enjoy national reimbursement, but pump consumables still carry significant out-of-pocket costs; a parliamentary proposal to subsidise pumps nationwide remains under review.
Page last updated on:





