
Market Overview
| Study Period | 2020 - 2031 |
|---|---|
| Forecast Data Period | 2026 - 2031 |
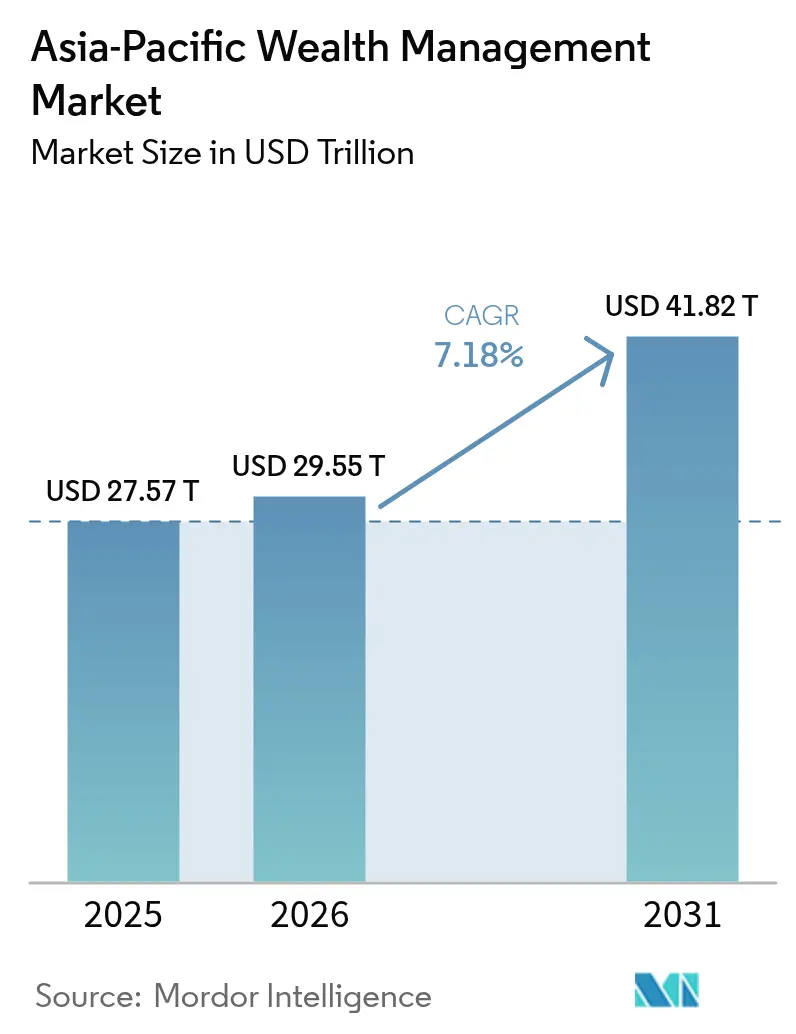
| Base Year Market Size (2025) | USD 27.57 Trillion |
| Market Size (2026) | USD 29.55 Trillion |
| Market Size (2031) | USD 41.82 Trillion |
| Growth Rate (2026 - 2031) | 7.18 % |
| Market Concentration | Low |
Major Players *Disclaimer: Major Players sorted in no particular order Image © Mordor Intelligence. Reuse requires attribution under CC BY 4.0. | |
Asia-Pacific Wealth Management Market Analysis by Mordor Intelligence
The Asia-Pacific wealth management market size was valued at USD 27.57 trillion in 2025 and estimated to grow from USD 29.55 trillion in 2026 to reach USD 41.82 trillion by 2031, at a CAGR of 7.18% during the forecast period (2026-2031). Sustained urbanization, expanding middle-class affluence, and a widening embrace of low-cost robo-advisory models are the primary forces propelling revenue expansion, while ongoing regulatory liberalization under schemes such as RCEP widens cross-border product access and fundraising channels. China’s sheer scale anchors regional growth, yet India’s double-digit momentum signals a clear diffusion of new wealth creation across technology-centric economies. At the same time, environmental, social, and governance (ESG) imperatives shape allocation decisions as APAC investors pivot toward sustainable instruments ranging from green bonds to social-impact private equity. The competitive landscape is intensifying as private banks focus on preserving their relationship-driven business models, while fintech specialists leverage fee reductions to attract younger, digitally-native customer segments.
Key Report Takeaways
- By client type, high-net-worth individuals (HNWI) held 42.74% of the Asia-Pacific wealth management market share in 2025; retail and individual clients are projected to post the fastest 8.41% CAGR through 2031.
- By provider, private banks commanded a 37.05% share of the Asia-Pacific wealth management market size in 2025, while fintech advisors (under others) are advancing at a 15.74% CAGR to 2031.
- By geography, China contributed 47.85% of the regional revenue of the Asia-Pacific wealth management market in 2025; India is forecast to record the swiftest 12.27% CAGR over the same horizon.
Note: Market size and forecast figures in this report are generated using Mordor Intelligence’s proprietary estimation framework, updated with the latest available data and insights as of 2026.
Market Trends and Insights
Drivers Impact Analysis of Asia-Pacific Wealth Management Market*
| Driver | (~) (%) Impact on CAGR Forecast | Geographic Relevance | Impact Timeline |
|---|---|---|---|
| Rising digital-first advisory & robo-advisory adoption | +1.5% | Singapore, Hong Kong, Tokyo, and emerging Southeast Asia | Medium term (2-4 years) |
| Rapid expansion of affluent middle class & HNWI base | +1.2% | China, India, Indonesia | Long term (≥4 years) |
| Ongoing regulatory liberalization across APAC hubs | +0.8% | All core financial centers | Medium term (2-4 years) |
| Growing appetite for ESG & sustainable investing | +1.1% | Developed APAC, China, Australia | Long term (≥4 years) |
| Emergence of tokenized assets & digital custody platforms | +0.9% | Singapore, Hong Kong, Japan, Australia | Short term (≤2 years) |
| RCEP-driven cross-border wealth programs | +0.7% | RCEP members | Medium term (2-4 years) |
| Source: Mordor Intelligence | |||


Rising Digital-First Advisory & Robo-Advisory Adoption
In 2024, the assets under management for robo-advisory services in Singapore experienced substantial growth, while digital platforms in Hong Kong attracted billions in new assets. These trends highlight a pronounced consumer transition toward algorithm-based portfolio management solutions. The competitive landscape is intensifying as private banks focus on preserving their relationship-driven business models, while fintech specialists leverage fee reductions to attract younger, digitally-native customer segments. Japan's major banks implemented AI-driven portfolio engines, enhancing customer engagement and achieving operational cost efficiencies within the same period. Regulators now provide clear guardrails. Australia’s ASIC sandbox issued 23 fresh robo licenses in 2024, signaling a sustained runway for digital advice penetration[1]Credit Suisse, “Global Wealth Report 2024,” credit-suisse.com .
Rapid Expansion of Affluent Middle Class & HNWI Base
In 2024, the Asia-Pacific region recorded an 8.8% annual growth in High-Net-Worth Individuals (HNWIs), outperforming the global average. This growth was primarily attributed to the expansion of technology-driven entrepreneurship and the positive impact of equity-market performance[2]Australian Securities and Investments Commission, “Innovation Hub Licenses 2024,” asic.gov.au . The chaebol ecosystem in South Korea experienced an expansion in ultra-wealthy families, driven by increased chip and battery exports that significantly boosted share valuations. Wealth concentration remains prominent across Southeast Asia, driven by Indonesia's resource industry leaders, Malaysia's digital entrepreneurs, and Thailand's real estate investors, who have collectively contributed to the growth of investable wealth. The development of Asia-focused single-family offices continues to advance, with 2024 witnessing the establishment of new entities, primarily registered in Singapore, Hong Kong, and mainland China.
Ongoing Regulatory Liberalization Across APAC Hubs
Policymakers continue to refine market-access rules to attract asset inflows. In 2024, Singapore's Variable Capital Company (VCC) framework facilitated the inflow of new fund domiciles, driven by its adaptable sub-fund segregation and tax-efficient structure. Over the past year, Hong Kong has enhanced its Wealth Management Connect framework by expanding the range of eligible funds and streamlining processes to enable smoother southbound capital flows. Japan’s looser foreign-advisor entry norms lured global wealth firms to Tokyo, assisted by English-language filing requirements that eliminate translation bottlenecks. Australia’s fintech-friendly sandbox accelerated license approvals, while Thailand and Malaysia offered tax holidays and streamlined documentation to wealth boutiques. Such harmonization produces jurisdiction-shopping opportunities for providers optimizing cost, speed, and client confidentiality.
Growing Appetite for ESG & Sustainable Investing
China’s net-zero pledge fueled USD 150 billion in green bond issuance, and wealth managers quickly packaged thematic strategies around renewables and clean tech[3]China Banking and Insurance Regulatory Commission, “Family-Office Policy Note,” cbirc.gov.cn . Japan’s USD 1.7 trillion Government Pension Investment Fund lifted ESG holdings of its vast portfolio, catalyzing copy-cat allocations by domestic private banks [4]Government Pension Investment Fund Japan, “ESG Allocation Review,” gpif.go.jp. The implementation of policy tools such as South Korea's K-taxonomy and Australia's mandatory climate disclosures marks a pivotal advancement in institutionalizing ESG metrics and reporting standards. These initiatives are designed to drive greater transparency, improve accountability, and facilitate comparability in environmental, social, and governance practices across various industries. By embedding ESG considerations into regulatory frameworks, these policies aim to align corporate practices with global sustainability goals and investor expectations.
Restraints Impact Analysis of Asia-Pacific Wealth Management Market*
| Restraint | (~) (%) Impact on CAGR Forecast | Geographic Relevance | Impact Timeline |
|---|---|---|---|
| Heightened market volatility & macro-economic uncertainty | -0.9% | Global, with acute impacts in export-dependent economies | Short term (≤ 2 years) |
| Rising AML/KYC compliance costs & complexity | -1.1% | Global, with the highest burden in cross-border operations | Medium term (2-4 years) |
| Acute talent crunch in senior relationship & ESG specialists | -0.6% | APAC core, with severe shortages in Singapore, Hong Kong | Medium term (2-4 years) |
| Data-localisation rules hindering regional digital platforms | -0.4% | China, India, and Indonesia, with cross-border spillover effects | Long term (≥ 4 years) |
| Source: Mordor Intelligence | |||
Heightened Market Volatility & Macro-Economic Uncertainty
Geopolitical tensions and divergent monetary policies drove APAC equity-index volatility above historical averages in 2024. The regional VIX, a key measure of market volatility, reached elevated levels due to trade-related disruptions. Speculation regarding capital controls and corrections in China's property market resulted in significant portfolio outflows from emerging APAC exchanges during the first half of the year. Currency fluctuations intensified risks, with the Korean won experiencing a sharp decline against the USD, while the Thai baht and Malaysian ringgit also recorded substantial depreciations. These movements complicated hedging strategies for cross-border portfolios. In response to heightened uncertainty, wealth managers increased average cash allocations to levels not observed in four years, reducing exposure to alternative and illiquid investments. Additionally, the uncertain environment delayed a considerable proportion of planned family-office launches, as indicated by multiple industry surveys conducted across the region's primary exchanges.
Rising AML/KYC Compliance Costs & Complexity
In 2024, compliance expenditures across the Asia-Pacific (APAC) region for anti-money laundering (AML) regulations experienced significant growth, primarily attributed to increased false-positive rates and more rigorous beneficial ownership verification processes. Enhanced disclosure requirements in Singapore drove a marked rise in onboarding costs, while stricter suspicious transaction thresholds in Hong Kong resulted in a substantial increase in case review volumes. The onboarding process for complex structures now averages close to 50 days, negatively impacting client satisfaction and compressing advisory profit margins. Japan's Financial Services Agency (FSA) introduced stricter due diligence measures for foreign politically exposed persons (PEPs), leading to a notable escalation in annual screening expenses for major private banks. Although AI-powered watch-list solutions have effectively reduced false positives, the associated implementation costs have shifted economies of scale in favor of larger institutions, accelerating market consolidation.
*Our forecasts treat driver/restraint impacts as directional, not additive. The impact forecasts reflect baseline growth, mix effects, and variable interactions.
Asia-Pacific Wealth Management Market Segment Analysis
By Client Type:
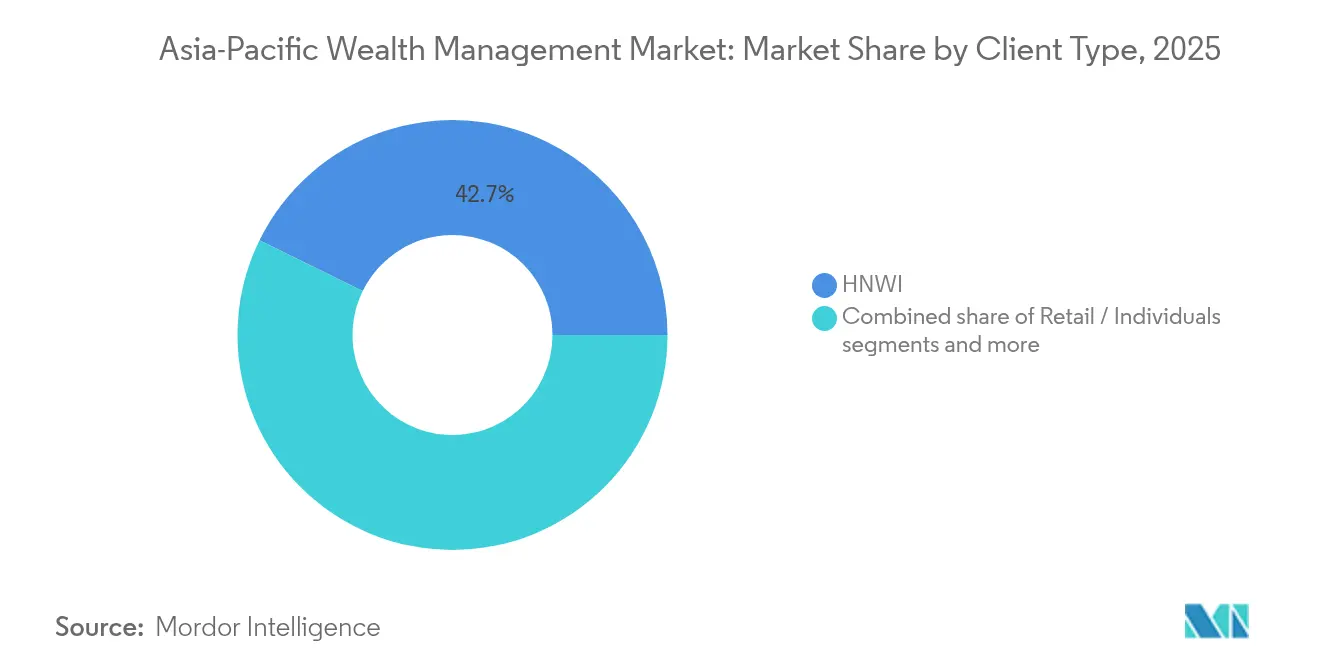
Retail Democratization Accelerates GrowthThe HNWI segment owns 42.74% of the Asia-Pacific wealth management market, while the retail investors are anticipated to expand their assets at a CAGR of 8.41% by 2031. This growth highlights a democratization trend that is transforming the Asia-Pacific wealth management market. By 2024, robo-advisors and hybrid digital-human models will have significantly expanded their presence in the retail sector, accumulating notable assets under management. The average account size has declined, representing a fraction of the historical thresholds set by private banks. However, high-net-worth individuals remain a critical revenue driver by utilizing bundled lending, succession planning, and access to alternative investments, which justify the prevailing fee structures. The Asia-Pacific wealth management market linked to the retail segment is anticipated to grow as consumer-grade platforms increasingly integrate features such as fractional private credit, REITs, and thematic ETFs. Conversely, the market share for high-net-worth individuals in the Asia-Pacific region may experience a slight decline, as younger mass-affluent segments are projected to achieve faster growth from a smaller base.
Institutional mandates, particularly from pension and sovereign funds, continue to provide stable inflows while extending beyond traditional advisory services into areas such as liability-driven investing. Singapore’s Central Provident Fund and Australia’s superannuation sector collectively manage substantial assets, offering specialist managers a revenue stream that remains insulated from fee compression due to regulatory support. Meanwhile, the convergence of expectations is reshaping the market landscape. Retail clients increasingly demand institutional-grade analytics, while pension trustees seek mobile interfaces that align with the user experience standards of retail banking.


By Provider:
FinTech Disruption Reshapes Competitive DynamicsFinTech platforms covered under are projected to expand revenue at a 15.74% CAGR, the sharpest trajectory across provider types within the Asia-Pacific wealth management market. Their transparent, flat-fee propositions and 24/7 app-based servicing resonate with affluent millennials who prioritize cost, immediacy, and intuitive UX. Private banks still own 37.05% of assets, sustained by multigenerational relationships, credit provision, and global custody reach, yet margin compression intensifies as clients benchmark fees to digital alternatives. Fintech players are projected to capture a significant share of the Asia-Pacific wealth management market by the end of the decade, driven by prevailing growth trends. The market is witnessing a shift toward hybrid models, as established firms incorporate robo-advisory technologies into their operations, while fintech companies strategically recruit experienced bankers to attract ultra-high-net-worth individuals (UHNWIs), reflecting a bidirectional convergence.
Independent asset managers are utilizing liberal licensing frameworks to offer specialized services, such as ESG-focused investments, impact-driven mandates, and Islamic-compliant portfolios, without incurring the substantial costs associated with full-service private banks. Simultaneously, family offices are adopting a dual role as both clients and competitors. These entities are internalizing portfolio construction processes while outsourcing execution to prime brokers and fintech custodians, thereby challenging traditional wallet-share models within the industry.
Geography Analysis
APAC Wealth Management Market
China generated 47.85% of regional revenue in 2025, underlining the Asia-Pacific wealth management market’s geographic concentration. Onshore family-office registrations surged, with new structures incorporated after Beijing refined qualified domestic investor quotas and eased outbound capital channels. Still, the Asia-Pacific wealth management market size tailwind now tilts toward India, whose 12.27% CAGR rests on tech IPO liquidity, pension reform and surging digital-brokerage penetration. Japan and Australia provide counterweight maturity; both house sophisticated investors and deep capital markets, generating steady though moderate inflows. South Korea’s chaebol fortunes and Southeast Asia’s commodity boom collectively add diversification, aided by RCEP cross-border passporting that simplifies distribution of UCITS-style funds throughout ASEAN+3 markets.
India Wealth Management Market
Recognizing that macro-volatility differs widely, providers localize hedging and credit-facility terms. For instance, currency-matched lending proliferates in Korea, whereas yuan-denominated discretionary portfolios dominate Chinese books. Risk frameworks therefore become as differentiated as the jurisdictions themselves. India’s upside derives from digital finance penetration and structural reform. The government’s Production-Linked Incentive schemes nurture manufacturing unicorns, while startup exits supply fresh liquidity for allocation to discretionary portfolios and angel funds. Mumbai and Bangalore anchor advisory talent, but tier-2 cities now foster boutique wealth firms tailored to local tech founders. Regulatory clarity—such as relaxed minimum ticket sizes for alternative investment funds—unlocks new product uptake, reinforcing India’s outsize CAGR within the Asia-Pacific wealth management market.
Regulatory Landscape
Regulation across Asia-Pacific continues to balance market-opening initiatives with tighter expectations on conduct, disclosure, and operational resilience for wealth managers, particularly as cross-border distribution and digital onboarding expand. In Singapore, the Monetary Authority of Singapore (MAS) implemented a revised framework for single family offices effective 15 June 2026, introducing a streamlined class exemption from licensing supported by notification and annual returns, and it also concluded enhancements to Product Highlights Sheets and a streamlined framework for complex products in May 2026. MAS further moved to reduce time-to-market for retail fund innovation via its 9 July 2026 consultation on amendments to the Code on Collective Investment Schemes, and reinforced technology controls through June 2026 proposals on Technology Risk Management notice amendments.
In Hong Kong, the Securities and Futures Commission (SFC) advanced cross-boundary participation by enhancing the Cross-Boundary Wealth Management Connect Pilot Scheme on 13 November 2025, including flexibility such as three-party dialogues between clients and advisers. Cross-border fund channels remain a visible anchor for regulatory coordination, with 40 Mainland MRF funds authorized by the SFC and 46 Hong Kong MRF funds approved by the China Securities Regulatory Commission as of 31 March 2026. Taiwan is also positioning as a hub through program-led rule changes, with its Financial Supervisory Commission reporting nearly NT$34 trillion in total AUM under the Asian Asset Management Center Initiative as of March 2025 and 25 regulatory amendments completed since launch.
Value Chain Analysis
The Asia-Pacific wealth management value chain begins with product manufacturing by asset managers and banks (mutual funds, structured notes, discretionary mandates, alternatives, ESG strategies) and moves through distribution and advisory, delivered by private banks, brokerages, independent wealth managers, and fintech platforms. Client acquisition and onboarding are increasingly mediated by digital channels, while portfolio construction and risk analytics rely on model portfolios, AI-assisted advisory tooling, and research. Execution, custody, and settlement sit downstream with banks, brokers, and digital custody providers, supported by fund administration and domiciliation services (notably via Singapore structures such as the VCC for certain strategies), followed by ongoing reporting and servicing across retail, HNWI, and institutional mandates.
Partnership activity in 2026 illustrates how providers are integrating this chain to broaden product shelves and improve advisory productivity. Maybank partnered with Swiss fintech Evooq to deploy an AI-powered advisory platform (Advisor Assist) to strengthen personalization and risk analytics at the advisory layer, while DBS signed an MOU with Samsung Securities in July 2026 to expand cross-border access to South Korean and global multi-asset solutions across its client bases. Product and platform collaboration also links manufacturing to distribution, as seen in Standard Chartered launching the Signature Select APAC Allocation Plus fund on its VCC platform with BlackRock (July 2026), and Bank of Ayudhya (Krungsri) partnering with Invesco (March 2026) to enhance investment solutions. These actions highlight the growing role of third-party managers and technology specialists in shortening product rollout cycles and expanding alternatives access.
Competitive Landscape
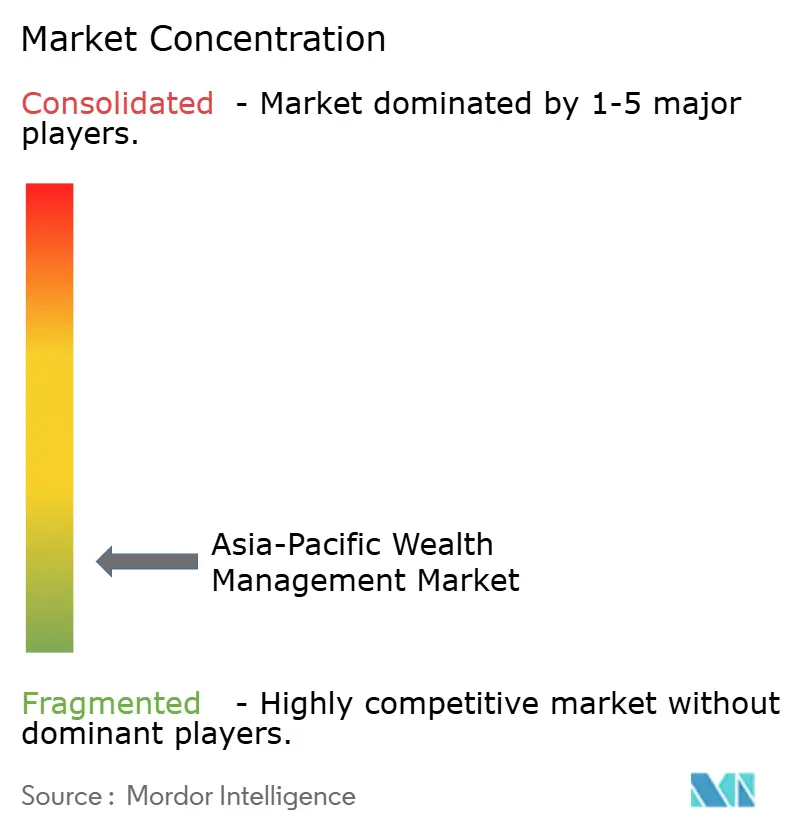
The top players collectively hold only one-fourth of assets, affirming a fragmented arena ripe for specialization and digital-driven capture. Private banking institutions are increasingly pursuing inorganic growth strategies, as demonstrated by UBS's acquisition of Credit Suisse's APAC division, to achieve scale, expand client portfolios, and onboard relationship managers efficiently. Concurrently, fintech challengers are leveraging advanced capabilities such as algorithmic tax-loss harvesting, fractional access to private markets, and API-driven onboarding processes that significantly reduce client setup durations. In the Asia-Pacific wealth management market, prominent banks are integrating in-house robo-advisory tools while forming partnerships with external AI vendors to expedite product development cycles.
Rising compliance costs, particularly the substantial annual expenditure on anti-money laundering initiatives, are driving consolidation as smaller firms face difficulties in amortizing regulatory technology investments. Opportunities remain underexplored in segments such as female entrepreneurship, Shariah-compliant wealth management, and the ESG-focused mass-affluent demographic, where incumbents have yet to establish culturally tailored engagement strategies. Technology continues to serve as a critical enabler, with blockchain custody services emerging as essential for tokenized real estate and private credit funds by offering reduced settlement risks and continuous audit capabilities. Providers that successfully integrate relationship-driven advisory services with highly efficient digital execution are positioned to establish a sustainable competitive advantage.
Asia-Pacific Wealth Management Industry Leaders
UBS Group AG
HSBC Holdings plc
Morgan Stanley
Credit Suisse
DBS Group
- *Disclaimer: Major Players sorted in no particular order
Asia-Pacific Wealth Management Market Companies Covered in this Report
- UBS Group AG
- HSBC Holdings plc
- Morgan Stanley
- Credit Suisse
- DBS Group
- Julius Bär Group
- Standard Chartered plc
- Citigroup Inc.
- Bank of China
- China Merchants Bank
- Bank of Singapore
- OCBC
- ANZ Banking Group
- Mitsubishi UFJ Financial Group
- Nomura Holdings
- Samsung Securities
- Mirae Asset
- Kotak Mahindra Bank
- ICICI Bank
- Ping An Bank
- LGT Group
- EFG International
- Eastspring Investments

Market Opportunities and Future Outlook
Named hub programs and rule changes are creating near-term whitespace for providers that can package compliant cross-border offerings and operate at scale. Singapore is a key anchor, with MAS implementing a revised single family office framework effective 15 June 2026 and consulting on CIS Code changes (9 July 2026) aimed at faster authorization of new retail fund types. Together, these measures support faster fund launches and a broader menu for advisory-led distribution. Hong Kong continues to deepen cross-border engagement through the SFC enhancements to Wealth Management Connect (13 November 2025), and the count of MRF funds authorized and approved as of 31 March 2026 points to continued institutionalization of mutual recognition channels that can be paired with digital onboarding and suitability workflows.
Commercial expansion actions in 2026 show where firms are committing capital and capacity, pointing to opportunities in hybrid servicing, alternatives distribution, and AI-enabled advice at both the mass-affluent and HNWI layers. DBS announced in June 2026 that it will open 18 new wealth centres and upgrade 36 facilities across Singapore, Hong Kong, mainland China, India, Indonesia, and Taiwan by end-2027, reinforcing physical advisory touchpoints alongside digital scaling. OCBC also disclosed a July 2026 plan to hire 600 relationship managers over three years and roll out an AI-native wealth app with 24/7 digital avatars, supported by annual infrastructure spend above S$1 billion, underscoring demand for productivity tools that compress onboarding and servicing time. In parallel, iCapital expanded alternatives distribution capacity in Hong Kong by doubling its office footprint to 9,000 square feet at One IFC in June 2026, reflecting ongoing needs for specialist sales, due diligence, and operational support around private markets access.
Recent Industry Developments in Asia-Pacific Wealth Management Market
- July 2026: DBS signed a memorandum of understanding with Samsung Securities to collaborate on wealth management, including enabling DBS clients to access South Korean market solutions and offering Samsung Securities clients access to multi-asset global wealth solutions. The tie-up strengthens cross-border product distribution and creates a platform for co-innovation in areas such as AI-enabled advisory and servicing across Asia.
- June 2026: DBS announced plans to open 18 new wealth centres and upgrade 36 existing facilities across Singapore, Hong Kong, mainland China, India, Indonesia, and Taiwan by end-2027, with an initial wave slated from Q3 2026. The expanded footprint supports a hybrid model where physical advisory capacity complements digital platforms for affluent and high-net-worth client engagement.
- April 2025: UBS entered an exclusive strategic collaboration with 360 ONE WAM in India, transferring its onshore wealth management business in India and taking a 4.95% stake in 360 ONE. The move deepens local distribution reach in a high-growth market while reshaping competitive intensity for domestic and global wealth managers targeting Indian HNWI and mass-affluent segments.


Asia-Pacific Wealth Management Market Report Scope and Research Methodology
Market Definition and Coverage
This market is defined as the total value of client assets that are professionally managed through wealth management offerings across Asia Pacific, including advised and discretionary mandates delivered through banks and non-bank providers.
Scope exclusions: Brokerage-only execution, pure corporate treasury management, and asset management activities that are not delivered as wealth management relationships are not counted.
Segments Covered in This Report
- By Client Type
- HNWI
- Retail / Individuals
- Other Client Types (Pension Funds, Insurance Cos., etc.)
- By Provider
- Private Banks
- Family Offices
- Others (Independent/External Asset Managers)
- By Geography
- India
- China
- Japan
- Australia
- South Korea
- South-East Asia (Singapore, Malaysia, Thailand, Indonesia, Vietnam, Philippines)
- Rest of Asia-Pacific
Data Sources, Market Sizing, and Validation
Desk Research
Desk research was used to set the outer guardrails for the model and to avoid overcounting assets that get reported in multiple places. We relied on public, repeatable data points such as central bank and financial regulator releases, national statistics agencies, IMF and World Bank indicators, and OECD financial accounts where available for the region.
To keep the market numbers practical, we also reviewed annual reports and investor presentations of major wealth and private banking providers, relevant stock exchange filings, and releases from industry associations and reputable financial press. For hard-to-compile company-level context, a paid subscription for company financials and news intelligence was used, and patent databases were checked to understand the direction of digital advisory capabilities. These desk sources are not exhaustive, and many other public references were also used to collect data, validate assumptions, and clarify definitions.
Primary Interviews and Surveys
Primary discussions were run with wealth managers, private bankers, investment advisors, platform teams, and product heads, followed by conversations with institutional experts who track household wealth and flows across Asia Pacific. We used these inputs to confirm AUM counting rules, typical product allocation shifts, and the practical split between advised, discretionary, and self-directed money so the final model did not rely only on published headline AUM.
Distribution of primary research fieldwork respondents
| Company type | Respondent position |
|---|---|
| Top tier: 26% | CXOs: 14% |
| Mid tier: 60% | Functional/Unit leaders: 42% |
| Smaller Players: 14% | Managers: 44% |
Market-Sizing & Forecasting
The core sizing starts with a top-down demand pool build where household financial wealth and investable assets are reconstructed by major Asia Pacific markets, and then filtered through wealth participation and professionally managed penetration rates. Once the regional totals are formed, they are allocated across wealth providers using reported AUM cues, channel mix signals, and interview-led checks on where assets are actually advised versus self-directed.
To make sure the outputs remain realistic, we corroborate totals using selective bottom-up approximations, such as sampled provider AUM roll-ups, country-level private banking and affluent book sizes, and volume-by-ASP style checks where fee schedules are visible. Key inputs used in the model include HNWI and mass affluent population trends, household savings rates, equity and bond market performance that drives valuation lift, cross-border booking intensity for hubs like Hong Kong and Singapore, and adoption of digital advisory that changes account coverage. Forecasts were built using scenario analysis, where base macro paths, market return assumptions, and savings and flow expectations are stress-tested with primary feedback, and gaps in provider reporting are handled through conservative proxy ratios that are rechecked in follow-up calls.
Data Validation & Update Cycle
Outputs are reviewed through stepwise variance checks, where country totals are compared against independent signals like household financial asset series, market cap movements, and the direction of reported AUM from major providers. Any outliers are traced back to an assumption, and when the cause is unclear, respondents are re-contacted to confirm whether the issue is definitional or a real market change.
Before sign-off, the model and write-up go through multiple analyst reviews so that the market math, year labels, and scope statements align. Reports are refreshed annually, and interim updates are triggered when material events change asset values or flows in a meaningful way. Right before delivery, we run a final pass to ensure the latest public releases are reflected in the numbers and commentary.
Mordor Intelligence's Asia Pacific Wealth Management Market Size Versus Other Published Estimates
Published market sizes for Asia Pacific wealth management often do not line up because the counted asset pool is not the same across sources, and the year used for valuation levels also changes the total. Differences usually come from what gets treated as wealth-managed assets versus simply investable wealth, and how cross-border assets booked in regional hubs are attributed back to client residence.
Execution-only brokerage assets sit outside Mordor Intelligence's scope, which reduces double counting when the same client portfolio is shown under trading platforms and under managed relationships. Gaps also appear when some sources apply aggressive market return assumptions for the current year, or when currency conversion uses different year-average rates instead of a consistent timing across markets.
Benchmark comparison
| Source | Market Size | Gaps in Research Methodology |
|---|---|---|
| Mordor Intelligence | USD 29.55 T (2026) | |
| Industry Marketplace A | USD 31.80 T (2024) | Uses an earlier base year and typically treats reported headline AUM as the market without consistently adjusting for self-directed assets that are not under advice, which can lift the total in strong valuation periods. |
| Industry Marketplace B | USD 34.38 T (2025) | Leans on broader wealth pool definitions in parts of the estimate, where investable assets and managed assets can blend, and cross-border hub assets may be attributed in a way that inflates regional totals. |
The spread mainly reflects what each source counts as managed wealth, the valuation year used, and whether cross-border booking is netted out cleanly. By keeping definitions tied to observable asset pools and then checking them with provider and country signals, the final number stays explainable and can be reproduced when new data comes in.


Key Questions Answered in the Report
What is the current value of the Asia-Pacific wealth management market?
The market stands at USD 29.55 trillion in 2026.
How fast is the market expected to grow?
It is projected to reach USD 41.82 trillion by 2031, registering a 7.18% CAGR.
Which client segment is expanding the quickest?
Retail and individual clients are advancing at an 8.41% CAGR through 2031.
Which provider type shows the fastest growth?
Fintech advisors lead with a forecast 15.74% CAGR as digital adoption accelerates.
Which country has the largest share of managed wealth?
China holds 47.85% of regional assets based on 2025 data.
Where is the highest CAGR expected geographically?
India is projected to expand at a 12.27% CAGR through 2031.
Page last updated on:




